Beautiful Breakout of Ascending Triangle.OBOY Analysis
Closed at 12.69 (09-01-2026)
Beautiful Breakout of Ascending Triangle.
10.90 - 11.55 seems to be a very Important Support.
Upside resistance is around 16, however mid way
resistance still lies around 12.50 - 13.50
Breaking 10 may bring the price towards 9 -9.10
Breakoutsignal

ETHUSD – 1H Chart AnalysisETHUSD – 1H Chart Analysis
Educational purpose only
Current Price
ETHUSD ≈ 2,890
Market Structure
Price is in a short-term recovery phase after a sharp drop.
ETH is trading below the higher resistance zone, indicating cautious bullish attempts.
Price is moving inside a range between support and resistance, waiting for confirmation.
Resistance Zones
Immediate Resistance: 2,925 – 2,960
Major Resistance: 3,020 – 3,080
Bullish Scenario:
A strong 1H close above 2,960 may open upside toward 3,020 – 3,080.
Acceptance above this zone would strengthen bullish continuation.
Support Zones
Immediate Support: 2,875 – 2,885
Main Support: 2,830 – 2,850
Bearish Scenario:
If price breaks and closes below 2,875, downside pressure may extend toward 2,830 – 2,850.
Failure at main support may expose deeper downside.
Summary
Above resistance → bullish continuation.
Below support → bearish continuation.
Market remains range-bound until a clear breakout.
For educational purposes only.

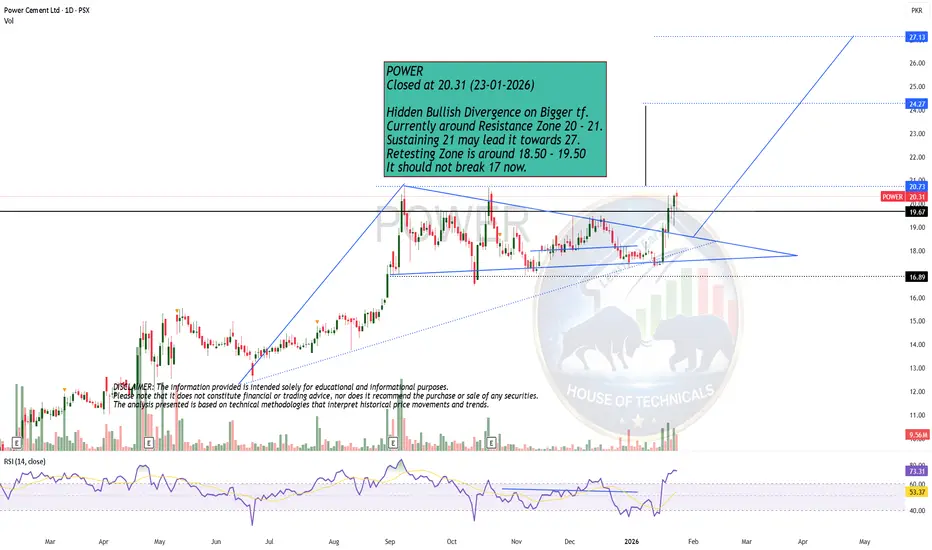
Hidden Bullish Divergence on Bigger tf.POWER
Closed at 20.31 (23-01-2026)
Hidden Bullish Divergence on Bigger tf.
Currently around Resistance Zone 20 - 21.
Sustaining 21 may lead it towards 27.
Retesting Zone is around 18.50 - 19.50
It should not break 17 now.
Beautiful Cup & Handle Formation.HALEON Analysis
Closed at 960.01 (22-01-2026)
Beautiful Cup & Handle Formation.
Re-testing of breakout level done.
However, it should not break 920 now.
Upside targets can be around 1100 & then 1200 - 1250

Japan 225 heading to 4kLong period of sideways movement now breaking out. DXY looking weak is also bullish. Breaking out despite decking consumer confidence also very bullish!

COLLECT - confirming a short-term trend reversal🐂 LONG – COLLECT
On the 15-minute timeframe, price has broken above the descending trendline, confirming a short-term trend reversal. RSI is holding in the bullish zone, while buying pressure is aligned across 5m, 15m, and 1h, signaling strong multi-timeframe momentum. This confluence supports a continuation move toward higher levels.
🎯 TP: 0.10673
🛡️ SL: 0.09259
📊 RR: 1 : 4.13
A high-quality long setup: trend break + RSI strength + multi-timeframe demand → favorable upside continuation with attractive RR.

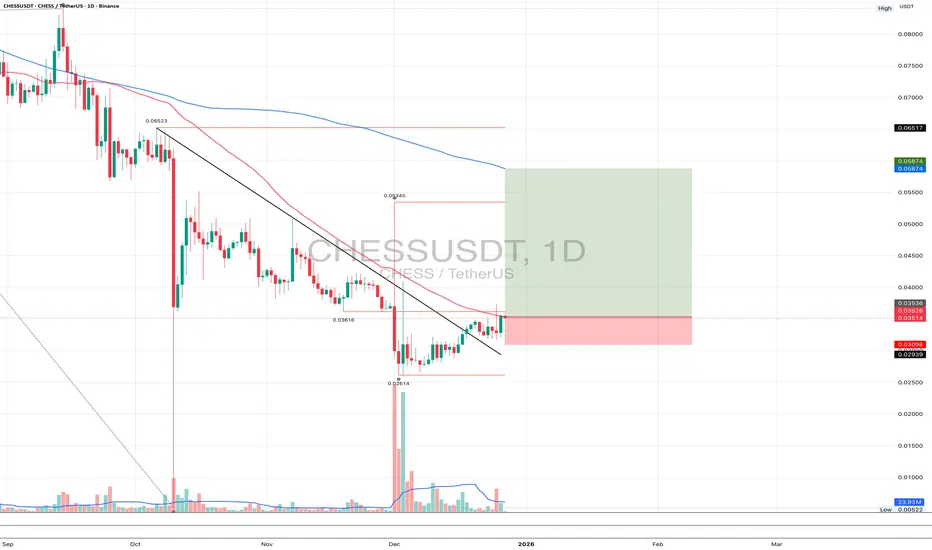
CHESSUSDT 1DShort technical update 👇
On the daily timeframe, CHESS broke its bearish structure and completed a clean retest of the breakout level. The retest held, selling pressure is fading, and higher local lows are forming. The current structure suggests a recovery phase after a prolonged decline. The base scenario is a continuation to the upside with a move toward the MA200 as the next key mid-term target.
Update: IREN Limited (IREN) - structure beats emotionsIREN Limited operates in Bitcoin mining and AI cloud infrastructure, focused on renewable energy and scalable data centers. Mining is the core revenue driver, AI services are still small but growing fast.
On the daily chart, a falling wedge has been broken to the upside, followed by a clean retest. The structure is holding. Price is now sitting in a strong daily support zone at 36–38, aligned with the 0.618 Fibonacci level.
MACD is turning bullish on higher timeframes, and short- to mid-term moving averages are stabilizing. This looks like accumulation after a deep correction, not a random bounce.
By the end of 2025, IREN scaled materially.
Revenue grew from $184M in 2024 to roughly $485M in 2025.
Bitcoin mining remains the main contributor, while AI Cloud Services added about $16M and continue expanding.
Consensus estimates point to ~$230M revenue in Q2 2026. EPS is still negative, which fits a capital-intensive expansion phase.
As long as price holds 36–38, the market is pricing a move toward 50 → 60 → 70.
This is not a one-day trade. It’s a structural recovery setup.
The chart already did the talking.

OVID Therapeutics (OVID) - Biotech with strong nervesOVID Therapeutics is a biotech company focused on developing treatments for rare neurological and genetic disorders.
On the monthly chart, OVID has broken above a long-term descending trendline and is currently retesting it from above. The key support zone sits at 1.45, while the latest close at 1.67 confirms structure preservation. Volume expanded on the breakout and faded during the pullback, indicating a healthy retest. Monthly MACD remains above zero and shows bullish divergence, while RSI holds above 50, confirming a shift in market phase. Volume profile suggests a potential magnet zone above current prices if support continues to hold.
Fundamentally, the company remains unprofitable, which is typical for a development-stage biotech. Q4 2025 EPS is expected at −0.11, revenues are minimal, but debt levels are manageable and cash reserves provide operational runway.
This is a higher-timeframe positioning idea, where the market begins to reassess the asset after a prolonged downtrend. Biotech is never comfortable, but this is how monthly reversals usually start.

Breaking Out - Getting Momentum!LOADS Analysis
Closed at 19.27 (09-01-2026)
Breaking Out - Getting Momentum!
Monthly closing above18.50 would be a +ve sign.
Immediate resistance lies around 20 - 21.
Crossing & Sustaining this range with Good Volumes
may lead it towards 25 & then 27.
Immediate Support lies around 18 - 18.55.

1 - 2 - 3 1 - 2 - 3 1 - 2 - " 3 incoming " Before BTC.D really detonates to the down side, and sparks these crazy Altcoin rallies, there are 2 smaller fire-crackers going off... poof... poof... then THE BIG KABOSH ! 🚀
If it doesn't happen, please, reserve a spot for me under the bridge. 😂

BIDU – Breakout Confirmed | Watching Wave 3Thesis
BIDU has completed a multi-year corrective phase and is now advancing within a developing Wave 3 structure following a confirmed breakout.
Context
- Weekly timeframe
- Prolonged correction since 2021
- Structural transition from downtrend → base → breakout
What I see
- Clean breakout confirmed at the end of December
- Prior support found on the 50-day moving average before expansion
- Successful acceptance above former resistance
- Price holding above long-term trend support
- Structure now showing impulsive characteristics
What matters now
- Wave 3 remains intact while price holds above post-breakout support
- After Wave 3 completes, attention shifts to a controlled Wave 4 pullback
- Confirmed support during Wave 4 would define the next add opportunity
Buy / Accumulation zone
- Initial breakout already played
- Next accumulation opportunity expected on confirmed Wave 4 support
Targets
- Primary upside reference at the 1.618 Fibonacci extension ($225 area)
- Higher extensions remain possible if momentum persists
Risk / Invalidation
- Loss of key breakout support would delay the bullish structure

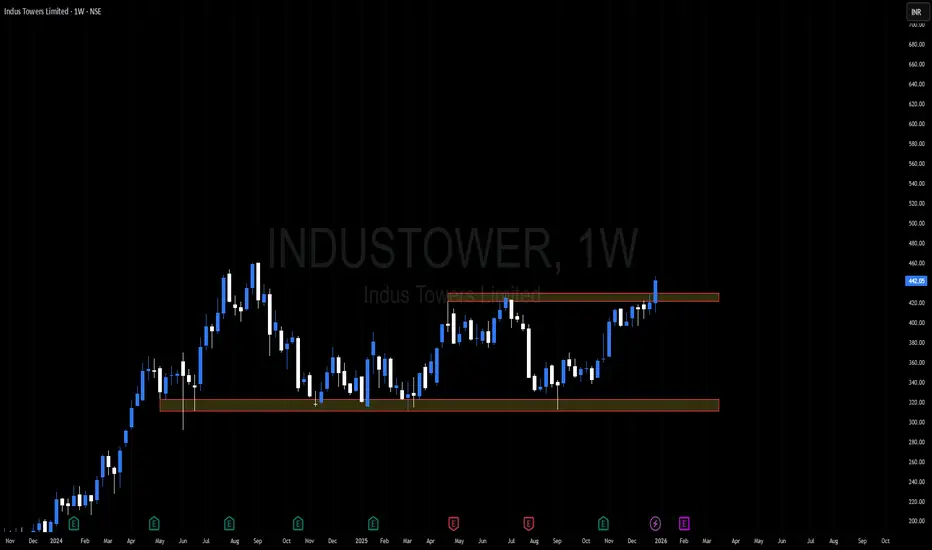
Amazing breakout on WEEKLY Timeframe - INDUSTOWERCheckout an amazing breakout happened in the stock in Weekly timeframe, macroscopically seen in Daily timeframe. Having a great favor that the stock might be bullish expecting a staggering returns of minimum 25% TGT. IMPORTANT BREAKOUT LEVELS ARE ALWAYS RESPECTED!
NOTE for learners: Place the breakout levels as per the chart shared and track it yourself to get amazed!! WAIT FOR A COMPLETE WEEKLY CANDLE TO CLOSE ABOVE THE LEVEL
#No complicated chart patterns
#No big big indicators
#No Excel sheet or number magics
TRADE IDEA: WAIT FOR THE STOCK TO BREAKOUT IN WEEKLY TIMEFRAME ABOVE THIS LEVEL.
Checkout an amazing breakout happened in the stock in Weekly timeframe.
Breakouts happening in longer timeframe is way more powerful than the breakouts seen in Daily timeframe. You can blindly invest once the weekly candle closes above the breakout line and stay invested forever. Also these stocks breakouts are lifelong predictions, it means technically these breakouts happen giving more returns in the longer runs. Hence, even when the scrip makes a loss of 10% / 20% / 30% / 50%, the stock will regain and turn around. Once they again enter the same breakout level, they will flyyyyyyyyyyyy like a ROCKET if held in the portfolio in the longer run.
Time makes money, GREEDY & EGO will not make money.
Also, magically these breakouts tend to prove that the companies turn around and fundamentally becoming strong. Also the magic happens when more diversification is done in various sectors under various scripts with equal money invested in each N500 scripts.
The real deal is when to purchase and where to purchase the stock. That is where Breakout study comes into play.
LET'S PUMP IN SOME MONEY AND REVOLUTIONIZE THE NATION'S ECONOMY!
Amazing breakout on WEEKLY Timeframe - AIAENGCheckout an amazing breakout happened in the stock in Weekly timeframe, macroscopically seen in Daily timeframe. Having a great favor that the stock might be bullish expecting a staggering returns of minimum 25% TGT. IMPORTANT BREAKOUT LEVELS ARE ALWAYS RESPECTED!
NOTE for learners: Place the breakout levels as per the chart shared and track it yourself to get amazed!! WAIT FOR A COMPLETE WEEKLY CANDLE TO CLOSE ABOVE THE LEVEL
#No complicated chart patterns
#No big big indicators
#No Excel sheet or number magics
TRADE IDEA: WAIT FOR THE STOCK TO BREAKOUT IN WEEKLY TIMEFRAME ABOVE THIS LEVEL.
Checkout an amazing breakout happened in the stock in Weekly timeframe.
Breakouts happening in longer timeframe is way more powerful than the breakouts seen in Daily timeframe. You can blindly invest once the weekly candle closes above the breakout line and stay invested forever. Also these stocks breakouts are lifelong predictions, it means technically these breakouts happen giving more returns in the longer runs. Hence, even when the scrip makes a loss of 10% / 20% / 30% / 50%, the stock will regain and turn around. Once they again enter the same breakout level, they will flyyyyyyyyyyyy like a ROCKET if held in the portfolio in the longer run.
Time makes money, GREEDY & EGO will not make money.
Also, magically these breakouts tend to prove that the companies turn around and fundamentally becoming strong. Also the magic happens when more diversification is done in various sectors under various scripts with equal money invested in each N500 scripts.
The real deal is when to purchase and where to purchase the stock. That is where Breakout study comes into play.
LET'S PUMP IN SOME MONEY AND REVOLUTIONIZE THE NATION'S ECONOMY!

Amazing breakout on WEEKLY Timeframe - BHELCheckout an amazing breakout happened in the stock in Weekly timeframe, macroscopically seen in Daily timeframe. Having a great favor that the stock might be bullish expecting a staggering returns of minimum 25% TGT. IMPORTANT BREAKOUT LEVELS ARE ALWAYS RESPECTED!
NOTE for learners: Place the breakout levels as per the chart shared and track it yourself to get amazed!! WAIT FOR A COMPLETE WEEKLY CANDLE TO CLOSE ABOVE THE LEVEL
#No complicated chart patterns
#No big big indicators
#No Excel sheet or number magics
TRADE IDEA: WAIT FOR THE STOCK TO BREAKOUT IN WEEKLY TIMEFRAME ABOVE THIS LEVEL.
Checkout an amazing breakout happened in the stock in Weekly timeframe.
Breakouts happening in longer timeframe is way more powerful than the breakouts seen in Daily timeframe. You can blindly invest once the weekly candle closes above the breakout line and stay invested forever. Also these stocks breakouts are lifelong predictions, it means technically these breakouts happen giving more returns in the longer runs. Hence, even when the scrip makes a loss of 10% / 20% / 30% / 50%, the stock will regain and turn around. Once they again enter the same breakout level, they will flyyyyyyyyyyyy like a ROCKET if held in the portfolio in the longer run.
Time makes money, GREEDY & EGO will not make money.
Also, magically these breakouts tend to prove that the companies turn around and fundamentally becoming strong. Also the magic happens when more diversification is done in various sectors under various scripts with equal money invested in each N500 scripts.
The real deal is when to purchase and where to purchase the stock. That is where Breakout study comes into play.
LET'S PUMP IN SOME MONEY AND REVOLUTIONIZE THE NATION'S ECONOMY!

Technical Analysis is All About Pattern RecognitionNYSE:RDDT : The Cup-and-Handle and VCP Breakout Setup
RDDT has established a clear "rhythm": after a two-month consolidation, it consistently reclaims the 20-day SMA (Red Line), followed by a volatility contraction phase where the price stops making new lows.
The stock just completed a Cup-and-Handle pattern, forming a 1 to 1.5-month Volatility Contraction Pattern (VCP) before breaking out, signaling that supply has been fully absorbed.
The recent +5.23% move on expanding volume successfully cleared the $240 psychological level, marking a fresh breakout from the consolidation high. This "breakout within a base" confirms that the trend is ready for its next leg higher.
Summary: By reclaiming the SMA 20 and breaking out of the tightest part of the pattern, RDDT is showing a high-probability continuation signal. As always, manage your risk and keep stops below the previous swing low.

Amazing breakout on WEEKLY Timeframe - COALINDIACheckout an amazing breakout happened in the stock in Weekly timeframe, macroscopically seen in Daily timeframe. Having a great favor that the stock might be bullish expecting a staggering returns of minimum 25% TGT. IMPORTANT BREAKOUT LEVELS ARE ALWAYS RESPECTED!
NOTE for learners: Place the breakout levels as per the chart shared and track it yourself to get amazed!! WAIT FOR A COMPLETE WEEKLY CANDLE TO CLOSE ABOVE THE LEVEL
#No complicated chart patterns
#No big big indicators
#No Excel sheet or number magics
TRADE IDEA: WAIT FOR THE STOCK TO BREAKOUT IN WEEKLY TIMEFRAME ABOVE THIS LEVEL.
Checkout an amazing breakout happened in the stock in Weekly timeframe.
Breakouts happening in longer timeframe is way more powerful than the breakouts seen in Daily timeframe. You can blindly invest once the weekly candle closes above the breakout line and stay invested forever. Also these stocks breakouts are lifelong predictions, it means technically these breakouts happen giving more returns in the longer runs. Hence, even when the scrip makes a loss of 10% / 20% / 30% / 50%, the stock will regain and turn around. Once they again enter the same breakout level, they will flyyyyyyyyyyyy like a ROCKET if held in the portfolio in the longer run.
Time makes money, GREEDY & EGO will not make money.
Also, magically these breakouts tend to prove that the companies turn around and fundamentally becoming strong. Also the magic happens when more diversification is done in various sectors under various scripts with equal money invested in each N500 scripts.
The real deal is when to purchase and where to purchase the stock. That is where Breakout study comes into play.
LET'S PUMP IN SOME MONEY AND REVOLUTIONIZE THE NATION'S ECONOMY!

Amazing breakout on WEEKLY Timeframe - IDBICheckout an amazing breakout happened in the stock in Weekly timeframe, macroscopically seen in Daily timeframe. Having a great favor that the stock might be bullish expecting a staggering returns of minimum 25% TGT. IMPORTANT BREAKOUT LEVELS ARE ALWAYS RESPECTED!
NOTE for learners: Place the breakout levels as per the chart shared and track it yourself to get amazed!! WAIT FOR A COMPLETE WEEKLY CANDLE TO CLOSE ABOVE THE LEVEL
#No complicated chart patterns
#No big big indicators
#No Excel sheet or number magics
TRADE IDEA: WAIT FOR THE STOCK TO BREAKOUT IN WEEKLY TIMEFRAME ABOVE THIS LEVEL.
Checkout an amazing breakout happened in the stock in Weekly timeframe.
Breakouts happening in longer timeframe is way more powerful than the breakouts seen in Daily timeframe. You can blindly invest once the weekly candle closes above the breakout line and stay invested forever. Also these stocks breakouts are lifelong predictions, it means technically these breakouts happen giving more returns in the longer runs. Hence, even when the scrip makes a loss of 10% / 20% / 30% / 50%, the stock will regain and turn around. Once they again enter the same breakout level, they will flyyyyyyyyyyyy like a ROCKET if held in the portfolio in the longer run.
Time makes money, GREEDY & EGO will not make money.
Also, magically these breakouts tend to prove that the companies turn around and fundamentally becoming strong. Also the magic happens when more diversification is done in various sectors under various scripts with equal money invested in each N500 scripts.
The real deal is when to purchase and where to purchase the stock. That is where Breakout study comes into play.
LET'S PUMP IN SOME MONEY AND REVOLUTIONIZE THE NATION'S ECONOMY!

Amazing breakout on WEEKLY Timeframe - GRAPHITECheckout an amazing breakout happened in the stock in Weekly timeframe, macroscopically seen in Daily timeframe. Having a great favor that the stock might be bullish expecting a staggering returns of minimum 25% TGT. IMPORTANT BREAKOUT LEVELS ARE ALWAYS RESPECTED!
NOTE for learners: Place the breakout levels as per the chart shared and track it yourself to get amazed!!
#No complicated chart patterns
#No big big indicators
#No Excel sheet or number magics
TRADE IDEA: WAIT FOR THE STOCK TO BREAKOUT IN WEEKLY TIMEFRAME ABOVE THIS LEVEL.
Checkout an amazing breakout happened in the stock in Weekly timeframe.
Breakouts happening in longer timeframe is way more powerful than the breakouts seen in Daily timeframe. You can blindly invest once the weekly candle closes above the breakout line and stay invested forever. Also these stocks breakouts are lifelong predictions, it means technically these breakouts happen giving more returns in the longer runs. Hence, even when the scrip makes a loss of 10% / 20% / 30% / 50%, the stock will regain and turn around. Once they again enter the same breakout level, they will flyyyyyyyyyyyy like a ROCKET if held in the portfolio in the longer run.
Time makes money, GREEDY & EGO will not make money.
Also, magically these breakouts tend to prove that the companies turn around and fundamentally becoming strong. Also the magic happens when more diversification is done in various sectors under various scripts with equal money invested in each N500 scripts.
The real deal is when to purchase and where to purchase the stock. That is where Breakout study comes into play.
LET'S PUMP IN SOME MONEY AND REVOLUTIONIZE THE NATION'S ECONOMY!

Amazing breakout on WEEKLY Timeframe - SANSERACheckout an amazing breakout happened in the stock in Weekly timeframe, macroscopically seen in Daily timeframe. Having a great favor that the stock might be bullish expecting a staggering returns of minimum 25% TGT. IMPORTANT BREAKOUT LEVELS ARE ALWAYS RESPECTED!
NOTE for learners: Place the breakout levels as per the chart shared and track it yourself to get amazed!! WAIT FOR A COMPLETE WEEKLY CANDLE TO CLOSE ABOVE THE LEVEL
#No complicated chart patterns
#No big big indicators
#No Excel sheet or number magics
TRADE IDEA: WAIT FOR THE STOCK TO BREAKOUT IN WEEKLY TIMEFRAME ABOVE THIS LEVEL.
Checkout an amazing breakout happened in the stock in Weekly timeframe.
Breakouts happening in longer timeframe is way more powerful than the breakouts seen in Daily timeframe. You can blindly invest once the weekly candle closes above the breakout line and stay invested forever. Also these stocks breakouts are lifelong predictions, it means technically these breakouts happen giving more returns in the longer runs. Hence, even when the scrip makes a loss of 10% / 20% / 30% / 50%, the stock will regain and turn around. Once they again enter the same breakout level, they will flyyyyyyyyyyyy like a ROCKET if held in the portfolio in the longer run.
Time makes money, GREEDY & EGO will not make money.
Also, magically these breakouts tend to prove that the companies turn around and fundamentally becoming strong. Also the magic happens when more diversification is done in various sectors under various scripts with equal money invested in each N500 scripts.
The real deal is when to purchase and where to purchase the stock. That is where Breakout study comes into play.
LET'S PUMP IN SOME MONEY AND REVOLUTIONIZE THE NATION'S ECONOMY!

Advanced Algorithmic Trendline Breakout Strategies● Advanced Algorithmic Trendline Breakout Strategies: A Comprehensive Analysis of Dynamic Support/Resistance and Geometric Target Projection
● Part I: The Theoretical Architecture of Market Geometry
• 1. Introduction to Algorithmic Price Action
The intersection of classical technical analysis and modern algorithmic trading has birthed a new class of indicators that bridge the gap between subjective chart interpretation and objective mathematical execution. At the core of this evolution is the automation of the trendline—a tool as old as the Dow Theory yet as relevant as high-frequency trading algorithms. This report provides an exhaustive, expert-level analysis of a specific methodology: the automated construction of trendlines based on user-defined pivot points, the identification of breakouts via closing price confirmation, and the projection of price targets using a vertical distance metric derived from the structure's final swing point.
This methodology is not an invention of the digital age but rather a quantification of principles established by the titans of technical analysis: Robert D. Edwards, John Magee, John Murphy, and Thomas Bulkowski. By synthesizing Edwards and Magee’s geometric rigidity, Murphy’s trend-following philosophy, and Bulkowski’s statistical rigor, we establish a robust framework for identifying high-probability structural shifts in financial markets.
• 2. The Lineage of The Path of Least Resistance
To understand the efficacy of an automated trendline strategy, one must first dissect the theoretical lineage that validates the trendline as a predictive tool. The concept of the trendline is rooted in the physical laws of inertia and momentum, applied to market psychology.
• 2.1 The Dow Theory Foundation
John Murphy, in Technical Analysis of the Financial Markets, posits that the trend is the foundational concept of all technical analysis. Murphy explains that market action discounts everything, meaning that the price chart is the ultimate arbiter of truth. The trendline serves as the visual representation of the primary trend defined by Charles Dow. In an uptrend, demand consistently exceeds supply at progressively higher price levels. The trendline connects the troughs of these demand waves. As long as the price remains above this line, the physical law of inertia suggests the trend will continue.
The automated methodology described utilizes this principle by identifying Pivot Lows (in an uptrend) or Pivot Highs (in a downtrend) to anchor the trendline. This mirrors Murphy’s instruction to draw lines under significant reaction lows. However, where Murphy relied on visual inspection, the algorithm relies on specific lookback parameters to define what constitutes a significant reaction, thereby standardizing the identification of the trend across all assets and timeframes.
• 2.2 Edwards and Magee: The Geometry of Conflict
While Dow and Murphy focused on the trend's direction, Edwards and Magee formalized the geometry of the trendline. In Technical Analysis of Stock Trends, they describe the trendline as a dynamic boundary of conflict between buyers and sellers. They introduced the crucial concept that a trendline is a line of dynamic support or resistance. Unlike a horizontal support level (e.g., $100), which represents a static price memory, a trendline represents a time-dependent price memory.
In a rising market, the value buyers place on an asset increases with time. A trendline sloping upward at a 45-degree angle indicates that the market demands a specific rate of price appreciation to maintain bullish sentiment. The automated indicator’s logic—extending a line infinitely to the right based on two points—is a direct application of this geometric theory. It creates a line in the sand that moves. If price fails to keep up with the slope of the line (i.e., breaks below it), it signals a deceleration of momentum that Edwards and Magee classify as a potential reversal signal.
• 2.3 Bulkowski’s Statistical Empiricism
Thomas Bulkowski revolutionized the field by testing these classical theories against vast datasets. His Encyclopedia of Chart Patterns moves beyond the anecdotal evidence of Edwards and Magee to provide statistical probabilities. Bulkowski’s work is essential to the Target Projection component of this methodology. He established that patterns like wedges, triangles, and flags have predictable failure rates and measure rules.
The methodology’s reliance on the vertical distance for target calculation is a generalized application of Bulkowski’s findings on Measured Moves. Bulkowski observed that the volatility inherent in the pattern (represented by its height) is often replicated in the breakout move. By automating this measurement, the indicator moves from a discretionary guesstimate to a statistically grounded projection.
• 3. The Geometry of Trendline Construction
The automated generation of trendlines requires precise definitions of points and lines that can be executed by code. This section explores the mathematical mechanics used by the indicator and their theoretical implications.
• 3.1 Pivot Point Identification Logic
The script constructs the trendline by connecting two distinct points in time. These are not arbitrary points but Pivots or Swing Points.
Definition: A Pivot High is a candle that has a higher high than the N candles preceding it and the N candles following it. A Pivot Low is the inverse.
User Input: The snippet references Start Date and End Date inputs. This implies a semi-automated approach where the trader identifies the region of interest, and the algorithm snaps the trendline to the exact mathematical extremes (High or Low) within those timestamps.
This Hybrid approach solves a major issue in algorithmic trading: context. A fully automated script might draw trendlines across every minor fluctuation. By allowing user input for the anchor points, the tool leverages human pattern recognition (identifying the Forest) while using algorithmic precision for the execution (identifying the Trees and calculating the exact slope).
• 3.2 The Slope and Infinite Extension
Once the two pivots (P1 at t1, P2 at t2) are locked, the algorithm calculates the linear equation of the trendline:
y = mx + c
Where:
m (slope) = (Price2 - Price1) / (Time2 - Time1)
x is the current time index.
c is the y-intercept.
The crucial feature described in the research is the infinite extension to the right. This extension transforms the historical line into a future-predictive tool. It allows the trader to see where the price must be at a future time tn to maintain the trend.
Wedge Construction: In a wedge pattern, two trendlines converge. The automated extension allows the user to define the upper resistance line independently of the lower support line. As time progresses, the gap between price and this extended line narrows, decreasing volatility and increasing the probability of a violent breakout—a phenomenon described by Bulkowski as coiling.
• 3.3 Logarithmic vs. Arithmetic Scaling
A nuance often overlooked but critical in Edwards and Magee’s work is the scale of the chart. They heavily favored semi-logarithmic charts for long-term trend analysis because a straight line on a log chart represents a constant percentage rate of change.
Algorithmic Implication: While most simple scripts use arithmetic calculations (Price2 - Price1), advanced implementations of this methodology (as hinted at in market geometry references) may need to account for log-scale slopes, especially for long-term targets. However, for the vertical distance calculation method described (measuring price difference at a specific bar), the arithmetic difference is the standard convention in modern coding (Pine Script/Python).
• 4. Dynamic Support and Resistance Mechanics
The trendline created is not just a visual aid; it is a functional barrier.
Bullish Trendline: Connects Pivot Lows. Acts as dynamic Support.
Bearish Trendline: Connects Pivot Highs. Acts as dynamic Resistance.
The dynamic nature implies that the support level rises with every new candle (in an uptrend). This puts constant pressure on the bears. If they cannot push price down fast enough, the rising support line will eventually intersect with the current price, forcing a decision. This interaction is the Trigger Event for the strategy.
● Part II: The Mechanics of the Breakout
• 5. Defining the Breakout Event
In classical analysis, a breakout is subjective. Edwards and Magee speak of decisive penetrations. The automated methodology rigorously defines this using boolean logic.
• 5.1 The Close vs. Wick Debate
The research material explicitly states that a breakout is identified based on closing prices.
The Trap of Wicks: Intraday price action often pierces trendlines due to temporary liquidity sweeps or stop-hunting algorithms. These are false breakouts. A wick above a resistance line shows that buyers pushed price there, but sellers were strong enough to push it back down before the close.
The Commitment of the Close: A closing price beyond the trendline indicates that the market sentiment has fundamentally shifted. Buyers (in a bullish breakout) were willing to hold the asset at a higher valuation through the end of the session.
Murphy’s Rule: John Murphy emphasizes that a closing price filter (e.g., requiring a 3% penetration or a two-day close) significantly reduces whipsaws. The automated script simplifies this to a single bar close logic:
Signal = Close > TrendlineValue
This binary condition (True/False) allows the script to print a BC (Breakout Candle) label instantly, providing the trader with an actionable signal that removes hesitation.
• 5.2 Volume Confirmation
Snippet 16 and 17 highlight the necessity of volume. A breakout on low volume is suspect. The Edwards and Magee standard requires an increase in volume on upside breakouts.
Algorithmic Integration: While the primary trigger is price, the most robust versions of this indicator likely include a volume condition (e.g., Volume > SMA(Volume, 20)). This aligns with Bulkowski’s finding that breakouts with above-average volume are less likely to experience a failure or a deep throwback.
• 5.3 The Throwback and Pullback Phenomenon
Bulkowski’s statistics are vital here. He notes that after a breakout, price returns to the trendline (Throwback) in approximately 40-60% of cases, depending on the pattern.
Methodology Handling: The automated target logic (discussed in Part III) is static once the breakout occurs. This is crucial because if a throwback occurs, the trendline value has changed (it has moved higher/lower). By locking in the targets at the moment of the breakout candle, the algorithm provides a fixed reference point for the trader to manage risk during the chaotic throwback phase.
• 6. Breakout Filters and False Signals
To further refine the signal, the methodology references concepts like Change of Character (CHOCH) and Liquidity Sweeps.
• 6.1 Change of Character (CHOCH)
Snippet 19 and 11 mention an optional CHOCH module. This concept, popular in Smart Money Concepts (SMC), looks for the breach of a prior swing high/low in addition to the trendline break.
Confluence: If a bearish trendline is broken (price goes up), AND the price also breaks above the most recent significant Pivot High (CHOCH), the probability of a sustained reversal increases. This aligns with Dow Theory’s requirement for a pattern of higher highs to confirm a new uptrend.
• 6.2 The Busted Pattern Strategy
Bulkowski identifies a specific scenario called a Busted Pattern: when a breakout occurs, moves less than 10%, and then reverses to break the other side of the pattern. These often result in powerful moves in the reverse direction. While the core indicator focuses on the initial breakout, understanding this failure mode is essential for risk management (Stop Loss placement).
● Part III: The Vertical Distance Target Projection Model
• 7. Theoretical Derivation of the Target
The most distinctive feature of this methodology is its target calculation: Projecting the vertical distance between the breakout line and the last pivot. This differs from the standard Pattern Height rule in subtle but significant ways.
• 7.1 The Measure Rule vs. Last Pivot Logic
Classic Measure Rule (Triangles/Wedges): Edwards and Magee typically measure the widest part of the triangle (the base) and project that from the breakout.
Automated Method: Measures the distance at the Last Pivot before the breakout.
Why the distinction?
In a converging pattern like a wedge or triangle, volatility is compressing. The widest part represents volatility from weeks or months ago. The Last Pivot represents the current volatility state immediately preceding the breakout.
Volatility Compression: As the price coils into the apex, the energy available for the initial thrust is often proportional to the most recent swing. Using the Last Pivot provides a more conservative and highly probable target (Target 1) compared to the widest part, which might be an overestimation in a low-volatility environment.
• 7.2 Mathematical Formula for Target Calculation
Let t_break be the time of the breakout candle.
Let P_break be the closing price of the breakout candle (or the trendline value).
Let P_pivot be the price of the most recent significant swing point (High or Low) at time t_pivot.
Let L(t) be the value of the trendline at time t.
Step 1: Calculate Vertical Distance (D)
The distance is measured strictly vertically at the time index of the pivot.
D = | P_pivot - L(t_pivot) |
Crucially, this uses the trendline value at the historical pivot time, not the current time.
Step 2: Project Targets (T)
The distance D is projected from the Trendline value at the breakout point (or the breakout price itself, depending on specific script implementation).
Target 1 (1.0x): T1 = P_break +/- (D x 1.0)
Target 2 (1.618x): T2 = P_break +/- (D x 1.618)
Target 3 (2.618x): T3 = P_break +/- (D x 2.618)
• 7.3 Fibonacci Harmonics
The use of 1.618 (Golden Ratio) and 2.618 multipliers aligns the strategy with harmonic trading theory. Bulkowski often references Fibonacci extensions as secondary targets when the primary measure rule is exceeded.
Target 1 represents the Measured Move (Symmetry).
Target 2 represents the Extension (Momentum run).
Target 3 represents the Exhaustion (Statistical outlier).
• 8. Comparative Analysis of Target Methods
The following table contrasts the Vertical Distance at Last Pivot method with other classical targeting methods referenced in the literature.
Method: Widest Base
Source: Edwards & Magee
Measurement Basis: Widest part of pattern (start of trendlines).
Projection Point: Breakout Point
Pros: Captures full potential of the structure.
Cons: Can be overly ambitious for late breakouts; ignores volatility compression.
Method: Flagpole
Source: Murphy
Measurement Basis: Entire preceding trend leg (Flagpole).
Projection Point: Breakout Point
Pros: Best for Bull Flags/Pennants.
Cons: Often overestimates targets for Reversal patterns (like wedges).
Method: Last Pivot (Vertical)
Source: Automated Method
Measurement Basis: Distance from Trendline to Last Swing.
Projection Point: Breakout Point
Pros: Adjusts for recent volatility; higher probability T1.
Cons: May underestimate the move in explosive breakouts (requires T2/T3).
Method: Percent Decline
Source: Bulkowski
Measurement Basis: Percentage drop/rise of prior trend.
Projection Point: Breakout Price
Pros: Statistically robust across large datasets.
Cons: Harder to automate visually on a chart compared to geometric lines.
• 9. Intraday vs. Swing Targets
The methodology applies to both intraday and swing trading.
Intraday: The Last Pivot method is superior because intraday volatility changes rapidly (e.g., opening range vs. lunch hour). Measuring the most recent swing captures the immediate liquidity conditions better than a pivot from 4 hours ago.
Swing/Daily: On daily charts, the Widest Base method of Edwards and Magee often aligns with the Last Pivot method if the pattern is a Rectangle or Channel (where width is constant). It only diverges significantly in Triangles.
● Part IV: Pattern-Specific Applications and Analysis
The automated trendline tool is pattern-agnostic—it simply sees a line and a pivot. However, the trader applies it to specific structures. This section analyzes how the tool performs on the specific patterns mentioned in the research.
• 10. The Wedge (Rising and Falling)
Wedges are defined by converging trendlines with a distinct slope against the prevailing trend.
Falling Wedge (Bullish): Resistance line slopes down; Support line slopes down (steeper).
Automated Setup: User draws the Resistance Trendline connecting lower highs.
Target Logic: The Last Pivot is the most recent Lower Low.
Bulkowski Stat: Falling wedges break upward 69% of the time.
Nuance: Because wedges converge, the Last Pivot distance is naturally smaller than the Base. This makes the automated Target 1 very achievable. Snippet 16 shows a specific example of a Wedge in Tata Motors where the target was exactly hit using the High minus Low difference, validating the math.
• 11. The Bump and Run Reversal (BARR)
This is a proprietary pattern identified by Thomas Bulkowski. It consists of three phases:
Lead-in: A steady trend (30-45 degrees).
Bump: A rapid acceleration (speculative excess) moving price far away from the trendline.
Run: The reversal after the trendline break.
Applying the Automated Tool to BARR:
Construction: The user draws the trendline along the Lead-in phase pivots.
The Vertical Distance Check: Bulkowski validates the pattern by measuring the vertical distance of the Bump height. It must be at least 2x the height of the Lead-in height.
Target: The automated tool is perfect for this. The Last Pivot corresponds to the Bump High.
D = Height of Bump.
Target = Breakout Price - D.
This implies a full retracement of the speculative bump, which is exactly Bulkowski’s target for this pattern.
• 12. Triangles (Symmetrical, Ascending, Descending)
Symmetrical Triangle: Indecision. Breakout can be either way.
The 50-75% Rule: Snippet 17 emphasizes that breakouts are most reliable when they occur 50-75% of the way to the apex.
Automated Filter: If the user sets the trendline, the visual proximity of the Last Pivot to the breakout point tells the story.
If D is tiny, the breakout is near the apex (late). Targets will be small.
If D is large, the breakout is early (potentially premature).
The Sweet Spot generates a moderate D and a high-probability Target 1.
• 13. Flags and Pennants
These are continuation patterns.
Edwards & Magee: The Flag flies at half-mast. The move after the flag equals the move before (Flagpole).
Automated Adaptation: The tool measures the flag's width.
Target 1 (1x Width): A scalper's target inside the trend.
Target 3 (2.618x Width): Often approximates the full Flagpole height.
Insight: This highlights the utility of the multi-target system. T1 ensures money is banked if the trend fails; T3 captures the classical Measured Move of the Flagpole.
● Part V: Statistical Validation, Risk Management, and Coding
• 14. Statistical Reliability (The Bulkowski Data)
No technical analysis report is complete without addressing failure rates. Bulkowski’s data provides the reality check for the geometric projections.
• 14.1 Pattern Success Rates (2025 Data)
The research snippets provide updated statistics for 2025:
Head and Shoulders: 89% accuracy (when confirmed).
Double Bottoms: 88% success in bull markets.
Symmetrical Triangles: 76% success in direction of trend.
Bull Flags: 91.5% success rate (highest reliability).
These high success rates validate the Breakout signal. However, success is often defined as a 5% move, not necessarily hitting the full target. This is why the Target 1 (1:1) rule of the automated indicator is so effective—it aims for a statistically probable move rather than a home run.
• 14.2 The Busted Opportunity
If a pattern fails (e.g., a Bull Flag breaks up, hits T1, then collapses), it becomes a Busted Pattern. Bulkowski found that busted patterns have higher average gains than standard patterns because the trapped traders provide fuel for the reversal.
Strategy: If price reverses and closes back below the trendline after triggering a breakout, the automated system’s signal is invalidated. Advanced traders reverse their position immediately, targeting the opposite side pivot.
• 15. Risk Management: Stop Loss Placement
Where does the stop loss go?
Method A (Conservative): Below the Last Pivot used for the calculation.
Logic: If price breaks the trendline but then takes out the pivot that created the setup, the structure is broken (Dow Theory violation).
Risk/Reward: Since Target 1 is calculated using distance D (Trendline to Pivot), placing the stop at the Pivot means the Risk is D.
Result: A perfect 1:1 Risk/Reward Ratio for Target 1.
Method B (Aggressive): Just below the trendline or the breakout candle.
Logic: Minimizes risk.
Danger: High susceptibility to Throwbacks (40-60% probability).
The report recommends Method A for swing trading (to survive the throwback) and Method B only for high-momentum scalping.
• 16. Algorithmic Implementation Challenges
Translating this theory into code (e.g., Pine Script) involves specific challenges.
• 16.1 Repainting
The script must leverage confirmed pivots. If the script uses a pivothigh function with rightbars=5, the pivot is only confirmed 5 bars after it happens.
Solution: The trendline is drawn retrospectively, but the breakout is real-time. The script must ensure that the Last Pivot index is stable before the breakout candle closes.
• 16.2 Parameter Sensitivity
The lookback period for pivot detection determines the scale of the trendline.
Short Lookback (e.g., 5 bars): Catches micro-trends. Targets are small. High noise.
Long Lookback (e.g., 20 bars): Catches major structural trends. Targets are large. Fewer signals.
Recommendation: Users should align the lookback with the timeframe (e.g., 5 on Daily chart, 20 on 1-minute chart) to capture relevant liquidity sweeps.
• 17. Conclusion: The Synthesis of Old and New
The automated trendline breakout strategy is a testament to the enduring validity of classical technical analysis. By automating the insights of Edwards and Magee (dynamic support/resistance), adhering to the filters of John Murphy (closing price confirmation, volume), and applying the statistical rigor of Thomas Bulkowski (measured move targets, failure rates), the methodology transforms subjective art into objective science.
The Vertical Distance to Last Pivot calculation stands out as a robust, volatility-adaptive metric that provides realistic profit objectives. Whether applied to a Bulkowski Bump and Run or a classic Murphy Flag, the logic holds: Energy accumulated during the compression (Pivot Distance) is released during the expansion (Target).
For the modern trader, this tool does not replace analysis; it standardizes it. It ensures that every breakout traded adheres to the same geometric rules, allowing for consistent risk management and performance tracking—the ultimate goal of any professional trading system.
● Appendix: Data Tables and Reference Summaries
• Table 1: Comparative Breakout Statistics (Source: Bulkowski & 2025 Data)
Pattern Type: Head & Shoulders | Breakout Direction: Down | Success Rate: 89% | Avg. Throwback Rate: ~45-50% | Target Reliability (T1): High
Pattern Type: Bull Flag | Breakout Direction: Up | Success Rate: 91.5% | Avg. Throwback Rate: Low | Target Reliability (T1): Very High
Pattern Type: Sym. Triangle | Breakout Direction: Trend Continuation | Success Rate: 76% | Avg. Throwback Rate: Moderate | Target Reliability (T1): Moderate (depends on apex proximity)
Pattern Type: Falling Wedge | Breakout Direction: Up | Success Rate: 69% | Avg. Throwback Rate: Low | Target Reliability (T1): High
Pattern Type: Bump & Run | Breakout Direction: Reversal | Success Rate: Variable | Avg. Throwback Rate: Low (Violent Move) | Target Reliability (T1): Very High (for T1)
• Table 2: Target Projection Multipliers
Target Level: T1 | Multiplier of Distance (D): 1.0 | Theoretical Basis: Geometric Symmetry / Measured Move | Usage Case: Primary Take Profit (Conservative)
Target Level: T2 | Multiplier of Distance (D): 1.618 | Theoretical Basis: Golden Ratio Extension | Usage Case: Strong Trends / Runners
Target Level: T3 | Multiplier of Distance (D): 2.618 | Theoretical Basis: Deep Harmonic Extension | Usage Case: Climactic / Blow-off Tops
• Table 3: Filter Logic Summary
Filter Name: Close Filter | Condition: Close > Trendline | Source Justification: Edwards & Magee / Murphy (Avoid wicks/noise)
Filter Name: Volume Filter | Condition: Vol > AvgVol | Source Justification: Murphy / Bulkowski (Confirm institutional participation)
Filter Name: Pivot Filter | Condition: Pivot > Previous Pivot | Source Justification: Dow Theory (Trend definition)
Filter Name: Time Filter | Condition: 50-75% to Apex | Source Justification: Bulkowski (Avoid dead zones in triangles)

Amazing breakout on WEEKLY Timeframe - HEGCheckout an amazing breakout happened in the stock in Weekly timeframe, macroscopically seen in Daily timeframe. Having a great favor that the stock might be bullish expecting a staggering returns of minimum 25% TGT. IMPORTANT BREAKOUT LEVELS ARE ALWAYS RESPECTED!
NOTE for learners: Place the breakout levels as per the chart shared and track it yourself to get amazed!!
#No complicated chart patterns
#No big big indicators
#No Excel sheet or number magics
TRADE IDEA: WAIT FOR THE STOCK TO BREAKOUT IN WEEKLY TIMEFRAME ABOVE THIS LEVEL.
Checkout an amazing breakout happened in the stock in Weekly timeframe.
Breakouts happening in longer timeframe is way more powerful than the breakouts seen in Daily timeframe. You can blindly invest once the weekly candle closes above the breakout line and stay invested forever. Also these stocks breakouts are lifelong predictions, it means technically these breakouts happen giving more returns in the longer runs. Hence, even when the scrip makes a loss of 10% / 20% / 30% / 50%, the stock will regain and turn around. Once they again enter the same breakout level, they will flyyyyyyyyyyyy like a ROCKET if held in the portfolio in the longer run.
Time makes money, GREEDY & EGO will not make money.
Also, magically these breakouts tend to prove that the companies turn around and fundamentally becoming strong. Also the magic happens when more diversification is done in various sectors under various scripts with equal money invested in each N500 scripts.
The real deal is when to purchase and where to purchase the stock. That is where Breakout study comes into play.
LET'S PUMP IN SOME MONEY AND REVOLUTIONIZE THE NATION'S ECONOMY!

Graphite: Major Pattern Formation | Breakout or Still BuildingGraphite India – Daily Timeframe Technical View
This is the daily timeframe chart of Graphite India.
The stock has formed a Right-Angled Ascending Broadening Formation, with a strong support zone near 500–520. The broadening structure appears to have completed a five-wave formation, while the key resistance zone is placed near 690–700.
A decisive breakout above the resistance zone, preferably with volume confirmation, could trigger a strong upside move. Based on Fibonacci projections, the final pattern target is placed near 940.
As long as the stock continues to hold above its key support zones, the ongoing rally is likely to continue, keeping the broader trend positive.
Thank you.
