LOADS | Trade OpportunityCurrent Rate: 13.10
Ideal Range: 13
Risk Level (SL): 12.50
🔻 Risk: -3.85%
Expected Targets:
13.62 → 📈 +4.77%
14.25 → 📈 +9.62%
14.87 → 📈 +14.38%
15.50 → 📈 +19.23%
Time Frame: Long Term
Note: LOADS is trading near an attractive accumulation zone with a favorable risk-reward setup. Buy at CMP while
Loads Ltd.
No trades
No trades
Compare with Loads Ltd.
1.29 PKR
416.48 M PKR
7.58 B PKR
160.03 M
Company info
Sector
Industry
CEO
Muhammad Mohtashim Aftab
Website
Headquarters
Karachi
Founded
1979
IPO date
Nov 1, 2016
ISIN
PK0098001016
FIGI
BBG00DX0N776
Identifiers
ISIN PK0098001016
Loads Ltd. engages in the manufacture and sale of radiators, exhaust systems, and other components for the automotive industry. Its products include mufflers and exhaust systems, radiators, sheet metal components, and radiator and heater cores. The company was founded on January 1, 1979 and is headquartered in Karachi, Pakistan.
Trade Idea: LOADS Daily Outlook — Waiting Below (july 2026)**Trade Idea: LOADS Daily Outlook — Waiting Below Monthly Low**
**Symbol:** Loads Ltd. — PSX
**Timeframe:** Daily
**Chart Date:** July 04, 2026
Loads Ltd. has shown a strong recovery from the April low and price is now moving upward with a clear bullish reaction. The market has already created a d
LOADS (PSX) Trade SetupBullish above 13.91.
As long as the stock holds the 14.50 breakout zone, dips can be used for accumulation. The next major test is 15.24; a successful breakout there could open the path toward 16.50 and 18.00 over the coming weeks. Volume should remain elevated for confirmation.
Breaking Out - Getting Momentum!LOADS Analysis
Closed at 19.27 (09-01-2026)
Breaking Out - Getting Momentum!
Monthly closing above18.50 would be a +ve sign.
Immediate resistance lies around 20 - 21.
Crossing & Sustaining this range with Good Volumes
may lead it towards 25 & then 27.
Immediate Support lies around 18 - 18.55.
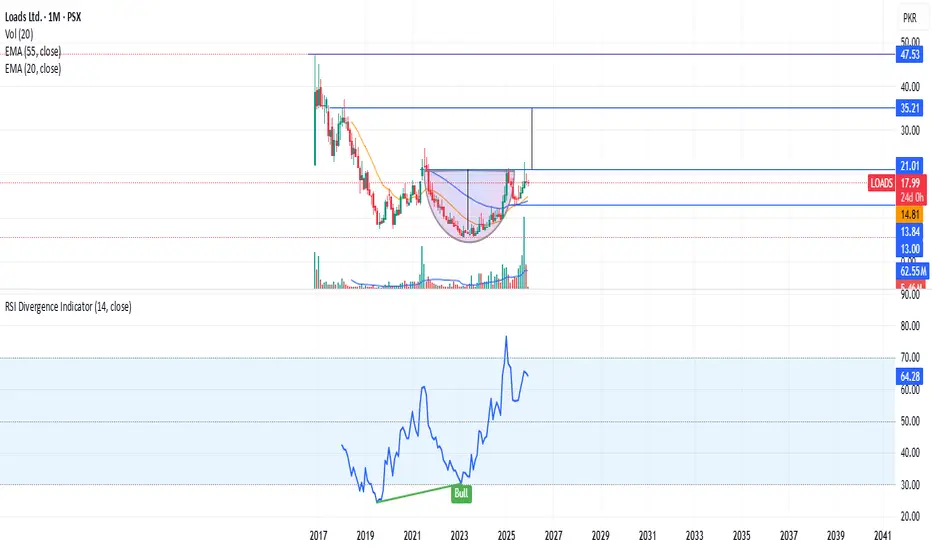
LOADS (PSX) – Monthly Breakout Setup + Auto Sector Seasonality LOADS is completing a multi-year rounded bottom and preparing for a major structural breakout above 21.00 on the monthly chart. Volume is the highest since 2019, price is above both 20 & 55 EMAs, and RSI has entered a bullish regime above 60 — all confirming a long-term trend shift.
🚗 Pakistan Auto
LOADS – BUY TRADE | 1H | 22 OCT 2025 | TCA LOADS LOADS – BUY TRADE | 1H | 22 OCT 2025 | TCA
LOADS – TECH BUY CALL | 1H | 22 OCT 2025 | By The Chart Alchemist
The stock LOADS has been trending within a bullish channel and has recently broken out of its reaccumulation zone, signaling renewed upward momentum and potential continuation toward higher
See all ideas
Summarizing what the indicators are suggesting.
Oscillators
Neutral
Oscillators
Neutral
Summary
Neutral
Summary
Neutral
Summary
Neutral
Moving Averages
Neutral
Moving Averages
Neutral
Displays a symbol's price movements over previous years to identify recurring trends.
Frequently asked questions
The current price of LOADS is 11.76 PKR — it has decreased by −2.89% in the past 24 hours. Watch Loads Ltd. stock price performance more closely on the chart.
Depending on the exchange, the stock ticker may vary. For instance, on PSX exchange Loads Ltd. stocks are traded under the ticker LOADS.
LOADS stock has fallen by −5.32% compared to the previous week, the month change is a −8.99% fall, over the last year Loads Ltd. has showed a −35.91% decrease.
LOADS reached its all-time high on Nov 24, 2016 with the price of 48.64 PKR, and its all-time low was 5.64 PKR and was reached on Mar 3, 2023. View more price dynamics on LOADS chart.
See other stocks reaching their highest and lowest prices.
LOADS stock is 1.71% volatile and has beta coefficient of 1.03. Track Loads Ltd. stock price on the chart and check out the list of the most volatile stocks — is Loads Ltd. there?
Today Loads Ltd. has the market capitalization of 4.49 B, it has decreased by −0.63% over the last week.
Yes, you can track Loads Ltd. financials in yearly and quarterly reports right on TradingView.
LOADS net income for the last quarter is 157.16 M PKR, while the quarter before that showed 84.13 M PKR of net income which accounts for 0.00% change. Track more Loads Ltd. financial stats to get the full picture.
No, LOADS doesn't pay any dividends to its shareholders. But don't worry, we've prepared a list of high-dividend stocks for you.
As of Oct 6, 2026, the company has 738 employees. See our rating of the largest employees — is Loads Ltd. on this list?
EBITDA measures a company's operating performance, its growth signifies an improvement in the efficiency of a company. Loads Ltd. EBITDA is 1.30 B PKR, and current EBITDA margin is 16.04%. See more stats in Loads Ltd. financial statements.
Like other stocks, LOADS shares are traded on stock exchanges, e.g. Nasdaq, Nyse, Euronext, and the easiest way to buy them is through an online stock broker. To do this, you need to open an account and follow a broker's procedures, then start trading. You can trade Loads Ltd. stock right from TradingView charts — choose your broker and connect to your account.
Investing in stocks requires a comprehensive research: you should carefully study all the available data, e.g. company's financials, related news, and its technical analysis. So Loads Ltd. technincal analysis shows the sell today, and its 1 week rating is strong sell. Since market conditions are prone to changes, it's worth looking a bit further into the future — according to the 1 month rating Loads Ltd. stock shows the sell signal. See more of Loads Ltd. technicals for a more comprehensive analysis.