will SOFI be the HOOD of 2026?SOFI breaking out to all time highs.
Blue sky above.
Will NASDAQ:SOFI repeat what NASDAQ:HOOD did in 2025?
Both of them are in the top 10 momentum stocks of 2025.
Breakouttrading

CESC on the Verge of Upside Momentum – Buy SuggestedCESC Breakout Update (4H Chart)
The stock has given a breakout on the 4-hour timeframe.
The short-term polarity zone, earlier acting as resistance, is now expected to act as support around 158–160 levels.
If the stock sustains above this zone, we may see further upside momentum.
Potential Targets: 170 / 180

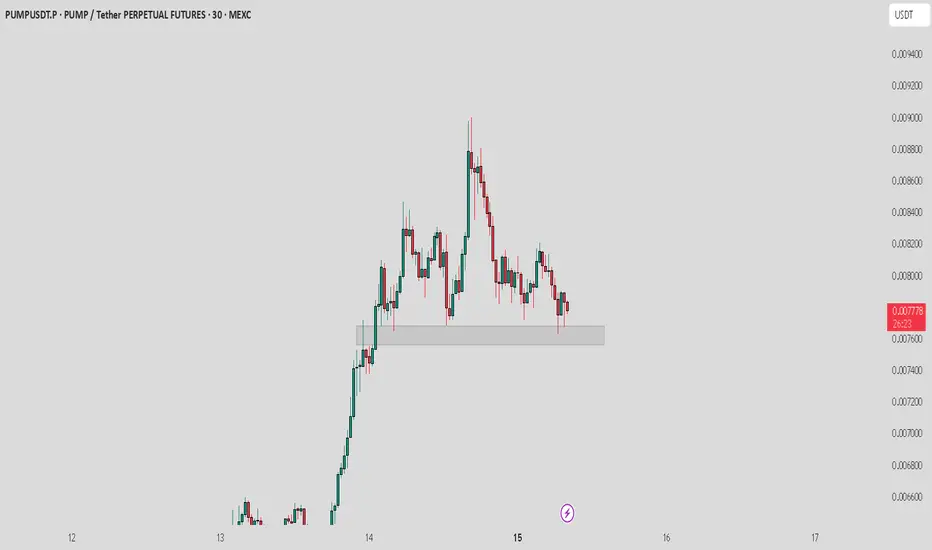
PUMP / USDT : Trading at major support zonePrice is consolidating at a key support zone. Holding this level could trigger a relief bounce, while a breakdown may open room for deeper downside. This zone will decide the next move.
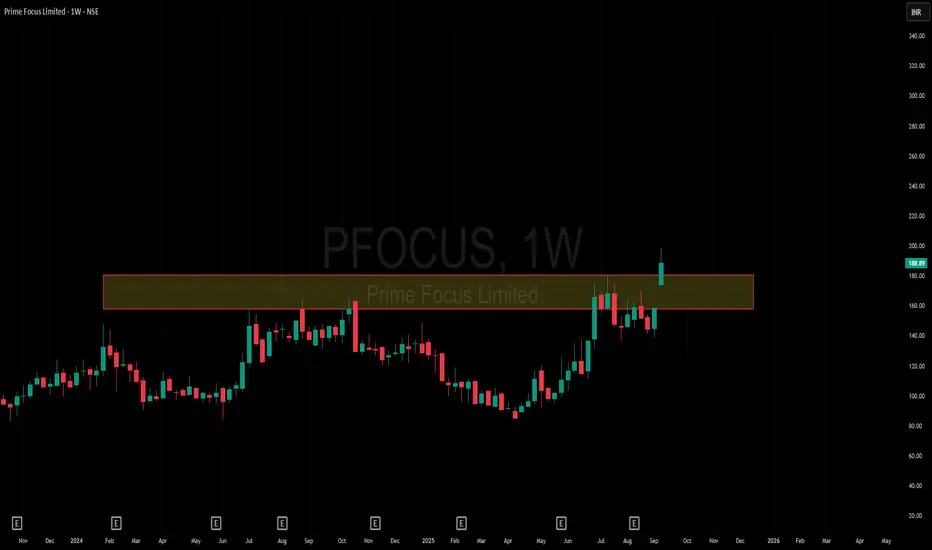
Amazing breakout on WEEKLY Timeframe - PFOCUSCheckout an amazing breakout happened in the stock in Weekly timeframe, macroscopically seen in Daily timeframe. Having a great favor that the stock might be bullish expecting a staggering returns of minimum 25% TGT. IMPORTANT BREAKOUT LEVELS ARE ALWAYS RESPECTED!
NOTE for learners: Place the breakout levels as per the chart shared and track it yourself to get amazed!!
#No complicated chart patterns
#No big big indicators
#No Excel sheet or number magics
TRADE IDEA: WAIT FOR THE STOCK TO BREAKOUT IN WEEKLY TIMEFRAME ABOVE THIS LEVEL.
Checkout an amazing breakout happened in the stock in Weekly timeframe.
Breakouts happening in longer timeframe is way more powerful than the breakouts seen in Daily timeframe. You can blindly invest once the weekly candle closes above the breakout line and stay invested forever. Also these stocks breakouts are lifelong predictions, it means technically these breakouts happen giving more returns in the longer runs. Hence, even when the scrip makes a loss of 10% / 20% / 30% / 50%, the stock will regain and turn around. Once they again enter the same breakout level, they will flyyyyyyyyyyyy like a ROCKET if held in the portfolio in the longer run.
Time makes money, GREEDY & EGO will not make money.
Also, magically these breakouts tend to prove that the companies turn around and fundamentally becoming strong. Also the magic happens when more diversification is done in various sectors under various scripts with equal money invested in each N500 scripts.
The real deal is when to purchase and where to purchase the stock. That is where Breakout study comes into play.
LET'S PUMP IN SOME MONEY AND REVOLUTIONIZE THE NATION'S ECONOMY!
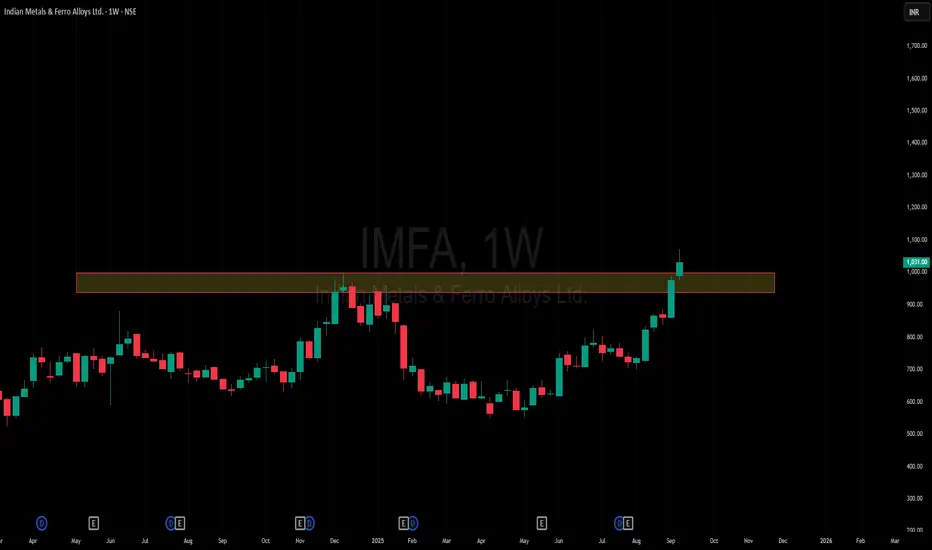
Amazing breakout on WEEKLY Timeframe - IMFACheckout an amazing breakout happened in the stock in Weekly timeframe, macroscopically seen in Daily timeframe. Having a great favor that the stock might be bullish expecting a staggering returns of minimum 25% TGT. IMPORTANT BREAKOUT LEVELS ARE ALWAYS RESPECTED!
NOTE for learners: Place the breakout levels as per the chart shared and track it yourself to get amazed!!
#No complicated chart patterns
#No big big indicators
#No Excel sheet or number magics
TRADE IDEA: WAIT FOR THE STOCK TO BREAKOUT IN WEEKLY TIMEFRAME ABOVE THIS LEVEL.
Checkout an amazing breakout happened in the stock in Weekly timeframe.
Breakouts happening in longer timeframe is way more powerful than the breakouts seen in Daily timeframe. You can blindly invest once the weekly candle closes above the breakout line and stay invested forever. Also these stocks breakouts are lifelong predictions, it means technically these breakouts happen giving more returns in the longer runs. Hence, even when the scrip makes a loss of 10% / 20% / 30% / 50%, the stock will regain and turn around. Once they again enter the same breakout level, they will flyyyyyyyyyyyy like a ROCKET if held in the portfolio in the longer run.
Time makes money, GREEDY & EGO will not make money.
Also, magically these breakouts tend to prove that the companies turn around and fundamentally becoming strong. Also the magic happens when more diversification is done in various sectors under various scripts with equal money invested in each N500 scripts.
The real deal is when to purchase and where to purchase the stock. That is where Breakout study comes into play.
LET'S PUMP IN SOME MONEY AND REVOLUTIONIZE THE NATION'S ECONOMY!
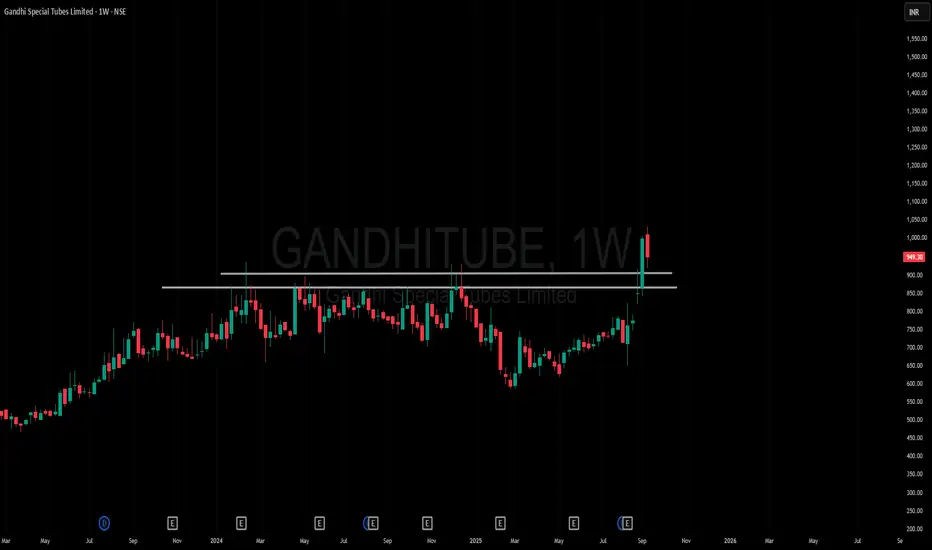
Amazing breakout on WEEKLY Timeframe - GANDHITUBECheckout an amazing breakout happened in the stock in Weekly timeframe, macroscopically seen in Daily timeframe. Having a great favor that the stock might be bullish expecting a staggering returns of minimum 25% TGT. IMPORTANT BREAKOUT LEVELS ARE ALWAYS RESPECTED!
NOTE for learners: Place the breakout levels as per the chart shared and track it yourself to get amazed!!
#No complicated chart patterns
#No big big indicators
#No Excel sheet or number magics
TRADE IDEA: WAIT FOR THE STOCK TO BREAKOUT IN WEEKLY TIMEFRAME ABOVE THIS LEVEL.
Checkout an amazing breakout happened in the stock in Weekly timeframe.
Breakouts happening in longer timeframe is way more powerful than the breakouts seen in Daily timeframe. You can blindly invest once the weekly candle closes above the breakout line and stay invested forever. Also these stocks breakouts are lifelong predictions, it means technically these breakouts happen giving more returns in the longer runs. Hence, even when the scrip makes a loss of 10% / 20% / 30% / 50%, the stock will regain and turn around. Once they again enter the same breakout level, they will flyyyyyyyyyyyy like a ROCKET if held in the portfolio in the longer run.
Time makes money, GREEDY & EGO will not make money.
Also, magically these breakouts tend to prove that the companies turn around and fundamentally becoming strong. Also the magic happens when more diversification is done in various sectors under various scripts with equal money invested in each N500 scripts.
The real deal is when to purchase and where to purchase the stock. That is where Breakout study comes into play.
LET'S PUMP IN SOME MONEY AND REVOLUTIONIZE THE NATION'S ECONOMY!
Amazing breakout on WEEKLY Timeframe - GPILCheckout an amazing breakout happened in the stock in Weekly timeframe, macroscopically seen in Daily timeframe. Having a great favor that the stock might be bullish expecting a staggering returns of minimum 25% TGT. IMPORTANT BREAKOUT LEVELS ARE ALWAYS RESPECTED!
NOTE for learners: Place the breakout levels as per the chart shared and track it yourself to get amazed!!
#No complicated chart patterns
#No big big indicators
#No Excel sheet or number magics
TRADE IDEA: WAIT FOR THE STOCK TO BREAKOUT IN WEEKLY TIMEFRAME ABOVE THIS LEVEL.
Checkout an amazing breakout happened in the stock in Weekly timeframe.
Breakouts happening in longer timeframe is way more powerful than the breakouts seen in Daily timeframe. You can blindly invest once the weekly candle closes above the breakout line and stay invested forever. Also these stocks breakouts are lifelong predictions, it means technically these breakouts happen giving more returns in the longer runs. Hence, even when the scrip makes a loss of 10% / 20% / 30% / 50%, the stock will regain and turn around. Once they again enter the same breakout level, they will flyyyyyyyyyyyy like a ROCKET if held in the portfolio in the longer run.
Time makes money, GREEDY & EGO will not make money.
Also, magically these breakouts tend to prove that the companies turn around and fundamentally becoming strong. Also the magic happens when more diversification is done in various sectors under various scripts with equal money invested in each N500 scripts.
The real deal is when to purchase and where to purchase the stock. That is where Breakout study comes into play.
LET'S PUMP IN SOME MONEY AND REVOLUTIONIZE THE NATION'S ECONOMY!

Amazing breakout on WEEKLY Timeframe - ACMESOLARCheckout an amazing breakout happened in the stock in Weekly timeframe, macroscopically seen in Daily timeframe. Having a great favor that the stock might be bullish expecting a staggering returns of minimum 25% TGT. IMPORTANT BREAKOUT LEVELS ARE ALWAYS RESPECTED!
NOTE for learners: Place the breakout levels as per the chart shared and track it yourself to get amazed!!
#No complicated chart patterns
#No big big indicators
#No Excel sheet or number magics
TRADE IDEA: WAIT FOR THE STOCK TO BREAKOUT IN WEEKLY TIMEFRAME ABOVE THIS LEVEL.
Checkout an amazing breakout happened in the stock in Weekly timeframe.
Breakouts happening in longer timeframe is way more powerful than the breakouts seen in Daily timeframe. You can blindly invest once the weekly candle closes above the breakout line and stay invested forever. Also these stocks breakouts are lifelong predictions, it means technically these breakouts happen giving more returns in the longer runs. Hence, even when the scrip makes a loss of 10% / 20% / 30% / 50%, the stock will regain and turn around. Once they again enter the same breakout level, they will flyyyyyyyyyyyy like a ROCKET if held in the portfolio in the longer run.
Time makes money, GREEDY & EGO will not make money.
Also, magically these breakouts tend to prove that the companies turn around and fundamentally becoming strong. Also the magic happens when more diversification is done in various sectors under various scripts with equal money invested in each N500 scripts.
The real deal is when to purchase and where to purchase the stock. That is where Breakout study comes into play.
LET'S PUMP IN SOME MONEY AND REVOLUTIONIZE THE NATION'S ECONOMY!

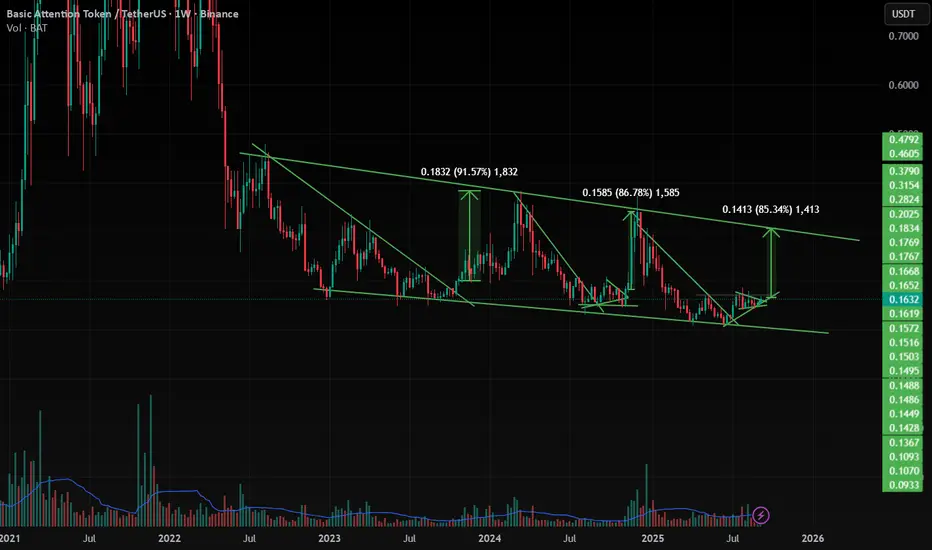
BAT/USDT , 1W BAT has moving same as previous moves , so it will give nearly 85 % UP move very strong if it breaks the upper trendline in Weekly and strong candle close .
Main important points are
1. BTC Dominance is falling Daily
2. ETH Dominance is increasing
3. Altcoins Dominance is Increasing
Means Volume is moving from BTC too Altcoins Slowly , soo Altcoins season is coming soo , look on Breakouts in altcoins , they will perform vey well .
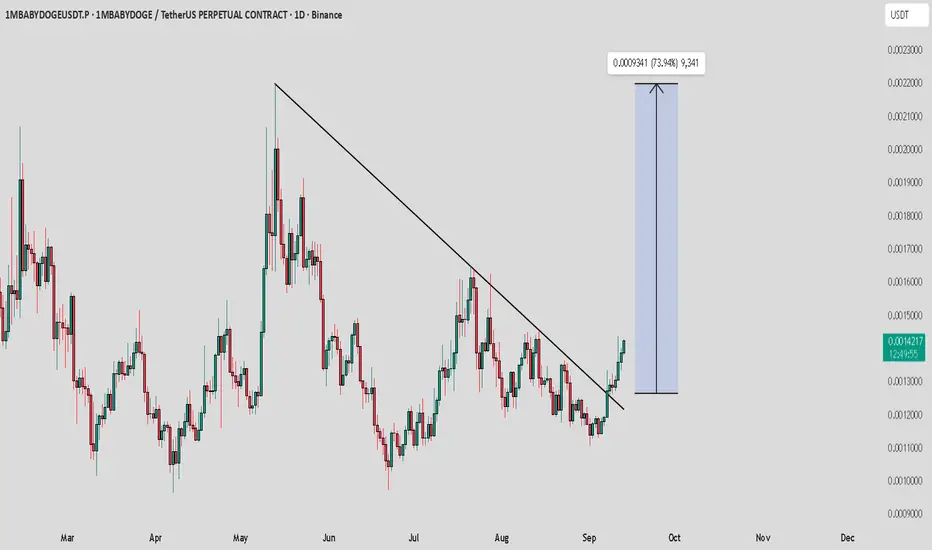
1MBABYDOGE / USDT : Showing strong momentum after breakout1MBABYDOGE/USDT is showing strong momentum after breaking out of trendline resistance. Already up +13%, but the structure still looks bullish.
Next targets: $0.0020 – $0.0025 if momentum continues.
Always manage risk and avoid chasing without confirmation.
BTC / USDT : Falling wedge breakout confirmedBitcoin (Update)
BTC has confirmed a breakout from the falling wedge pattern. After some consolidation, we anticipate a strong bullish move toward the $124,000 zone.
Keep it on your radar — breakout confirmation is in place, momentum could build quickly. Always manage risk in volatile conditions.

SEI / USDT : Looking so good for strong bullish rallySEI/USDT is showing strong momentum and is once again breaking out of trendline resistance. If this breakout sustains, we can expect a short-term rally toward $0.40 – $0.45.
Spot Update: SEI is also looking very attractive for spot buyers — a good accumulation opportunity.
Midterm Target for SEI: $0.80 – $1 🚀

ROSE / USDT : Bullish rally ahead after successful retestROSE/USDT has broken out of trendline resistance and is now heading for a retest of the breakout zone. If this retest holds successfully, price could rally toward $0.045.
📌 Always wait for clear confirmation of a bullish move before entering. Manage risk wisely.

Bitcoin trend reversal done ? It is quite evident from the previous plan that we have faced trend reversal for bitcoin. We had a classic breakout followd by retest , consolidation and pumps. Bitcoin had been dumping for a while now and it we were expecting something like this in the near time .
Bitcoin is currently targeting 117k2 followed by 119k4 and 123k resistance for now.
A candle close below 115k will invalidate the bullish bias.
We have also shared a lot of altcoins trade along with the Btc view on our app.
Dont forget to check out ........

GCTK - GlucoTrack, Inc - $15.87NASDAQ:GCTK broke out to $14.49 after announcing that Sixth Borough Capital commits to $20M Purchase of CO's Common Stock. Based on current projections and if we find support around the $12.87, we could see GCTK retest the $15.87 Price Levels. If we don't get support arround that $12.87 Price Level, this could also consolidate back to the $8.30's for a better/secondary opportunity for entry.

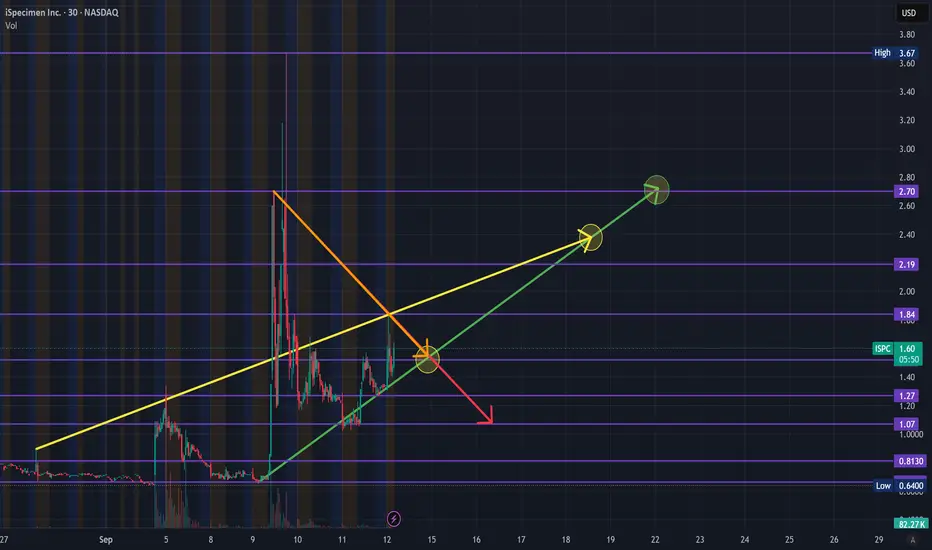
$ISPC - iSpecmen - $2.71 PTNASDAQ:ISPC broke out to $3.67 after announcing it advanced its $200 Million Solana-Based Digital Asset Strategy which it has since consolidated from and is starting to show confirmation of Descending Wedge to retest he $1.84 and $2.19 Resistance which we expect $1.84 Support and Bounce at best.
PROK - ProKidney Corp - $4.87We've been keeping an eye on PROK since July an glad to see it showing signs of another potential breakout trade. Currently at $3.21 going into the Pre-Market but we're looking for a potential $2.50-$2.60 entry if she consolidates from this move before pushing forward. Our Price is that $4.23 - $4.87 while she continues to trade in this lower descending wedge before finding the right compression to break and bounce out.
The company hit a $7.13 High in July ($13.77 in August '23) and we expect to se it gradually work to retest that going into 2026. But for now, going into October, we're looking at that $2.50 to $4.87 Trade for a 90-100% Swing. This comes after the company should achieve funding into 2Q 2027 based on Cash, Cash Equivalents and Marketable Securities.

$INHD - Inno Holdings - $10.23 PTNASDAQ:INHD hit our $15.71 Price Target in our previous trade, and has since consolidated back to the $5.50's where we're seeing another potential entry after finding support on that lower level of support we've been elevating from so far since Aug. 22, 2025 or so. Whether it's a hard breakout once we surpass that angled resistance down to the $6.60's where we believe we will see a Continuation Bounce/Break back to retest the $10.23's and tap that higher level of resistance that sits between $10.23-$10.94 Price Range.
The consolidation comes after the company announced a 7.2 Million Direct Offering. #MyMIWallet

PENGU/USDT : Bouncing back and now breaking Trendline resistancePENGU/USDT bounced strongly from horizontal support and is now breaking out of trendline resistance with solid momentum. If this breakout holds, the next target is $0.045.
Always wait for confirmation before entering. Momentum looks promising, but risk management is key.

#XAUUSD in Consolidation After consolidating for months gold gave a bullish breakout. After a huge rally, before reaching its final target #XAUUSD #Gold taking a break now, before moving up further.
Currently it has formed a Bullish pennant formation.
Anyway being a technical trader, can get into entry after breakout confirmation.

RCAT - Red Cat Holdings - $12.81 PTNASDAQ:RCAT has been consolidating from it's $12.81 since reaching that price level back in July '25. It's been having issues breaking above the $10.12 Price Level of Resistance, but if it does and finds support, we could see this running back to retest the $12.81.
This comes after Red Cat Drones are added to the NATO Catalog. With the recent upticks in concerns in the Middle East, as well as Europe, that could be a catalyst to continue pushing RCAT further up.

BTC Breaks out ! Classic breakout .
Let's see if we this breakout holds up or not.
We will watch this one closely....
