USDCAD-07/03/2023Preferred direction: SELL
Comment: Despite the fact on Friday the downward impulse after breaking out the lower border of the balance did not take place, the priority of sell remains. However, the action plan has been slightly changed. The most potential sell should be considered at the upper border of the current balance, most likely in the format of a false breakout. An alternative scenario, also sell, can be considered at the lower border of the same balance, that is, in the format of a breakdown of the level of 1.32399. The target is still the same at the level of 1.31385.
Thank you for like and share your views!
Brent

Brent to stall at trend of lower highs?Brent - 24h expiry
Daily signals are bearish.
Trend line resistance is located at 76.60.
50 1day EMA is at 76.35.
We look for a temporary move higher.
Preferred trade is to sell into rallies.
We look to Sell at 76.39 (stop at 77.39)
Our profit targets will be 73.89 and 73.39
Resistance: 75.90 / 76.40 / 77.34
Support: 75.20 / 74.80 / 74.40
Risk Disclaimer
The trade ideas beyond this page are for informational purposes only and do not constitute investment advice or a solicitation to trade. This information is provided by Signal Centre, a third-party unaffiliated with OANDA, and is intended for general circulation only. OANDA does not guarantee the accuracy of this information and assumes no responsibilities for the information provided by the third party. The information does not take into account the specific investment objectives, financial situation, or particular needs of any particular person. You should take into account your specific investment objectives, financial situation, and particular needs before making a commitment to trade, including seeking advice from an independent financial adviser regarding the suitability of the investment, under a separate engagement, as you deem fit.
You accept that you assume all risks in independently viewing the contents and selecting a chosen strategy.
Where the research is distributed in Singapore to a person who is not an Accredited Investor, Expert Investor or an Institutional Investor, Oanda Asia Pacific Pte Ltd (“OAP“) accepts legal responsibility for the contents of the report to such persons only to the extent required by law. Singapore customers should contact OAP at 6579 8289 for matters arising from, or in connection with, the information/research distributed.

#Oil UpdateThe price have completed the previous correction with ending diagonal marked as wave of ii and now is tracing impulse waves on 15 min timeframe.

UKOIL (BRENT)-06/29/2023Preferred direction: BUY
Comment: Oil has been trading in the range of 72.36 - 77.39. The most pleasant entry points are certainly located at the extremes, however, the current price attracts those formed by accumulation. Accumulated selling can well push the price up to the level of 76.30.
Thank you for like and share your views!

Will Brent find buyers at crucial support once again?Brent - 24h expiry
A level of 72 continues to hold back the bears.
Daily momentum has stalled and our bias is now neutral.
Expect trading to remain mixed and volatile.
We look to buy dips.
The hourly chart technicals suggest further downside before the uptrend returns.
We look to Buy at 72.13 (stop at 71.13)
Our profit targets will be 74.63 and 75.13
Resistance: 73.30 / 74.00 / 75.00
Support: 72.40 / 72.00 / 71.62
Risk Disclaimer
The trade ideas beyond this page are for informational purposes only and do not constitute investment advice or a solicitation to trade. This information is provided by Signal Centre, a third-party unaffiliated with OANDA, and is intended for general circulation only. OANDA does not guarantee the accuracy of this information and assumes no responsibilities for the information provided by the third party. The information does not take into account the specific investment objectives, financial situation, or particular needs of any particular person. You should take into account your specific investment objectives, financial situation, and particular needs before making a commitment to trade, including seeking advice from an independent financial adviser regarding the suitability of the investment, under a separate engagement, as you deem fit.
You accept that you assume all risks in independently viewing the contents and selecting a chosen strategy.
Where the research is distributed in Singapore to a person who is not an Accredited Investor, Expert Investor or an Institutional Investor, Oanda Asia Pacific Pte Ltd (“OAP“) accepts legal responsibility for the contents of the report to such persons only to the extent required by law. Singapore customers should contact OAP at 6579 8289 for matters arising from, or in connection with, the information/research distributed.

ukoil 1 hour chart distribution tp 65 usd / bbl🔸Today let's review the 1 hour chart for brent oil . Previously strong downtrend in
progress entire 2023 so outlook remains bearish until we can daily close above 80 usd.
🔸OPEC production cuts have low impact on prices recently due to lower global
demand. Technically, we are in a distribution pattern setup since May 2023 and expecting
breakdown and new/fresh lows soon for Brent.
🔸Recommended strategy for crude oil traders: short-sell near market / short-sell rips
and rallies, limited upside and final TP bears is 65 USD. once we get a valid breakdown
of the structure expecting losses to accelerate in this market.
🎁Please hit the like button and
🎁Leave a comment to support our team!
RISK DISCLAIMER:
Trading Futures , Forex, CFDs and Stocks involves a risk of loss.
Please consider carefully if such trading is appropriate for you.
Past performance is not indicative of future results.
Always limit your leverage and use tight stop loss.

WTI REMAINS STABLEOil prices remained stable on Monday amid volatile trading as investors weighed global demand concerns against political instability in Russia, which could worsen supply disruptions. Brent crude futures rose slightly to $73.88 a barrel, while U.S. WTI futures fell to $69.08 a barrel. The withdrawal of Russian mercenaries in averted clash raised questions about President Putin's grip on power and potential oil supply disruption. Russian turmoil presents a risk to supply shortages, coupled with Saudi Arabia's output cut, declining U.S. production, and the end of U.S. strategic reserve releases. Last week, both Brent and WTI prices dropped by 3.6% on worries of higher U.S. interest rates and China's underwhelming economic recovery.
Both RSI and MACD remain indecisive regarding the future movement of the instrument. As a support level can be considered prices of 69.61 and 69.25 further down the line. As a pivot point may be considered the price of 69.83, from where the instrument might try to reach a target of 70.18
Risk Disclosure: Trading Foreign Exchange (Forex) and Contracts of Difference (CFD's) carries a high level of risk. By registering and signing up, any client affirms their understanding of their own personal accountability for all transactions performed within their account and recognizes the risks associated with trading on such markets and on such sites. Furthermore, one understands that the company carries zero influence over transactions, markets, and trading signals, therefore, cannot be held liable nor guarantee any profits or losses.

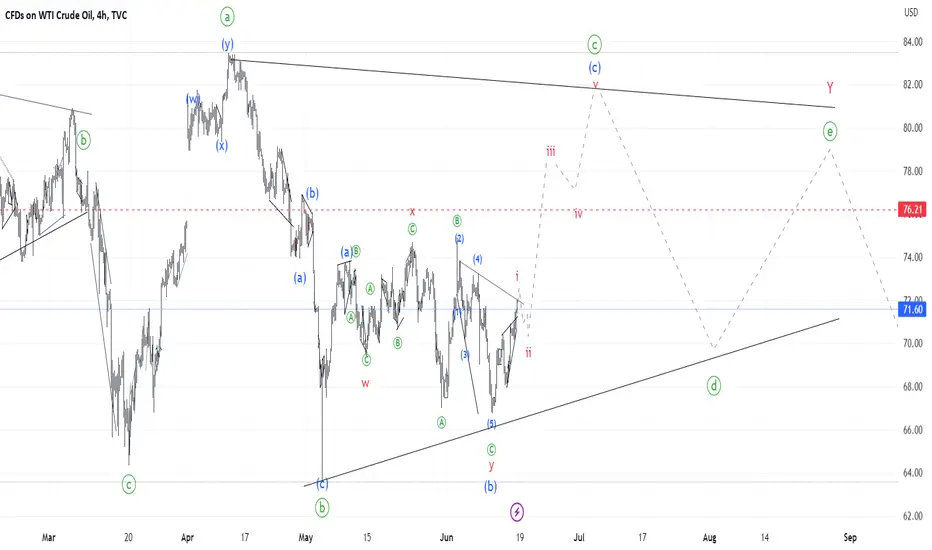
#WTI Update #OOTT #USOIL #Brent I continue to expect a sharp, short-lived rally in the near term, despite the recent drops in oil prices making me feel uncertain.
The weakest point of my charts is - waves wxy of (b) and [w ] [x ] [y ] of ii are too complex. Nevertheless, it is my best scenario for now.
If the price exceeds $83.4 or wave high I provide a couple of alternatives in my Weekly Newsletter.
I see no bearish scenarios that allow keeping the previous labelling (which I have comfort with). Therefore, I will refrain from further chart manipulation. I will consider immediate bearish scenarios only if price breaks lower and I have to stop loss my trades.

Update #OIL #WTI #OOTTI do not have a good explanation of what has happened in crude and have to fall back to the previously outlined expanding diagonal scenario. This is weak, however, because it is supposed to be rare.
If it proves to be the case the price will take off with acceleration and the move up will be a 3 wave move like illustrated.

Update on #USOIL #WTI #OOTT I suspect that wave ii (red label) is not finished and we may be seeing a triangle in the making to finish it off (black labels).


UKOIL(BRENT)-06/19/2023Preferred direction: BUY
Comment: Closing the price above the local resistance 76.30 creates a potential movement for buyers towards 77.39. This will be another major buying hurdle as it is medium term resistance. Given the context of the price movement towards this resistance, there is a very high probability of a breakout to the upside. Perhaps this will not be the biggest upward impulse, however, the approach to the round value of 80 will most likely be provided.
Thank you for like and share your views!

Crude Oil (WTI): Key Levels to Trade 🛢️
Here is my latest structure analysis for WTI Crude Oil.
Resistance 1: 74.19 - 75.00 area
Resistance 2: 76.60 - 77.00 area
Support 1: 66.84 - 67.30 area
Support 2: 63.58 - 64.00 area
Consider these structures for pullback/breakout trading this week.
❤️Please, support my work with like, thank you!❤️

USOIL UpdateThe move in oil is just starting, and I expect the price to wobble early next week before surging to the $80+ zone.
The larger picture provides for the short-lived surge and the price ranging until the end of summer-early September.
All this comes from a bigger picture of unfinished correction that started in March 2022. Such an outlook broadly coincides with my view of the stock market, which I expect to decline in a similar timeline. See my earlier posts on S&P500.
#OIL #OOTT UpdateI think I just decoded the oil chart. I have been contemplating a rise to $90+ because I expected ABC flat where I now see WXY combination of zigzag, zigzag and triangle. The chart now perfectly aligns with Brent where wave [ B] did make lowest low presumably shaping a symmetrical triangle whereas WTI is working on a running triangle.
That means that we have only strong push left upwards from current low which should come either as a straight impulse or an expanding diagonal which will be extremely annoying.

#OIL #OOTT UpdateI probably sound desperate as I keep drawing lines into the sky. However, I am still convinced that we are in a first correction of a bull move that will run until the end of summer or something. The count has got simple and more aggressive now without stops until 80+. Ok, now you can call me a dreamer.

#Gasoil UpdateSimilar to WTI, I expect gasoil prices to take off almost immediately and through the roof.

Brent Oil - D1 / Buy or Sell ?Which way will you choose?
Buy? Or sell?
Tell me your opinion in the comment section below.

#Gasoil Update Gasoil Elliott Wave story is less controversial than Crude Oil story . The price rests on Moving Averages support and Gasoil crack appears to be on an upward trend too. This suggests that refinery margins are likely to improve.
In practice, this means that Gasoil prices are likely to grow faster than Oil prices, perhaps due to unsatisfied demand for diesel fuel.
What I also dislike a bit here is that wave (ii) seems a bit too complicated, being a combination of flat w, simple zigzag x and another simple zigzag y. I was taught that although possible such combinations are rare and shall be used only labeling in retrospective when no other alternatives fit. Now it is part of the ongoing trade and if I am proven wrong I will have to stricten my rules about this combination.

#Oil #OOTT UpdateWow oil has been very tough lately. Many times I jumped the gun with long calls. I am actually bearish into the end of 2023. The reason I am so stubborn to pick the local bottom is that my charts just do not make sense without this last big jump to 90-100 range that I expect any time soon.
The chart is a complete meat grinder. The price is actually trading under moving averages on many timeframes and sending me bearish technical signals. There are bearish candles and engulfings all over the chart. It is only the Elliott Wave count that keeps me bullish since I cannot see an alternative that could continue the downtrend.
However, I am running out of bullish counts as well. The leading diagonal is very risky bet without having it fully formed. However, besides Elliott Wave count there are emerging signs in support of bullish case. See the falling trendline that the price broke through and now retesting from above in a good bye kiss? Gasoil chart looks more pointed upwards trading above moving averages. And gasoil crack has made a bottom and is recovering (will post as an update to this chart).

#USOIL #OOTT UpdateI had to delete the previous chart as the price quickly knocked out my previous idea )). Nevertherless, I think wave [ x] just finished (A)(B)(C) flat and the price is ready for rallying again.

USOIL UpdateAll right, seems like the oil is tightly following the scenario with a leading diagonal. So far, I see no alternative options at this moment other than wave can complicated further and make another dip. Once low is in the trendline 0- shall not be violated by (B) low in the next (A)(B)(C) zigzag.

Brent Oil Critical ResistanceWhen we apply FRVP analysis to the Brent oil chart, I think HKEX:86 is a critical resistance on the daily timeframe. I can say that brent oil, which has failed to break this level by testing it many times, will test this level again.
