Is Brent Crude Setting Up for a Deeper Pullback?🔥 BRUTAL BRENT (UKOIL) SELL BLUEPRINT — Day & Swing Trade Guide! 🔥
Asset: BRENT “UKOIL” — Energies Market Trade Opportunity Guide (Day / Swing Trade)
Bias: Bearish Plan 📉
📍 Trade Setup Overview
The market is showing a clear downside narrative as liquidity continues shifting away from buyer strength. Volatility pockets + premium zones are forming the ideal backdrop for a controlled bearish play.
🎯 Entry
ANY PRICE LEVEL ENTRY
This setup focuses on structure, not perfection. Price exploration zones offer multiple opportunities to position short as long as the bearish narrative remains intact.
🛡️ Stop Loss
This is the Thief SL @ 62.500
Dear Ladies & Gentleman (Thief OG’s), adjust your SL based on your own system, risk comfort, and volatility tolerance.
Note: I am not recommending that you set only my SL — your capital, your control, your rules. Manage risk like a professional.
💰 Target
We have strong support, oversold confluence, and visible trap behaviour forming below, so the smart exit is clean and disciplined.
Target @ 59.500
Note: Dear Ladies & Gentleman (Thief OG’s), I am not recommending that you use only my TP. Make money, take money — at your own execution style & risk preference.
🔗 Related Pairs to Watch (Correlation Guide)
1️⃣ WTI Crude Oil — USOIL / CL
Moves closely with Brent (UKOIL).
If WTI weakens, Brent often mirrors the same bearish energy.
Watch for supply-zone rejections & macro oil inventory pressure.
2️⃣ Natural Gas — NGAS / XNGUSD
Energy sector sentiment often overlaps.
When overall energy demand weakens, oil tends to follow with downside momentum.
Good for gauging sentiment shifts.
3️⃣ CAD Pairs — USDCAD, CADJPY
Canada is an oil-exporting economy.
If oil falls, CAD weakens, making USDCAD push upward.
A great indirect correlation filter for confidence.
4️⃣ DXY — US Dollar Index TVC:DXY
A rising dollar = pressure on commodities.
Strong USD typically accelerates bearish moves on Brent.
5️⃣ S&P500 Energy Sector — AMEX:XLE
If energy equities sell off, it often preludes oil weakness.
Good higher-timeframe sentiment indicator.
🧩 Why These Correlations Matter
They help filter noise and add multi-asset confirmation.
When multiple correlated markets align, your trade idea gains more precision, timing, and conviction.
Smart traders don’t look at a single chart — they watch the entire ecosystem.
Brentcrude

Brent Oil Setup: Pre-Talks Correction ScenarioBrent Crude OIL ( FX_IDC:USDBRO ), over the past two months, has been rising due to escalating tensions in the Middle East and the potential for conflict between Iran and the U.S. If these tensions materialize, global oil supply could be impacted—especially given the significance of the Strait of Hormuz.
In the past 48 hours, however, news emerged that Iran-U.S. negotiations are set for Friday at 10 a.m. local time in Muscat, Oman, rather than Istanbul. If these talks yield positive results, oil prices may fall due to reduced tensions. Conversely, if talks fail, oil could spike again. Until then, we can rely on technicals for short-term opportunities.
Let’s quickly check Brent oil’s 4-hour chart. Brent has been in an ascending channel over the past 60 days and is currently near a resistance zone($71.30-$68.00).
From an Elliott Wave perspective, Brent seems to have completed a 5-wave impulse within the ascending channel. We can now anticipate a corrective wave.
I expect Brent oil to decline before the talks, potentially dropping to around $66.40. If agreement is reached, we could see a break of the lower channel line, with prices heading toward $63.64.
First Target: $66.40
Second Target: $63.64
Stop Loss(SL): $61.00(Worst)
Points may shift as the market evolves
💡 Please respect each other's opinions and express agreement or disagreement politely.
📌U.S. Dollar/Brent Crude OIL Analysis (USDBRO), 4-hour time frame.
🛑 Always set a Stop Loss(SL) for every position you open.
✅ This is just my idea; I’d love to see your thoughts too!
🔥 If you find it helpful, please BOOST this post and share it with your friends.

Bullish Opportunity with smal SL According to Global Uptrend on Weekly Timeframe
To Divergence on 1h Time Frame with CCI

Possible Bullish Uptrend channel OIL Price Next Months According to Fundamental Geopolitics events
According to Risk of World War
According to technical analysis, the end of the corrective wave is at the 50-60% Fibonacci retracement.
Convergence on CCI

BRN: energy reductionIn recent sessions, BRN has shown a gradual shift in sentiment toward sellers. Oil’s movement consists of a series of downward impulses that form the basis for a bearish scenario.
The chart shows that the price is losing stability in the upper ranges and is attempting to consolidate below local levels. Upward fluctuations appear more like pauses within the downward wave than genuine reversal attempts.
The fundamental backdrop also adds pressure: expectations of declining global demand and rising oil inventories in key regions provide an additional argument in favor of continued weakness.
As a result, BRN remains under the influence of bearish dynamics, where further development will depend on the market’s ability to stay within the current channel and confirm seller strength.

Expanding Correction Before a Potential Bullish ImpulseBrent crude has been developing inside a broadening / expanding corrective structure after the previous impulsive decline.
The volatility within this formation suggests indecision, yet the overall flow still fits the classic sequence of:
Impulse → Expanding Correction → Potential Next Impulse.
From a technical perspective, price has repeatedly respected the boundaries of the expanding structure, building a base of higher lows and compressing toward a breakout zone. A confirmed break above the upper trend line would unlock bullish momentum, with the 66.80–67.00 region standing out as the first major target due to unfilled inefficiencies and prior liquidity clusters.
What reinforces this scenario is that multiple technical analysts currently view the ongoing consolidation as a corrective phase rather than the start of a new bearish trend. Several independent traders identify the same broadening pattern, expecting a bullish expansion once the correction completes.
Fundamentally, short-term sentiment also supports the possibility of a rebound. Demand forecasts have recently stabilized, OPEC+ continues to manage supply conditions, and weekly inventory fluctuations have provided intermittent support for crude. These factors often allow corrective structures to resolve upward before broader macro trends take over.
At the institutional level, Goldman Sachs projects Brent to average near the mid-66s in the second half of 2025, aligning closely with the structural target from this chart. However, it is worth noting that EIA and S&P Global caution that global supply could still outweigh demand later on—meaning any bullish impulse may be limited unless fundamental conditions shift.
In summary:
The market structure supports a bullish breakout scenario.
Technical analysts widely agree on the expanding correction framework.
Short-term fundamentals allow for a recovery toward 66–67.
Longer-term outlook remains mixed, so managing risk above key resistance is essential.
This is an observational analysis, not financial advice.
XBR/USD: Geopolitics Are Once Again Driving Brent Crude PricesXBR/USD Chart Analysis: Geopolitics Are Once Again Driving Brent Crude Prices
On 21 November, we outlined a descending channel on the XBR/USD chart and noted that the bearish trend had been fuelled by easing geopolitical risks and hopes for an end to the war in Ukraine.
Ten days later, Brent crude is now trading above its late-November highs — once again driven by geopolitical developments.
Why is Oil Rising?
US President Donald Trump stated that the airspace over and around Venezuela “should be considered completely closed”. This immediately led to flight cancellations, created a de facto blockade, and raised the threat of military action in an oil-rich region. This risk premium is being priced into the current rally.
In addition, OPEC+ members have confirmed they will postpone the production increases planned for early 2026 — setting the stage for a potential supply deficit, especially if Venezuelan exports are disrupted.
XBR/USD Technical Analysis
Although there was no further downside extension, the descending channel remains valid. The downward move was met with strong buying interest (evident from the long lower wicks on candles in late November around $61.50), triggering an upward reversal from the channel’s lower boundary.
This week opened with a bullish gap, followed by a large bullish candle on the 4-hour chart — a sign of limited selling pressure and market expectations of higher prices.
However, Brent’s advance may soon stall due to nearby resistance zones:
→ around $63.90 (the 20 November high);
→ at the upper boundary of the channel.
Should sellers regain control, support may be found in the area between:
→ the channel’s median line;
→ the lower edge of the gap at $62.78.
This article represents the opinion of the Companies operating under the FXOpen brand only. It is not to be construed as an offer, solicitation, or recommendation with respect to products and services provided by the Companies operating under the FXOpen brand, nor is it to be considered financial advice.

XBR/USD Chart Analysis: Brent Crude Falls to Monthly LowXBR/USD Chart Analysis: Brent Crude Falls to Monthly Low
As the XBR/USD chart shows, today (Friday) Brent crude has dropped below $62, after rising above $64.50 as recently as Tuesday. This represents a decline of over 4% from the week’s high.
This sharp bearish movement is driven by an easing of geopolitical risks and hopes for an end to the conflict in Ukraine.
Media outlets are circulating insider reports and rumours of secret coordination between the Trump administration and Moscow on a ceasefire plan. The fall in oil prices suggests that the risk premium, which reflected fears of escalation and supply disruptions, is now being replaced by a scenario of conflict resolution, potentially including a relaxation of sanctions on Russia.
Bearish pressure is also supported by news of:
→ weakness in China’s economy, the world’s largest oil consumer;
→ rising oil inventories in US storage facilities.
Technical Analysis of XBR/USD
Since late October, oil prices have been forming a downward channel. Signs of aggressive selling include (as indicated by the arrows):
1→ a sharp drop without retracements during yesterday’s trading session;
2→ a breach of the $62.60 support level with a bearish gap.
In this context, it is reasonable to suggest that:
→ Brent crude could move towards the lower half of the channel;
→ the channel’s median may act as resistance.
Furthermore, if fundamental indicators confirm progress towards ending the war in Ukraine, the downward trend may continue. This does not rule out a scenario in which Brent tests the lower boundary of the channel, around the psychological $60 per barrel mark.
This article represents the opinion of the Companies operating under the FXOpen brand only. It is not to be construed as an offer, solicitation, or recommendation with respect to products and services provided by the Companies operating under the FXOpen brand, nor is it to be considered financial advice.

The Contango Conundrum: Why Crude’s Price Power WanesThe global crude oil market is signaling sustained weakness. A clear sign is the Contango in the West Texas Intermediate (WTI) futures curve for most of 2026. This structure prices future oil deliveries higher than immediate ones, strongly indicating a global supply glut. Major forecasting bodies like the International Energy Agency (IEA) and the Organization of the Petroleum Exporting Countries (OPEC) now confirm a record surplus looms in 2026, reversing previous tight market expectations. Understanding this decline requires a multidisciplinary lens, examining supply resilience against sluggish demand across several domains.
Geostrategy and Geopolitics: Production Over Protocol
Geopolitical decisions, paradoxically, contribute to oversupply. OPEC+ members are gradually unwinding previous voluntary production cuts, adding millions of barrels back to the market. This production boost, formalized in their latest agreements, increases supply visibility and dampens price spikes. Simultaneously, sustained geopolitical tensions between major powers often lead key consumers like China to ramp up Strategic Petroleum Reserves (SPR) , effectively soaking up immediate surplus but reducing future demand visibility. This policy-driven stockpiling mitigates immediate price falls, but structural oversupply persists.
Macroeconomics and Economics: Slowdown Meets Resilience
A deceleration in global oil demand growth meets unexpectedly resilient supply . Macroeconomic headwinds, including trade tensions and a sluggish global economic outlook, suppress consumption growth below historical trends. This tepid demand environment is exacerbated by expanding production from non-OPEC+ nations. Crucially, the United States, Brazil, Canada, and Guyana lead this non-OPEC+ supply expansion, challenging the cartel’s market dominance. The resulting imbalance, production exceeding demand, creates the chronic oversupply driving WTI into contango.
Technology and High-Tech: Efficiency Enhances Supply
Advancements in extraction technology dramatically boosted supply, particularly within the US shale sector. Continuous innovations in horizontal drilling and hydraulic fracturing sustain high US output, even as prices soften. Furthermore, the rapid expansion of Electric Vehicle (EV) sales and increasing vehicle fuel efficiencies represent a major technological headwind for transportation fuel demand. This shift, supported by global patent activity in battery and wave energy technology, structurally limits long-term oil consumption growth.
Patent and Science Analysis: The Energy Transition
Patent activity confirms the directional shift away from fossil fuels. While patents related to downhole completion systems and drilling fluid prediction remain, increased patenting in Carbon Capture and Sequestration (CCS) [/b and Green Hydrogen signals the industry's necessary pivot. The science of energy transition, focusing on low-carbon solutions, suggests a future where oil remains a critical input but faces mounting competition from technological substitutes. This long-term displacement risk pressures oil prices, even if demand remains firm in the short run.
Cyber and Strategic Risk: Supply Chain Security
The increasing reliance on complex digital infrastructure across the oil value chain introduces cyber risk . Successful attacks on pipeline operators or refineries can cause temporary supply disruptions and price spikes. However, the market currently views such disruptions as temporary events rather than long-term structural issues affecting the overall supply-demand balance. The oversupply acts as a buffer, with floating storage and ample inventory mitigating the impact of short-term, localized outages.
Investment Outlook: Watching Spreads
The market signals clearly indicate supply strength and demand vulnerability. The widening WTI contango structure provides a clear arbitrage opportunity for traders willing to finance storage. Investors should closely monitor the Brent-Dubai Exchange of Futures for Swaps (EFS), which is turning negative, underscoring specific weakening in the Atlantic Basin. Barring a sharp, coordinated OPEC+ cut or an unexpected large-scale geopolitical conflict, pricing pressure should persist into 2026. Traders must prioritize futures spread analysis over simple outright price forecasting.

Oil bounced from POC. Sanctions aganst russia did't push it upOil bounced from POC. Sanctions aganst russia did't push it up
which is so good for down trend)
in a case of retest of POC - u can take short trade with goals $55 and $49

BRENT OIL BUYWe're looking to take a low probability, -B buy setup. We say low probability because it is a bearish market. But it has been respect lows and demand zones in the discount area of a 15 minute range. So, we like the demand zone that formed yesterday off of a previous successful demand done. We're targeting a Daily FVG.

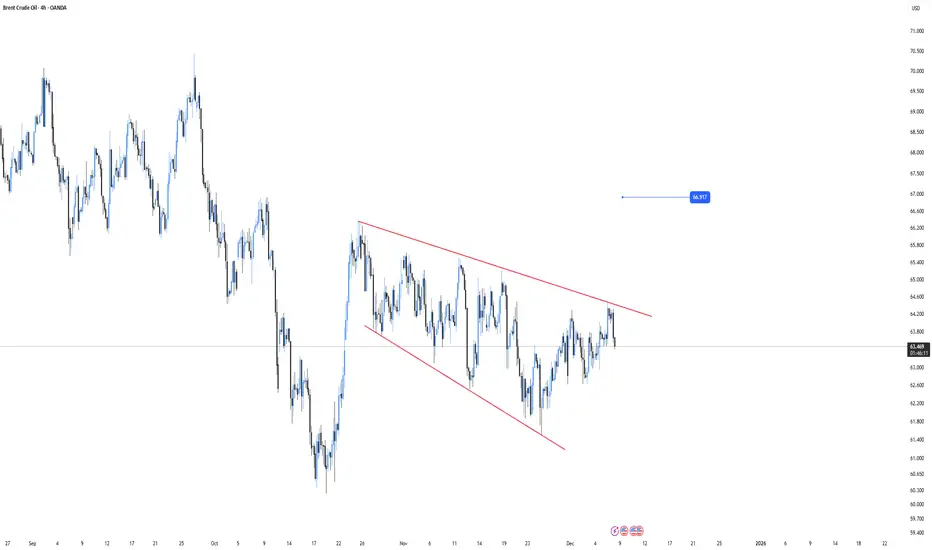
Brent Crude - The BEAR still rules!Price just can’t catch a break.
We’ve got a broken uptrend, a clear inverse cup and handle, and price trading below both the 20MA and 200MA – the classic “sell the rallies” setup.
As long as we stay under that red downtrend line, the bias is simple: down.
Target sits around $54.68, with momentum showing weakness across the board.
And yeah… we’ll still pay high fuel prices 😒
💸 Fundamental Reasons for Downside
🪓 Demand Destruction:
Global growth is slowing — less demand for oil from major economies. Probably due to an increase in demand for EV or other alternative energy vehicles in the making?
🇨🇳 China Concerns:
China’s recovery keeps disappointing, cutting one of oil’s biggest demand sources.
🪙 Strong USD:
A stronger dollar makes oil more expensive globally, reducing demand.
🛢️ OPEC Uncertainty:
Mixed signals and production inconsistencies are shaking investor confidence.
🏦 Interest Rates Bite:
High rates are squeezing industrial output and travel – both oil consumers.
Disclosure: I am part of Trade Nation's Influencer program and receive a monthly fee for using their TradingView charts in my analysis.

Q4 2025 Oil Market Outlook: WTI and Brent Crude Analysis**September 27, 2025**
## **Executive Summary**
As the global energy landscape enters the final quarter of 2025, the oil market remains delicately balanced between oversupply pressures and persistent geopolitical risks. West Texas Intermediate (WTI) and Brent Crude—two of the world’s most closely watched benchmarks—are trading in a narrow range, reflecting cautious sentiment among traders and investors. This report provides a comprehensive analysis of current market dynamics, evaluates key drivers, and offers a professional forecast for Q4 2025.
---
## **Current Market Snapshot**
- **WTI Crude (as of September 26, 2025):** $65.37/bbl
- **Brent Crude:** $69.72/bbl
- **YTD Performance:** WTI down ~14.8% from 2022; Brent down ~12.3%
Both benchmarks have shown resilience in recent weeks, supported by seasonal demand and inventory drawdowns, but face headwinds from rising global supply and economic uncertainty.
---
## **Fundamental Drivers**
### **1. Supply-Side Dynamics**
- **OPEC+ Production Increases:** OPEC+ has announced a phased increase of 547,000 barrels per day starting in September , with further adjustments planned for October. This marks the final unwinding of the 2.2 million bpd voluntary cuts initiated in late 2023.
- **Non-OPEC+ Output Growth:** U.S. production remains robust at 13.4 million bpd, with additional supply from Canada and Guyana contributing to a projected global surplus of 1.5% in Q4 .
### **2. Demand Outlook**
- **Global Demand Growth:** Forecasted to slow to ~1.1 million bpd in 2025, down from 1.8 million bpd in 2024.
- **Seasonal Trends:** Winter heating demand may offer temporary support, but overall consumption is expected to contract by 230,000 bpd in Q4.
### **3. Geopolitical Risks**
- **Russia-Ukraine Conflict:** Continued strikes on Russian energy infrastructure and renewed sanctions have injected volatility into the market.
- **Middle East Tensions:** Drone attacks and Red Sea disruptions have added risk premiums to Brent pricing.
- **U.S. Tariff Policy:** Aggressive energy tariffs and diplomatic pressure on European allies to reduce Russian imports have further complicated trade flows.
---
## **Technical Analysis & Market Sentiment**
### **WTI Crude**
- **Support Levels:** $62.90, $61.50
- **Resistance Levels:** $66.00, $68.00
- **Trend:** Neutral to mildly bearish; RSI hovering near 50.
### **Brent Crude**
- **Support Levels:** $67.00, $65.70
- **Resistance Levels:** $70.30, $72.00
- **Trend:** Consolidating in a symmetrical triangle; breakout potential remains.
---
## **Institutional Forecasts for Q4 2025**
Institution | WTI Forecast (Q4 2025) | Brent Forecast (Q4 2025)
------------------------|------------------------|---------------------------
EIA | $55.41 | $59.00
J.P. Morgan | $57.00 | $63.57
Goldman Sachs | $60.30 | $63.57
Trading Economics | $62.43 | $67.65
Reuters Poll | $64.65 | $68.20
---
## **Q4 2025 Price Forecast & Rating**
### **WTI Crude Oil**
- **Forecast Range:** $58.00 – $64.00
- **Base Case:** $60.00
- **Rating:** **Neutral to Bearish**
- **Key Risks:** Inventory builds, slowing demand, U.S. shale resilience
### **Brent Crude Oil**
- **Forecast Range:** $62.00 – $68.00
- **Base Case:** $65.00
- **Rating:** **Neutral**
- **Key Risks:** Geopolitical shocks, OPEC+ policy shifts, European demand softness
---
## **Strategic Implications for Stakeholders**
- **Investors:** Expect continued volatility; hedge positions via options and futures.
- **Producers:** Prepare for margin compression; focus on cost efficiency and capital discipline.
- **Policymakers:** Monitor inflationary impacts and energy security amid geopolitical tensions.
---
## **Conclusion**
The Q4 2025 oil market is poised for a cautious and potentially volatile close to the year. While geopolitical risks offer short-term support, the structural oversupply and weakening demand fundamentals suggest limited upside for both WTI and Brent. Market participants should brace for a range-bound environment with breakout risks tied to geopolitical developments and OPEC+ policy shifts.
---
Risk Disclaimer!
General Risk Warning: Trading on the Financial Markets, Stock Exchange and all its asset derivatives is highly speculative and may not be suitable for all investors. Only invest with money you can afford to lose and ensure that you fully understand the risks involved. It is important that you understand how Trading and Investing on the stock exchange works and that you consider whether you can afford the high risk of loss.

Oil Prices Rise on Geopolitical FactorsOil Prices Rise on Geopolitical Factors
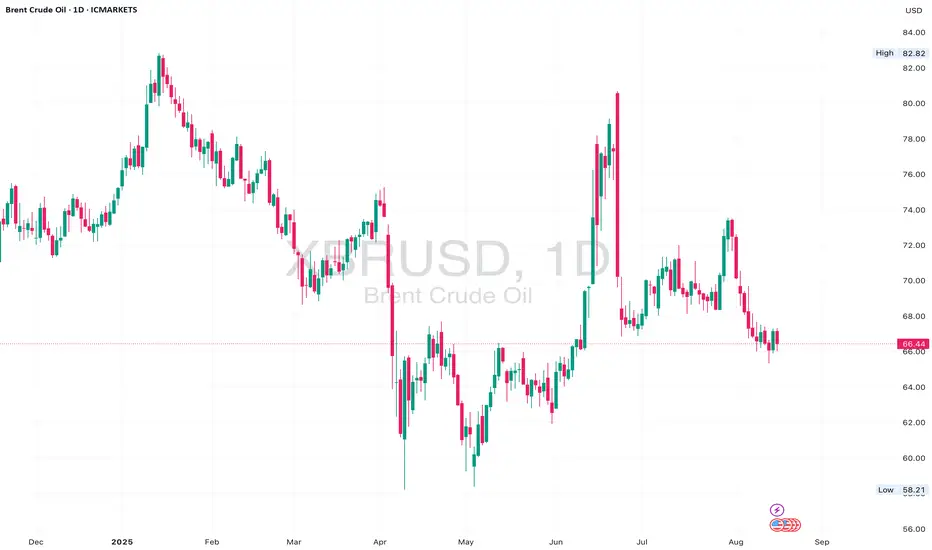
As the XBR/USD chart shows, Brent crude opened this week’s trading around $65.70, but today the price is near $66.80 (around +1.7%).
Oil is being pushed higher by geopolitical factors, including:
→ Israel’s strike on Hamas leadership in Qatar;
→ Trump’s calls for Europe to impose tariffs on buyers of Russian oil.
It is also worth noting that over the weekend an OPEC+ meeting took place. Although the decision was made to increase production, the volumes were smaller than analysts had expected.
Technical Analysis of the XBR/USD Chart
After the surge of extreme volatility at the end of July, Brent crude price fluctuations have been forming a descending channel (shown in red), with the following developments:
→ in September the price tested the lines dividing the channel into quarters (2 September – QH test, 5 September – QL test);
→ this week’s rise in oil looks like a return to the median, where supply and demand tend to balance out (in other words, where market participants more often agree on a fair price).
From a bullish perspective:
→ the $65.00 level appears to be an important support, having already proved its strength in August and September;
→ the sequence of higher highs and lows A→B→C→D→E suggests that pullbacks have been roughly half the size of bullish impulses – a sign of strong demand.
From a bearish perspective:
→ August price action suggests that a bear flag has formed as an interim correction within the prevailing downtrend;
→ the $67.50 level may act as strong resistance, as supply forces there were able to trigger a bearish breakout of the pattern.
Taking the above into account, we could assume that Brent prices may stabilise around the median in the short term, before sliding along it downwards – unless the balance of supply and demand shifts sharply (for example, under the influence of new geopolitical factors or the release of major economic indicators).
This article represents the opinion of the Companies operating under the FXOpen brand only. It is not to be construed as an offer, solicitation, or recommendation with respect to products and services provided by the Companies operating under the FXOpen brand, nor is it to be considered financial advice.

USOIL (WTI) Gann & Harmonic Pattern Points to Major Move!🛢️ 🛢️ USOIL (WTI CRUDE) Points to Major Move! ⚡ 📊
💹 Comprehensive Price Action Strategy | September 2025 Edition 🎯
📈 MARKET SNAPSHOT
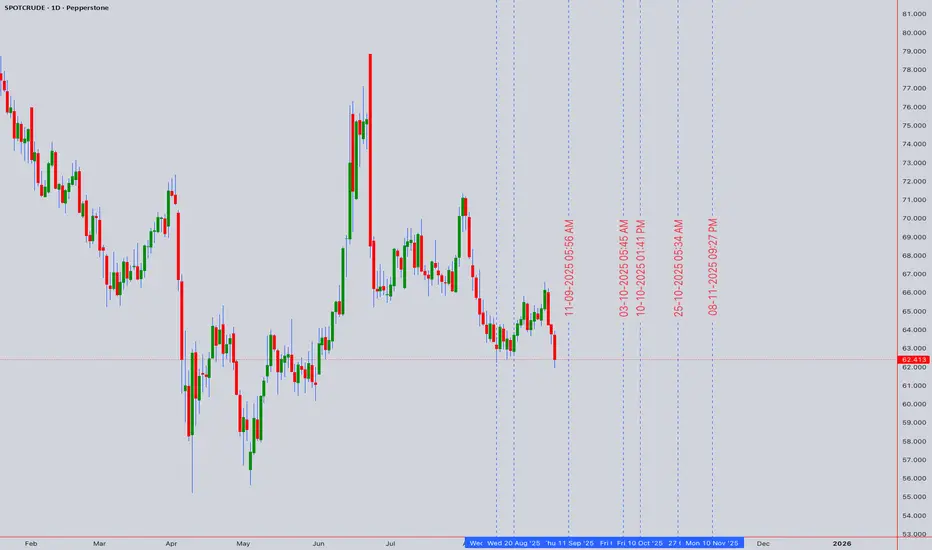
Asset: USOIL (SPOTCRUDE/WTI CASH)
Current Closing Price: $64.413
Date: September 6, 2025
Market Status: 🔴 Critical Support Zone Testing
🎯 EXECUTIVE SUMMARY
WTI Crude Oil is currently trading at $64.413, positioned at a crucial technical juncture. Our multi-timeframe analysis reveals a bearish-to-neutral bias with potential for a significant reversal if key support levels hold. The convergence of multiple technical indicators suggests heightened volatility ahead, presenting both risk and opportunity for astute traders.
📊 COMPREHENSIVE TECHNICAL ANALYSIS
🕯️ Candlestick Pattern Analysis
The recent price action has formed a Bullish Hammer pattern at the $64.00 psychological support level, suggesting potential exhaustion of selling pressure. This formation, combined with increasing volume, indicates possible accumulation phase initiation.
Key Patterns Identified:
- ✅ Bullish Hammer at support
- ⚠️ Evening Star formation on 4H chart
- 📍 Doji cluster indicating indecision
🌊 Elliott Wave Analysis
Current wave count suggests we're completing Wave 5 of a larger corrective structure:
Primary Count: Completing Wave C of ABC correction
Alternative Count: Wave 4 consolidation before final Wave 5 push
Target Zones:
- Bullish: $72.50-$74.00 (Wave 5 extension)
- Bearish: $58.00-$60.00 (Wave C completion)
📐 Harmonic Patterns
A Bullish Bat Pattern is forming on the daily timeframe:
- X: $78.45 (Recent High)
- A: $61.20 (Recent Low)
- B: $71.85 (0.618 Retracement)
- C: $64.41 (Current Price)
- D: $59.80-$60.50 (Projected - 0.886 XA)
Trading Implication: Watch for reversal signals near $60.00 for high-probability long entries.
🔄 Wyckoff Analysis
Current market structure suggests:
Phase: Potential Spring Test within Trading Range
Volume Analysis: Declining volume on recent decline = Lack of selling pressure
Smart Money Behavior: Accumulation signals emerging
Projected Move: Re-accumulation before markup phase
📊 W.D. Gann Analysis
Gann Square of 9 Calculations:
- Current Price: $64.413 sits on 225° angle
- Next Resistance: $68.00 (270° angle)
- Critical Support: $61.00 (180° angle)
Gann Time Cycles:
- September 15, 2025: Major time pivot ⏰
- September 22, 2025: Secondary cycle completion
Gann Fan Analysis:
- Price respecting 2x1 angle from July low
- Break above 1x1 angle at $66.50 signals trend change
☁️ Ichimoku Cloud Analysis
Current Position: Price below cloud - Bearish bias
Tenkan-sen: $65.80 (Immediate resistance)
Kijun-sen: $67.25 (Major resistance)
Cloud Support: $62.00-$63.50
Chikou Span: Bearish, below price 26 periods ago
📉 KEY TECHNICAL INDICATORS
📊 RSI (14-Period)
Current Reading: 42.5
Status: Approaching oversold territory
Divergence: Bullish divergence forming on 4H chart
Signal: Potential reversal zone approaching
📈 Bollinger Bands
Upper Band: $68.20
Middle Band (20 SMA): $65.85
Lower Band: $63.50
Current Position: Testing lower band
Volatility: Bands contracting - Breakout imminent
💹 VWAP Analysis
Daily VWAP: $64.85
Weekly Anchored VWAP: $66.20
Monthly VWAP: $67.50
Volume Profile POC: $65.00 (High volume node)
📊 Moving Averages Confluence
20 EMA: $65.85 ⬇️
50 SMA: $67.20 ⬇️
100 EMA: $69.50 ⬇️
200 SMA: $71.00 ⬇️
Status: Death cross on daily (50/200) - Bearish medium-term
🎯 TRADING STRATEGY
⚡ INTRADAY TRADING (5M-1H)
LONG SETUP 🟢
Entry Zone: $63.80-$64.20
Stop Loss: $63.40 (-1%)
Target 1: $64.80 (+1.5%)
Target 2: $65.40 (+2.5%)
Target 3: $66.00 (+3.5%)
Risk/Reward: 1:3.5
SHORT SETUP 🔴
Entry Zone: $65.60-$65.90
Stop Loss: $66.30 (-1%)
Target 1: $65.00 (-1.5%)
Target 2: $64.40 (-2.5%)
Target 3: $63.80 (-3.5%)
Risk/Reward: 1:3.5
📈 SWING TRADING (4H-DAILY)
BULLISH SCENARIO 🚀
Entry: $64.00-$64.50 (Current levels)
Stop Loss: $61.50 (-4%)
Target 1: $68.00 (+5.5%)
Target 2: $72.00 (+11.8%)
Target 3: $75.50 (+17.2%)
Position Size: 2% portfolio risk
BEARISH SCENARIO 📉
Entry: $65.80-$66.20 (Resistance retest)
Stop Loss: $67.50 (+2%)
Target 1: $62.00 (-6%)
Target 2: $59.50 (-10%)
Target 3: $57.00 (-14%)
Position Size: 1.5% portfolio risk
🗓️ WEEKLY FORECAST
Monday-Tuesday (Sept 9-10) 📅
- Expected Range: $63.50-$65.80
- Bias: Neutral with bullish undertone
- Key Level: Watch $64.00 support hold
Wednesday-Thursday (Sept 11-12) 📅
- Expected Range: $64.00-$67.00
- Bias: Potential breakout day
- Catalyst: EIA Inventory Data
Friday (Sept 13) 📅
- Expected Range: $65.00-$68.50
- Bias: Trend continuation
- Note: Options expiry volatility
🌍 MARKET CONTEXT & FUNDAMENTALS
Geopolitical Factors 🌐
- ⚠️ Middle East tensions supporting price floor
- 🇨🇳 China demand concerns capping upside
- 🇺🇸 SPR refill discussions providing support
Supply/Demand Dynamics ⚖️
- OPEC+ production cuts extended
- US shale production moderating
- Global inventory draws accelerating
Economic Indicators 📊
- Dollar Index weakening (Bullish for Oil)
- Global growth concerns (Bearish pressure)
- Inflation expectations rising (Supportive)
⚠️ RISK MANAGEMENT
Position Sizing Guidelines 💰
Intraday: Max 1-2% account risk per trade
Swing: Max 3-5% account risk per position
Correlation Risk: Monitor energy sector exposure
Stop Loss Strategies 🛡️
1. ATR-Based: 1.5x ATR from entry
2. Structure-Based: Below/above key S/R levels
3. Time-Based: Exit if no movement in 2-3 candles
Risk Factors ⚠️
- 🔴 Break below $61.50 invalidates bullish thesis
- 🔴 Unexpected OPEC+ policy changes
- 🔴 Rapid Dollar strengthening
- 🟢 Surprise inventory draws
- 🟢 Geopolitical escalation
🎯 KEY LEVELS TO WATCH
SUPPORT LEVELS 🟢
S1: $63.50 (Immediate)
S2: $61.50 (Critical)
S3: $59.00 (Major)
S4: $57.00 (Yearly Low)
RESISTANCE LEVELS 🔴
R1: $65.80 (Immediate)
R2: $67.25 (Daily 50MA)
R3: $69.50 (Daily 100MA)
R4: $72.00 (Major)
💡 PRO TRADING TIPS
1. 🎯 Best Entry Times: London/NY overlap (8-11 AM EST)
2. 📊 Volume Confirmation: Look for >20% above average
3. 🔄 Correlation Trades: Monitor USD/CAD inverse relationship
4. ⏰ Avoid Trading: 30 mins before/after EIA releases
5. 📈 Scale Strategy: Add to winners, not losers
🔮 MONTH-END PRICE TARGETS
September 2025 Projections:
Bullish Target: $72.00-$74.00 🎯
Base Case: $66.00-$68.00 📊
Bearish Target: $58.00-$60.00 📉
Probability Assessment:
- Bullish Scenario: 35% 📈
- Base Case: 45% ➡️
- Bearish Scenario: 20% 📉
📌 CONCLUSION & ACTION PLAN
USOIL presents a compelling risk/reward opportunity at current levels. The confluence of technical support at $64.00, combined with oversold conditions and potential harmonic pattern completion, suggests a tactical long position with tight risk management is warranted.
Recommended Strategy:
1. Primary: Accumulate long positions $63.50-$64.50
2. Alternative: Wait for breakout above $66.00 for momentum trades
3. Hedge: Consider put options if below $61.50
📝 TRADING CHECKLIST
Before entering any position:
- ✅ Confirm volume supports move
- ✅ Check RSI for divergences
- ✅ Verify multiple timeframe alignment
- ✅ Set stop loss before entry
- ✅ Calculate position size
- ✅ Review correlation with DXY
- ✅ Check economic calendar
- ✅ Assess market sentiment
🏷️ *Last Updated: September 6, 2025, 12:54 AM UTC+4*
🔔 Follow for daily updates and real-time trading signals!
For individuals seeking to enhance their trading abilities based on the analyses provided, I recommend exploring the mentoring program offered by Shunya Trade. (Website: shunya dot trade)
I would appreciate your feedback on this analysis, as it will serve as a valuable resource for future endeavors.
Sincerely,
Shunya.Trade
Website: shunya dot trade
⚠️Disclaimer: This post is intended solely for educational purposes and does not constitute investment advice, financial advice, or trading recommendations. The views expressed herein are derived from technical analysis and are shared for informational purposes only. The stock market inherently carries risks, including the potential for capital loss. Therefore, readers are strongly advised to exercise prudent judgment before making any investment decisions. We assume no liability for any actions taken based on this content. For personalized guidance, it is recommended to consult a certified financial advisor.
Brent Crude Breakdown: $61 Next?Structure & momentum
Price completed a three-leg climb into late August but failed beneath a thick supply band clustered around 68.50 → 69.30 and again lower-high’d under 70.80. The last push up rode a rising support line; that line has now broken, followed by two wide-range sell candles closing near their lows—classic momentum expansion after a trendline break. The repeated red “S” clusters over the same band reinforce where offers sit and where rallies have been sold.
Levels that matter
• Overhead supply / invalidation:
First layer at 68.50–68.55 (breakdown pivot), then 69.33, and the stronger cap near 70.78. Acceptance back above 68.55 would be your first caution; sustained closes over 69.33 would neutralize the short and put 70.78 / 72.74 back in play.
• Immediate pivot: 66.73. Price is pressing this prior support; losing it turns the path of least resistance lower.
• Downside magnets / demand layers: 65.79, 64.74, and the deeper 61.98 base. These align with prior reaction lows and liquidity pools where buyers previously defended.
Why the bias is bearish (now)
• Lower high into supply (failed to clear 69s) + rising trendline break = change of character on 4H.
• Momentum follow-through: consecutive strong bearish bodies suggest sellers in control rather than a single news spike.
• Clean downside structure: stair-stepped supports below (66.73 → 65.79 → 64.74 → 61.98) provide logical profit-taking waypoints and reduce the odds of “vacuum” reversals.
Risk catalysts to respect
The chart flags upcoming US energy data windows—inventory releases can create sharp, temporary squeezes against trend. Size accordingly and expect slippage during those prints.
________________________________________
📉 Trade setup (bearish)
• Entry (Option A – continuation): Short on a 4H close below 66.73, or on a minor pullback that rejects 66.73 from underneath.
o Stop: 68.55
o T1: 65.79 (take ~30%)
o T2: 64.74 (take ~40%)
o T3: 61.98 (runner)
o Approx. R:R from 66.73 → 68.55 / 61.98: ~1 : 2.7
• Entry (Option B – sell the rip): Preferable risk if price bounces into 67.90–68.40 and prints rejection.
o Stop: 69.33
o T1: 66.73
o T2: 65.79
o T3: 64.74 / 61.98
Trade management: After T1, move the stop to breakeven. From there, trail above each 4H lower high (or ~1.5×ATR above price) to stay in the trend while protecting open profit. If momentum accelerates through 64.74, tighten the trail to lock in gains on the runner.
________________________________________
Invalidation & alternate path
A decisive 4H close back above 68.55 is your yellow flag; above 69.33 the bearish thesis weakens materially and favors a broader squeeze toward 70.78 and possibly 72.74. Until then, rallies into 68s remain sell zones.
Bottom line: The market has rotated from a rising correction into distribution below 69s, broken trendline support, and is now threatening 66.73. Fading bounces or selling the breakdown targets 65.79 → 64.74 → 61.98 with disciplined partials and a trailing stop.

XBR/USD Chart Analysis: Brent Crude Nears Its Lowest LevelXBR/USD Chart Analysis: Brent Crude Nears Its Lowest Level Since Early Summer
According to the XBR/USD chart, this morning (19 August) Brent crude oil price is showing bearish momentum, moving towards its lowest level since early summer (set last week). The key bearish drivers in the market include:
→ OPEC+ policy aimed at increasing production;
→ expectations that negotiations to end the war in Ukraine could lead to the lifting of sanctions on Russian oil exports, which would further expand global supply.
Technical Analysis of the XBR/USD Chart
In our analysis on 5 August, we noted that:
→ Brent crude had fallen to an important support level (marked in blue), which held throughout July;
→ a bearish breakout attempt below the blue support line was possible.
Indeed, in early August the price confirmed a bearish breakout of the blue line, accompanied by signs of rising volatility – the line subsequently reversed its role from support to resistance (as indicated by the arrows on the left-hand side of the chart).
Bears then consolidated their position, continuing to apply pressure and forming a downward channel (shown in red). The question now is whether Brent prices can continue their decline.
From a bullish perspective, there are grounds for demand to strengthen around the key support level at $65.00 (as indicated by the arrows on the right-hand side of the chart):
→ during an attempt to move lower, the chart formed a bullish harami reversal pattern;
→ this level acted as support following the bearish gap at this week’s market opening;
→ yesterday’s long lower shadow highlights aggressive buying activity.
From a bearish perspective, August’s downtrend remains intact – though it may be losing momentum. Note the RSI indicator, which is gradually leaning towards the 50 level (if bears were still firmly in control, it would remain closer to oversold territory).
This suggests that bulls may attempt to seize the initiative and challenge the upper boundary of the descending channel, seeking to offset at least part of Brent’s nearly 10% decline since late July. In this scenario, the $67.40 level – where bears previously demonstrated strong control – could become a critical test of demand resilience.
Tomorrow’s key releases could significantly influence price action: crude oil inventories (15:30 GMT+3) and the FOMC minutes (21:00 GMT+3).
This article represents the opinion of the Companies operating under the FXOpen brand only. It is not to be construed as an offer, solicitation, or recommendation with respect to products and services provided by the Companies operating under the FXOpen brand, nor is it to be considered financial advice.

Brent Crude Squeeze – Daily Symmetrical Triangle Nears BreakoutBrent Crude has been consolidating within a symmetrical triangle on the daily chart since mid-May, following a strong bullish recovery from $58 lows. Price is now approaching the apex of the structure, suggesting a breakout is imminent.
We’re still holding above the higher low trendline support, but resistance at $71.00 remains unbroken. A decisive daily candle close outside this triangle will likely set the tone for the next leg.
A bullish breakout above $71.15 could expose $75.00 and eventually $82.00 highs. But if bears take control and break below $67.00 support, $64.00 and $58.00 reopen.
📈 Bias:
Neutral short term — Waiting for breakout confirmation.
Bullish if price breaks and retests above $71.15.
Bearish if we lose $67.00 and structure fails.
BRENT Robbery Setup: Thief's Bear Trap is Active!🔥💰BRENT BEARISH HEIST PLAN💰🔥
🎯 Asset: BRENT/ XBRUSD / UK Oil Spot
🧠 Strategy: Layered Limit Orders | Bearish Robbery in Progress
💼💣💼
Yo Money Movers & Market Jackers!
It’s time to load up the truck and roll out — the BRENT vault is cracked open and dripping with bearish loot! 🐻💵🔓
🎩 This isn’t just trading — this is Thief Trading Style™.
We don’t chase candles. We layer the loot, wait in the shadows, and strike on the pullback. No mercy. Just money. 💸🕶️
🚨 THIEF'S TRADE SETUP 🚨
🕵️ Entry Point:
Any Price Level – we’re everywhere.
Place layered Sell Limits like tripwires on the chart 🎯💣 — 15m or 30m candle nearest swing highs. The trap is set.
🛑 Stop Loss:
🔒 Locked @ 69.000 — right above resistance
This is a tactical retreat, not a failure. Every heist needs an escape route. 📉🔁
🎯 Target Zone:
💥 Aim for 65.000 — smash and grab style.
Get in, take profit, disappear into the shadows.
🧠 WHY THE HEIST?
The BRENT market looks ready for a rug pull —
🧊 Demand slowing
📉 Bearish structure unfolding
🎭 Bull traps getting exposed
🔥 Perfect time for thieves to cash out while the herd dreams green
Before pulling the trigger, check:
📰 Fundamentals 📦 Inventory Data 🧭 Intermarket Analysis 📊 COT Reports
Do your homework — then rob it like a professional. 🧠💼🔎
⚠️ MISSION WARNING ⚠️
Avoid new trades during news drops!
Use trailing SLs to protect loot. This market doesn’t play fair — but we don’t either. 🛑📰📉
💥 Hit BOOST if you're riding with the robbers!
Let’s show this market how Thief Traders steal gains like legends.
Every like = one more gold bar in the van 💰🚚💨
Stay sharp. Stay shadowed.
See you on the next job. 🐱👤💸📉
🔗 #Brent #XBRUSD #UKOil #ThiefTrader #BearishSetup #EnergyMarket #LayeringStrategy #MarketRobbery #SellThePump #RobTheChart

XBR/USD Chart Analysis: Oil Price Declines Towards Key SupportXBR/USD Chart Analysis: Oil Price Declines Towards Key Support
As the XBR/USD chart shows, Brent crude oil has made two significant moves recently:
Last week’s price increase (A) followed President Donald Trump’s intentions to impose tariffs on India due to its purchases of Russian oil. This could have disrupted established oil supply chains.
The price decline (B) may have been driven by both the decision of OPEC+ countries to increase production and reports of a weakening US labour market.
Thus, there is reason to believe that the more than 4.5% decline in Brent crude oil prices since the beginning of August reflects market participants’ scepticism about sustained high oil prices:
→ this has a negative impact on the US economy (JP Morgan analysts raised concerns about recession risks this week);
→ increased activity from oil producers may offset supply chain disruption risks.
Technical Analysis of the XBR/USD Chart
From a technical analysis perspective, Brent crude oil has dropped to a key support level (marked in blue), which was previously active in July. A rebound from this line could happen – in such a case, the price might face resistance at the Fair Value Gap area (marked in orange), formed between:
→ $70.81 – a support level active in late July, which was broken;
→ the psychological level of $70.00.
Attention should also be paid to price behaviour around the $69.00 level (indicated by arrows) – it quickly switched roles from support to resistance, indicating aggressive bearish sentiment. Given this observation, a potential bearish breakout attempt below the blue support line cannot be ruled out.
However, whether this scenario materialises will largely depend on developments in geopolitical risks and tariff agreements.
This article represents the opinion of the Companies operating under the FXOpen brand only. It is not to be construed as an offer, solicitation, or recommendation with respect to products and services provided by the Companies operating under the FXOpen brand, nor is it to be considered financial advice.

Here's why oil prices continue to slumpBrent Crude remains under pressure and has really caught our eye. The weakness in recent weeks is significant. The price recently failed to hold above its 200-day moving average, reinforcing downside risks. Without momentum, prices could revisit June lows unless short-term hurdles at US$69 and US$72 are decisively cleared.
This weakness aligns with BP's latest Energy Outlook, which is due out this week (usually in July each year). We'll be keeping a close on global wind and solar capacities, which are projected to increase eightfold and fourteenfold, respectively, by 2050. This rapid growth in renewables, coupled with declining oil demand, suggests a structural shift in energy markets.
China is leading this shift. By 2030, it is projected to install over 500 gigawatts of solar capacity annually, surpassing the United States' total annual energy production. This underscores the scale of China's renewable energy expansion.
The technical rejection at the 200-day moving average, combined with BP's forecasted demand peak, indicates a bearish outlook for oil. Unless Brent can reclaim and sustain levels above key resistance points, further declines are likely.
The convergence of technical weakness and shifting demand dynamics underscores a bearish stance on oil. Traders should monitor key technical levels and remain cautious amid these evolving market conditions.
The forecasts provided herein are intended for informational purposes only and should not be construed as guarantees of future performance. This is an example only to enhance a consumer's understanding of the strategy being described above and is not to be taken as Blueberry Markets providing personal advice.

Brent Crude Oil Long Swing Setup – Support Break at Key LevelBrent Crude Oil OANDA:BCOUSD has broken to the next key support level after a cease-fire announcement in the Middle East. A long position is considered only if support holds at $69.00.
📌 Trade Setup:
• Entry Zone: $69.00
• Take Profit Targets:
🥇 $73.50 – $76.00
🥈 $79.00 – $83.00
• Stop Loss: Daily close below $67.00
#BrentCrude #OilTrading #ForexTrading #LongPosition #SupportLevel #TradeSetup #CrudeOil #MarketAnalysis #TradingOpportunities #Commodities #OilMarket #Investing #PriceAction #OilPrices #TradingStrategy #ForexCommunity #InvestmentOpportunities #MarketUpdate

Oil Price Falls Below $69Oil Price Falls Below Pre-Escalation Levels of Middle East Conflict
According to the XBR/USD chart:
→ Prior to Israel’s airstrikes on Iran on 13 June, the price of Brent crude was hovering around the $69.00 mark;
→ Following US bombings in Iran, the price spiked at the Monday market open, reaching a high of approximately $77.77 (as we reported on 23 June).
However, after President Trump announced a ceasefire between Iran and Israel — later confirmed by statements from both sides — oil prices dropped sharply. This morning, Brent is trading around $68, which is even lower than the level seen before the initial strikes.
Media outlets report that analysts broadly agree that fears have eased, even if the ceasefire appears fragile. Market participants seem to view the likelihood of the conflict escalating into a full-scale ground war — involving US troops and the closure of the Strait of Hormuz — as low. Shipping through the strait is reportedly returning to normal.
Technical Analysis of the XBR/USD Chart
Interestingly, the $69 level — from which prices surged on 13 June — acted as resistance yesterday (as indicated by the arrow on the chart).
It can be assumed that the longer the ceasefire holds, the less relevant the fears that have served as bullish drivers. In that case, Brent crude prices may continue fluctuating within a downward channel, outlined in red, with the possibility of a short-term rise toward its upper boundary.
Nevertheless, the key drivers for oil prices will remain the fundamental backdrop and official statements regarding the situation in the Middle East and other geopolitical factors.
This article represents the opinion of the Companies operating under the FXOpen brand only. It is not to be construed as an offer, solicitation, or recommendation with respect to products and services provided by the Companies operating under the FXOpen brand, nor is it to be considered financial advice.
