Weekly outlook: XAUUSD, #SP500, #BRENT | 09 January 2026XAUUSD: BUY 4415.50, SL 4380.00, TP 4522.00
Gold starts the week near 4415.50 per ounce: thin trading at the beginning of the year has amplified reactions to news from Venezuela and broader geopolitical tension, lifting demand for safe-haven assets. Support also comes from expectations of lower US interest rates in 2026 and continued buying by central banks.
For the week of January 5–9, the focus is on US data on business activity and the labor market, with the key event being Friday’s jobs report. Weaker figures could strengthen interest in gold, while strong numbers may boost the dollar and cool the market temporarily.
Trading recommendation: BUY 4415.50, SL 4380.00, TP 4522.00
#SP500: BUY 6858, SL 6778, TP 7098
The #SP500 is holding around 6858 at the start of the first full week of 2026: investors are weighing geopolitics and oil, but the main guide remains expectations for US interest rates. After a strong finish to 2025, the market enters the week with a cautious tone.
The week of January 5–9 is packed with US statistics, with Friday’s employment report as the highlight. Moderate data would support equities through hopes of lower borrowing costs, while a surprise rise in inflation expectations and yields could increase pressure on the stock market.
Trading recommendation: BUY 6858, SL 6778, TP 7098
#BRENT: SELL 60.43, SL 62.10, TP 55.40
#BRENT is trading near 60.43 per barrel: news around Venezuela has added sharp swings, but the market sees no major supply disruptions for now. OPEC+ is keeping current output settings, and talk of potential supply growth ahead is capping prices.
For the week of January 5–9, the spotlight is on demand signals via US statistics and updates from China, as well as the regular US inventory figures. If demand stays soft and the dollar strengthens, oil risks sliding; however, tighter sanctions or logistical disruptions could quickly restore support.
Trading recommendation: SELL 60.43, SL 62.10, TP 55.40
Brentshort

Is Brent Crude Setting Up for a Deeper Pullback?🔥 BRUTAL BRENT (UKOIL) SELL BLUEPRINT — Day & Swing Trade Guide! 🔥
Asset: BRENT “UKOIL” — Energies Market Trade Opportunity Guide (Day / Swing Trade)
Bias: Bearish Plan 📉
📍 Trade Setup Overview
The market is showing a clear downside narrative as liquidity continues shifting away from buyer strength. Volatility pockets + premium zones are forming the ideal backdrop for a controlled bearish play.
🎯 Entry
ANY PRICE LEVEL ENTRY
This setup focuses on structure, not perfection. Price exploration zones offer multiple opportunities to position short as long as the bearish narrative remains intact.
🛡️ Stop Loss
This is the Thief SL @ 62.500
Dear Ladies & Gentleman (Thief OG’s), adjust your SL based on your own system, risk comfort, and volatility tolerance.
Note: I am not recommending that you set only my SL — your capital, your control, your rules. Manage risk like a professional.
💰 Target
We have strong support, oversold confluence, and visible trap behaviour forming below, so the smart exit is clean and disciplined.
Target @ 59.500
Note: Dear Ladies & Gentleman (Thief OG’s), I am not recommending that you use only my TP. Make money, take money — at your own execution style & risk preference.
🔗 Related Pairs to Watch (Correlation Guide)
1️⃣ WTI Crude Oil — USOIL / CL
Moves closely with Brent (UKOIL).
If WTI weakens, Brent often mirrors the same bearish energy.
Watch for supply-zone rejections & macro oil inventory pressure.
2️⃣ Natural Gas — NGAS / XNGUSD
Energy sector sentiment often overlaps.
When overall energy demand weakens, oil tends to follow with downside momentum.
Good for gauging sentiment shifts.
3️⃣ CAD Pairs — USDCAD, CADJPY
Canada is an oil-exporting economy.
If oil falls, CAD weakens, making USDCAD push upward.
A great indirect correlation filter for confidence.
4️⃣ DXY — US Dollar Index TVC:DXY
A rising dollar = pressure on commodities.
Strong USD typically accelerates bearish moves on Brent.
5️⃣ S&P500 Energy Sector — AMEX:XLE
If energy equities sell off, it often preludes oil weakness.
Good higher-timeframe sentiment indicator.
🧩 Why These Correlations Matter
They help filter noise and add multi-asset confirmation.
When multiple correlated markets align, your trade idea gains more precision, timing, and conviction.
Smart traders don’t look at a single chart — they watch the entire ecosystem.

Weekly Outlook: XAUUSD, #SP500, #BRENT | 19 December 2025XAUUSD: BUY 4327.20, SL 4300.00, TP 4420.00
Gold enters the week of December 15–19, 2025 near record highs, with prices holding around $4,327 per ounce. The main support comes from expectations of lower US rates following the Federal Reserve’s December rate cut, as well as the market’s sensitivity to any signs of slowing growth. Demand is also reinforced by risk-off sentiment linked to geopolitical tensions and news about broader investor access to gold via funds in major markets.
For the week ahead, the key drivers are fresh US macro data and decisions from leading central banks. If US bond yields and the dollar keep easing, interest in gold is likely to remain strong. A restraining scenario would be the opposite: stronger US data that pushes the dollar and yields higher. In the base case, gold looks resilient, but headline-driven volatility may stay elevated.
Trading recommendation: BUY 4327.20, SL 4300.00, TP 4420.00
#SP500: BUY 6846, SL 6780, TP 7040
US equities start the week with mixed sentiment: after sharp moves in some technology names, investors are becoming more selective, but the broader backdrop remains supportive. S&P 500 futures hover near 6,846, and the focus is on the rate path and the health of the US economy. The recent Fed rate cut helps expectations for lower financing costs and supports risk appetite.
This week’s spotlight is on a heavy central-bank calendar (including Japan, the UK, and the euro area) and key US releases (some statistics are published with delays), which can quickly shift positioning. A constructive scenario for the index is the absence of negative surprises on inflation and jobs alongside expectations of a more accommodative policy stance later on. Risks to the upside include a sudden deterioration in the external backdrop or renewed concerns about stretched valuations in parts of the market.
Trading recommendation: BUY 6846, SL 6780, TP 7040
#BRENT: SELL 61.44, SL 62.10, TP 59.40
Brent opens the week around $61.44 per barrel. In the near term, prices are supported by supply-disruption risks — notably around Venezuela, sanctions constraints, and isolated attacks on oil infrastructure. Such headlines can trigger quick spikes higher even when demand is not particularly strong.
However, fundamentally, the week’s dominant theme is excess supply and rising inventories. A number of international assessments and US outlooks point to a risk of market surplus in 2026 and downside pressure on prices if current production levels persist. In practice, this means rallies may more often meet selling interest, and the market could react sharply to any signals of weaker demand or higher supply. As a result, the baseline bias for the week is mildly negative, with volatility likely to remain elevated.
Trading recommendation: SELL 61.44, SL 62.10, TP 59.40

BRN: energy reductionIn recent sessions, BRN has shown a gradual shift in sentiment toward sellers. Oil’s movement consists of a series of downward impulses that form the basis for a bearish scenario.
The chart shows that the price is losing stability in the upper ranges and is attempting to consolidate below local levels. Upward fluctuations appear more like pauses within the downward wave than genuine reversal attempts.
The fundamental backdrop also adds pressure: expectations of declining global demand and rising oil inventories in key regions provide an additional argument in favor of continued weakness.
As a result, BRN remains under the influence of bearish dynamics, where further development will depend on the market’s ability to stay within the current channel and confirm seller strength.

Scenario Brent Crude OilI will first focus on the marked circle where the overall turning point can take place, if the price does not reach the support, it is quite possible to move from the marked triangle in the direction of the long, because based on Elliott's wave theory, there is a long formation, if the price breaks below this zone, it is quite possible to weaken prices and proceeding to lower prices

BRENT CRUDE OIL may drop in price by as much as -65%Today we would like to share my opinion on the possible price of Brent Crude Oil in the coming years, analyzing the chart on a monthly timeframe
The war in Ukraine is not just a war between the two countries, it is a geopolitical problem that will affect all world economies.
The world's economies have not yet recovered from the Covid-19, and here is another blow.
Expensive energy will stop buying due to the excessive cost of production of "everything", the purchasing power of the population falls. Declining demand for oil will bring down the price.
The fall in the price of Brent oil -25% in the coming months in the area of $78-80 per barrel will be just the beginning.
But looking at the schedule, is striking the price zone of $36-46 to be a strong mirror level and this is -65% of the current price
Maybe this is a fair price for oil, from where a total restart of the world economy can take place by purchasing cheap energy resources.
Perhaps this is symbolic, but for the first time on the historical price chart of Brent, the zone of $36-46 was established as important when there were powerful geopolitical world changes: 1979-1980 - the Islamic Revolution and 1990-1991 - the collapse of the USSR

BRENT (Brent Crude Oil) SELL TF W1 TP = 35.69On the W1 chart the trend started on April 2022 (linear regression channel).
There is a high probability of profit taking. Possible take profit level is 35.69
Possible variant by dates, approximately June-July 2025 (this is my personal opinion, my calculation).
Using a trailing stop is also a good idea!
Please leave your feedback, your opinion. I am very interested in it. Thank you!
Good luck!
Regards, WeBelievelnTrading

Brent Seell!Based on the previous analysis I had done on this commodity, it is now time for a sell entry considering that the price has retested the support zone, converting it to a resistance zone.
Entry point at 80, SL at 82 and TP at 76.

Brent Crude Oil Shooort!Based on the previous analysis I had done, it seems that this commodity might test the lower trend line of the pennant pattern.
Considering that it is consolidating as for now, a sell entry position can be entered at around 80.80, when the price breaks out,
Let us wait as for now to gain more clarity.

UKOIL (Brent) Technical Analysis - VideoIn my previous post, I shared my analysis on Brent crude oil. Here's a video explaining the reasoning behind my trade idea:
Currently, Brent is trading within a daily range-bound channel. It's pushing against the upper boundary, which hints at a possible retracement to test previous lows. Interestingly, historical data over the past decade suggests that March tends to be a bearish period for Brent.
Disclaimer: Remember, this analysis is based on technical factors and should not be seen as direct financial advice. Trading commodities is inherently risky. Before making any trades, always consult with a qualified financial professional and carefully consider your own risk appetite.

BRENT - Interesting sell zone!Hello everyone!
The plan is still in effect; I've taken a second entry!
- Here's my view on BRENT:
- We have liquidity.
- We have an interesting zone.
- We have the optimal Fibonacci.
- We have accumulation before/on the zone.
- We are with the trend.
Fundamentally, we'll continue to monitor the evolution of conflicts in the Middle East because they can significantly impact the price of oil in case of escalating tensions! Given that we have the largest oil producers there, having conflicts nearby is concerning! So, stay cautious.
That's why I see BRENT drop in the zone and bumping!
🚀 If you liked it and want more, don't hesitate to subscribe and boost the post!

Oil Brent - H4Oil Brent
W1 - The formation of a 3-wave structure continues
D1 - The price has reached 161 lvl. 3rd wave, which may mean further movement down to level 200 - 261
H4 - The price is in the correctional 4th wave, you can see the formation of an ascending channel. If the lower trend line is broken or fixed behind it, further sales to the levels of 75.4 can be considered
You can also consider entering from the formation of a double top and further movement to the lower boundary and beyond.
What to expect now?
Expectation of breaking through the level of 82.20 and fixing the lower border from the level of 81.15.
When opening a position, it is best to exit the position from the level of 83.60; if this scenario does not materialize and the price may return to the local range, wait for the lower border of the channel to be broken.
Short
Targets 80.00 - 79.16 - 78.43 - 76.87 - 75.41

Oil Brent - W1Oil Brent
W1 - The price has formed a 3-wave structure, which may indicate a trend reversal, and if this scenario is implemented, it will be possible to potentially see the price at the level of 66.30. Judging by geopolitical data, due to the rise in oil prices and the growth of the asset, there was a local movement. To confidently enter sales, it is better to wait for the level of breaking through the 1st wave of 83.30 to be fixed.
What to expect now?
Waiting for the breakout and fixation at the level of 83.30. When opening a position, it is best to exit the position from the level of 88.13, if this scenario does not materialize and the price may return locally to the range of 85 - 95
Complete cancellation of the script mark 93.83
Short
Targets 81.18 - 76.73 - 72.80 - 66.30

BRENT OIL ( UK OIL ) LONG term Trade AnalysisHello Traders
In This Chart UK OIL HOURLY Forex Forecast By Forex Planet
today UKOIL analysis 👆
🟢This Chart includes_ (UKOIL market update)
🟢What is The Next Opportunity on UKOIL Market
🟢how to Enter to the Valid Entry With Assurance Profit
This Video is For Trader's that Want to Improve Their Technical Analysis Skills and Their Trading By Understanding How To Analyze The Market Using Multiple Timeframes and Understanding The Bigger Picture on the Charts.

Brent \ Oil - AnalysisOil Brent
MN - The price has broken through the trend line at 87.51, which may indicate the beginning of an upward movement.
W1 - We are observing a retest after the triangular formation and a breakout of the level of 87.51; for the price to move further upward, it is necessary to wait until the price consolidates at this level, which will open up the possibility of moving to the level of 108 - 125
If the price does not fix at the level of 87.51, we can expect a continuation of the downward movement with a target to the 71 price level
What can you expect now?
When moving up, the nearest target is 99.34
When moving down, the nearest target is 81.64
Long
Targets 99.34 - 108.94 - 125.09
Medium term - targets 92.34 - 94.87 - 99.34
Short
Targets 81.64 - 76.52 - 71.27
Medium term - targets 85.40 - 83.79 - 79.81

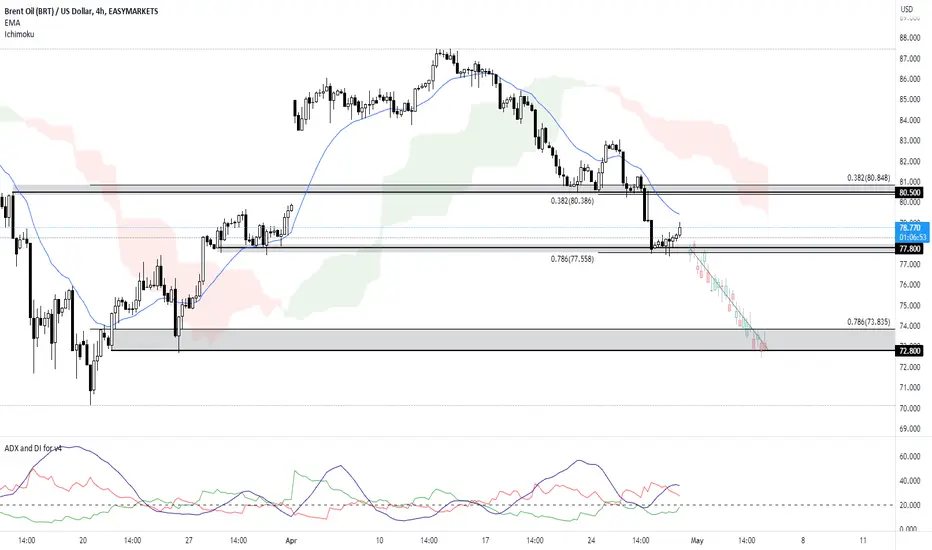
Bearish outlook on BRTUSD - 28 April 2023Price is hovering above a key support zone at 77.80 on the H4 timeframe. A break below this zone, which is in line with the 78.6% Fibonacci extension level, could provide the bearish acceleration for a further throwback to the next support zone at 72.80, which coincides with the 78.6% Fibonacci retracement. Price is holding below the 20 EMA and Ichimoku cloud, while ADX above 25 is indicating a strong trend, supporting our bearish bias.
Brent. Way to $50s? Will divergence play out?UK Oil/Brent
As we can see price is going down in descending channel. Bearish divergence is formed and signalling for lower targets. I will expect to reach region of $69 by the end of March and area of $57 by June/July.
Let me know what you think!?

Brent: Christmas Miracle ✅🎄We're finally seeing green! After waiting the whole year for Brent to reach the green target zone between $77.10 and $42.16, our British friend finally came through! We're expecting the course to sink a bit further to finish off green wave before heading back North above the $80.79-mark.

Brent is in nomans landRectangle Formation has formed on Daily and it's anyone guess where it's going.
On the bearish side, 3 Black Crows candles have formed as the price touches the medium beartrend line.
We need to wait for a breakout before we do anything...
Bull $120
Bear $67.65

Crude prices under downside pressureCrude prices under downside pressure on the back of weaker demand outlook
The recent break below the $92 short term support level has opened up the prospects for a further decline towards a test of the September 30th lows near $84, the bearish outlook can be technically supported by the fact that current price is below its 20 and 50 day simple moving averages, as well as the fact that the 14 day relative strength index has crossed below its respective signal line (bearish). Short positions can therefore be technically supported provided price is unable to push back above the recent support now turned resistance at $92. Short sellers may be looking for $84 and $81 as potential downside targets, while longs may be aiming for a retest of the $92 area with $93.54 in extension.

BRENT CRUDE OIL BEARISH PREDICTIONSPrices of petroleum are declining due to increased output by OPEC and United States and weakening demand by the Chinese economy.
RSI index of the Daily graph of BRENT is below the neutral line of 50, and MACD histogram, although still above 0 line, is declining.
If the price keeps falling, it might test its previous support at 91.50 and if it breaks it, it might target levels of 84. Alternatively, it might try to reach levels of 105.5
Risk Disclosure: Trading Foreign Exchange (Forex) and Contracts of Difference (CFD's) carries a high level of risk. By registering and signing up, any client affirms their understanding of their own personal accountability for all transactions performed within their account and recognizes the risks associated with trading on such markets and on such sites. Furthermore, one understands that the company carries zero influence over transactions, markets, and trading signals, therefore, cannot be held liable nor guarantee any profits or losses.
