FireHoseReel | BNB Daily Analysis #2😄 Hey! How’s everything? Hope you’re doing great!
🍾 Welcome to FireHoseReel — make sure to follow and enjoy the analysis along the way.
If you ever want a custom chart breakdown, just leave a comment and I’ve got you.
😎 Now let’s jump into the analysis of my favorite coin: BNB .
👀 BNB – 4H Timeframe
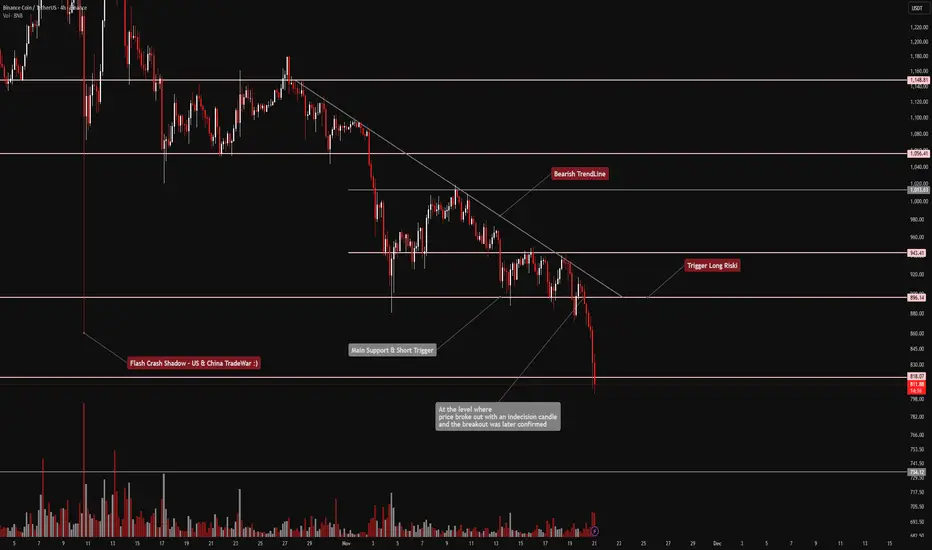
BNB recently gave us a short trigger on the 4-hour chart after breaking its key support at $896. Price dropped right toward our first target at $818, hit it cleanly, and is now stuck in a “mid-zone” with no clear direction.
Even on a multi-timeframe view, we currently don’t have any valid entry trigger, so we need to wait for new structure formation before planning the next move.
📊 Volume Analysis
Our volume indicator played a major role here:
Once the support broke and the short trigger activated — exactly as mentioned in yesterday’s analysis — sell pressure increased sharply.
Whales also started selling their BNB as soon as the support failed, and many traders used this opportunity to enter short positions.
Volume is still showing bearish pressure, and the last two 4H candles had a strong increase in selling activity, turning into clear downward momentum.
✔️ Now let’s analyze something different — BNB/BTC pair
On the 4H timeframe, this pair is still moving inside its trading range and has managed to maintain its relative strength against BTC.
However:
• A breakout above the range high at 0.010162 could trigger a strong bullish move
• A breakdown below the range low at 0.009800 could lead to a deeper correction in the BNB/USDT pair and accelerate the bearish momentum there
For now, the pair holds a bullish bias, but we need confirmation through an actual breakout.
✍️ Current Scenarios
We don’t have a new setup today, as yesterday’s short position already played out and is still valid.
For a new entry — long or short — we need BNB to build a fresh market structure and give us a clean trigger.
Until then, patience is the best strategy.
🛞 Risk Management & Disclaimer
Please remember to always use proper risk management and position sizing. Nothing in this analysis is financial advice. The market can change quickly, so always trade based on your own strategy, research, and risk tolerance. You are fully responsible for your own trades.
BSC
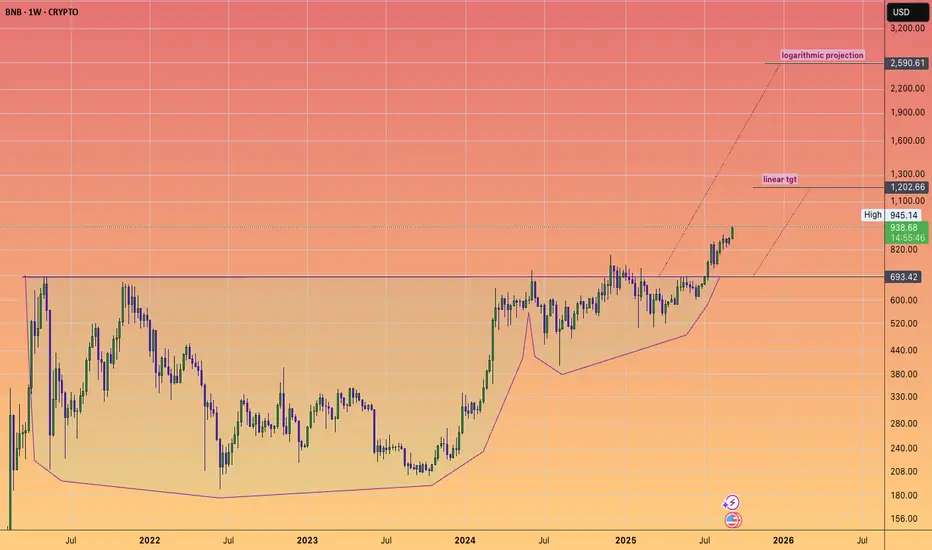
BNB is in price discovery. How high can it go?We're looking at around $2600, and indeed these projections can be met and exceeded.
So plenty of upside left it appears.
If we compare BNB to ETH
BNB has a marketcap of $130 Billion
ETH = $562 B
BNB has a deflationary model;
Quarterly formulaic burns.
And real time burning of gas fees via smart chain transactions.
This has reduced supply by 31% since 2023
Institutional demand is increasing via D.A.T.'s
With over 30 companies allocating $1.2B as of now.
TVL:
BNB = $58B
ETH = $102B
Daily TX's
BNB = 4.1 Million
ETH = 2M on the L1 & 3.4M on L2's
It's BNB SZ Real Flow. Perps >$100B, Memes ExplodingSummary
BNB just put in a vertical move on market cap and the BNB Chain narrative has flipped risk-on. Perp flow spiked, memecoin breadth exploded, and CEX/Wallet primitives are amplifying the loop. I’m positioning for continuation with a “buy dips / rotate to BNB Chain beta” plan, with clear invalidations.
What’s happening (from the provided charts)
Perp flow: Daily perp volume on BSC crossed ~$100B two days ago (screenshot from @BNBCHAIN). Liquidity + leverage are back, and that historically fuels multi-day trend moves.
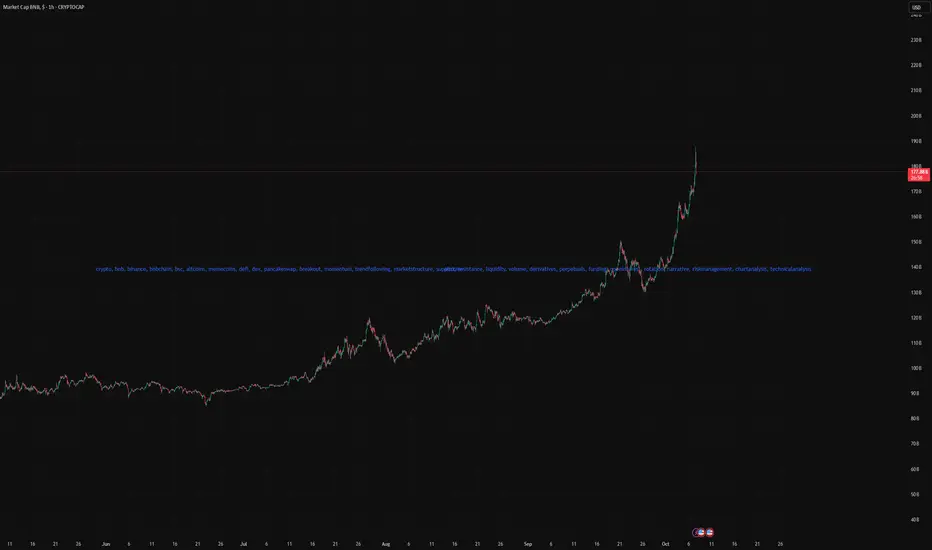
Market cap structure: BNB market cap chart (1h) shows a clean breakout to ~$180B after a month of stair-step advances. Vertical extension suggests momentum, but also raises the odds of sharp pullbacks.
Breadth / heat: Multiple watchlists show BNB memecoins ripping (Palu, “4”, BINA, GIGGLE, etc.). You’ve got 100–200M MC runners across the board and “OKX Wallet Trending” screenshots with BNB-pairs at the top.
Distribution layer: Trust Wallet is actively pushing SOL→BNB swaps (giveaway post), which validates and accelerates the rotation flow.
Narrative lock-in: Multiple posts repeat “BNB Szn” with compounding social proof (CMC Boosts, DEXScreener Boosts/Ads on $SZN, “BNB > XRP/USDT market-cap rank #3” callouts). This is the reflexive feedback loop you want during the early innings of a chain season.
Thesis
BNB is entering a chain-season regime: high perp activity → higher spot liquidity → memecoin breadth → more attention → more perp activity. Until perp volumes cool and breadth narrows, continuation is the base case.
Levels & structure (using the market-cap chart)
Breakout area: ~$170–172B mcap (prior ceiling). First buy-the-dip zone if momentum cools.
Trend support: rising 1h/4h structure sits roughly mid-170s B. Lose this with heavy perp unwind = momentum broken.
Upside magnet: $200B psychological round number. Extension targets beyond that depend on breadth staying hot.
Rotations
Core beta: BNB spot/perp on dips to prior highs.
Chain beta: BNB memecoins with liquidity + CEX/Wallet visibility. Names in your screenshots (Palu, “4”, BINA, GIGGLE) are already in motion; stick to rule-based entries (liquidity > $1–3M, no stealth revokes, active socials).
Tools signal: “Trending” tabs (OKX Wallet, Dexscreener Boosts, CMC boosts) are acting like momentum filters this week—lean into them while the season is hot.
Catalysts to monitor
More DEXScreener/CMC boosts for BNB-pairs.
CEX wallet trending panels featuring BNB tokens.
Trust Wallet / Binance ecosystem promos (SOL→BNB incentives).
Bottom line
As long as perp flow stays elevated and breadth remains wide, trend-following + dip-buying BNB and rotating into liquid BNB-chain beta is the optimal stance. Lose trend support + perp dries up → exit to strength and wait for the next setup.
CZ's DOG Broccoli - potential inv. head & shoulders.With #BNB cruising past the key $1000 mark.
Let's take a look at the CZ memecoin based on his pet dog #Broccoli.
*Memes should be fun gambles*
any allocation above 1% can start causing financial damage in your portfolio!
But as lesson in speculation they can be great tools!
And a chart is a chart.
Let's see if this coin can bust through that wide neckline.

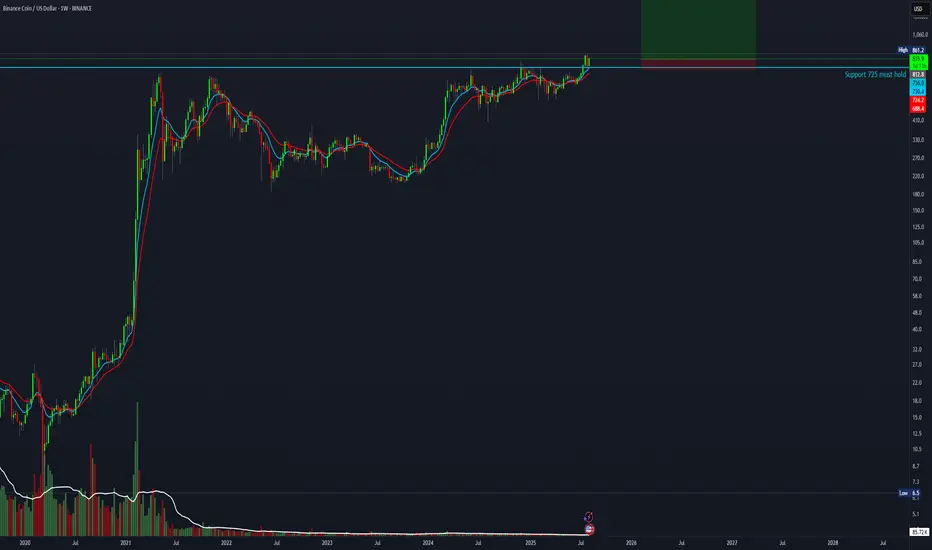
25R setup for BNBEveryone is talking about ETH right now, but don’t forget about this monster — BNB. BNB is about to break out after a successful retest of macro support. Where’s the end after the $850 breakout? Do you really want to bet against CZ? Stop-loss below support at $725.
Good luck — not financial advice.
The successful trader anticipates activity in BSC🔁 Wallet 0x1ebab9c329317082577f0e495cbe5b0d4958c5e7 just bridged: 4 000 USDC left Ethereum → HitBTC, then 3 915 USDC hit BNB Chain minutes later.
DefiLlama shows ~$14M fresh inflows today in BSC, while ETH flows cool—signaling a rotation play.
Expect this whale to farm BSC yield or snipe rising alts next 📈
🔝 Score: #39 | Balance: $13.4k | Results: $16.4k→$219.5k (+1,340 %, 44 trades, avg buy $1,020 / sell $2,643).

HolderStat┆BNBUSD consolidation breakout hunts 700-720CRYPTOCAP:BNB ended a protracted falling-channel decline by igniting from a tight consolidation rectangle around 600 USDT. The ensuing surge stalled near 670 and is now rechecking the breakout zone at 640, which also aligns with the underside of a freshly drawn rising wedge. A successful hold here could catapult price toward the 700-720 resistance corridor, the depth equivalent of the prior consolidation range. Slip back under 620 would risk sliding into the old channel.

HolderStat | Smart money is interested in BNB🚀 Wallet Snapshot:
● Recent moves: withdrew 26.62 BNB from Binance → Bitget & UniversalRouter; swapped 122.78 K KILO via PancakeSwap
● Top holdings: 17.962 CRYPTOCAP:ETH | 13.683 CRYPTOCAP:BNB | 122.781 K BYBIT:KILOUSDT
● Performance: $250 K+ net profit
Savvy rotation perfectly timed for this mark-up phase! 🔥

WHY Token Set for Breakout Amidst Symmetrical Triangle PatternBuilt on the Binance Blockchain (BNB) WHY is a bipolar Elephant, RAMPAGE after FOMO (In the dream). Dancing and Happi all the daytime.(In real life) $BNB. The token is set for a bullish surge amidst a Bullish symmetrical triangle with about 50% surge in sight.
Chart patterns like the bullish engulfing pattern has been formed waiting for a breakout above the celling of symmetrical triangle. With the Relative Strength Index (RSI) at 65, TSXV:WHY is more than ready for a breakout with build up momentum.
The Binance smart chain (BSC/BNB) is evolving rapidly as data from DefiLama shows about $5.134 Billion has been locked in Total Value Lock (TVL) by DeFi projects showing a level of immense trust levied on BSC chain.
WHY Price Live Data
The live WHY price today is $0.0000000677 USD with a 24-hour trading volume of $5,579,911 USD. WHY is up 5.95% in the last 24 hours, with a live market cap of $28,417,541 USD. It has a circulating supply of 420,000,000,000,000 WHY coins and a max. supply of 420,000,000,000,000 WHY coins.

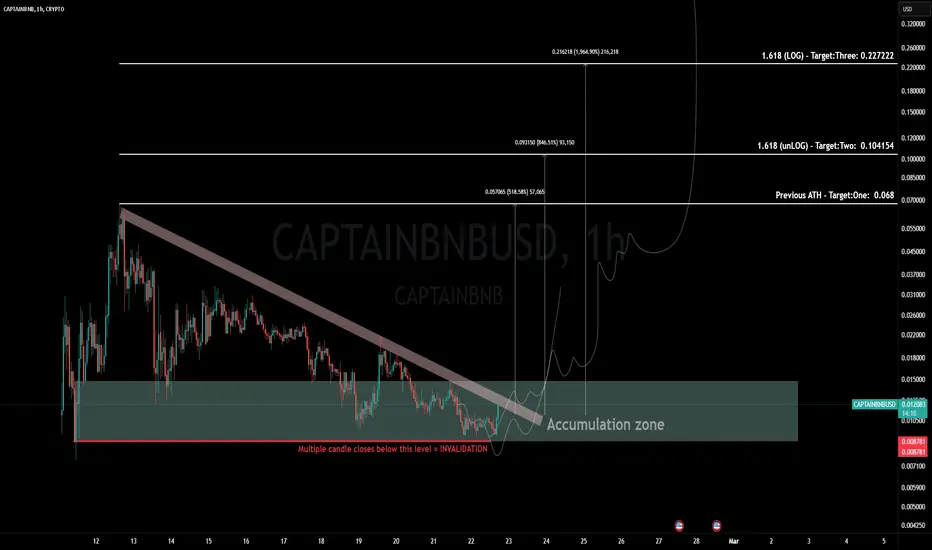
CaptainBNB - BSC Meme mascot. 10x GEMS CaptainBNB is a meme coin on the BNB Chain, inspired by the chain's official mascot introduced on February 10th by the BNBChain X account. It started as a humorous concept but has grown into a rapidly expanding community within the BNB ecosystem. Positioned as a playful yet ambitious project, CaptainBNB aims to lead the meme coin trend on the BNB Chain, leveraging its unique narrative and strong community support to drive its popularity and potential value.
The BNB Chain ecosystem has shown general support for meme coins, including CaptainBNB, as part of its broader strategy to foster community-driven projects
This chart is showing strength while developing a strong bullish pattern. I personally have been filling some bags here, as I believe BSC will do well in the coming months as Binance pushes the chain. In turn, this makes Memes and other utility projects on BSC attractive for short-term traders and long-term holders.
Target One: 518%
Target Two: 846%
Target Three: 1964%
Invalidation levels on chart.
Please leave a boost if you find this helpful, And follow for more.
Is Rich Quack ($QUACK) Dead? A Deep DiveRich Quack ($QUACK), a Binance Smart Chain (BSC) memecoin, has been the subject of intense speculation and debate. After its meteoric rise of 1182% in November 2021, the token has seen a steep decline, losing about 92% of its value over the past two years. This downturn has led many traders and investors to question its viability. However, history often repeats itself in the volatile crypto market, and $QUACK could be gearing up for a major resurgence.
About Rich Quack
Rich Quack is a community-driven memecoin launched in 2021, boasting over 149,000 holders globally. Its ethos is rooted in making crypto fun, accessible, and rewarding. While its name satirizes the "get-rich-quick" mentality, the project emphasizes hard work, innovation, and community-driven efforts as the true paths to wealth creation.
What began as a humorous token has evolved into a dynamic ecosystem aimed at empowering individuals through collective action. Rich Quack’s mission is to flip the script on traditional wealth creation by combining financial education, humor, and an engaged community.
Key Metrics**
- Market Cap: $34.9 million (Ranked #1029 on CoinGecko)
- Fully Diluted Valuation (FDV): $78.7 million
- Circulating Supply: 44 Quadrillion tokens
- All-Time High: $0.0000000071546 (November 7, 2021)
- All-Time Low: $0.0000000000101202 (October 6, 2021)
- Daily Trading Volume: $649,272 (a 30.20% decrease over the last 24 hours)
Rich Quack’s trading volume and market activity suggest waning interest. However, its large holder base and low current valuation make it a prime candidate for speculative rallies.
Technical Analysis
At the time of writing, $QUACK is trading within a weaker consolidation trend, down 0.5% on the day. The price is approaching a critical support zone near its one-month low. This level could serve as a significant buy zone, attracting traders and investors looking for potential breakout opportunities.
Key Technical Indicators
1. Support Level: Just beneath the one-month low, acting as a safety net for buyers.
2. Resistance Level: Near-term resistance lies within the upper consolidation range, which could act as a hurdle during upward momentum.
3. Trend Pattern: Currently, $QUACK is in a weaker consolidation trend, but a breakout could trigger a rally.
The absence of extreme selling pressure indicates that the token might stabilize soon. For traders, this presents a low-risk entry point with potential high rewards if the market turns bullish.
Potential Catalysts
1. Major Exchange Listings: Securing a listing on Binance or Coinbase could exponentially increase $QUACK’s trading volume and market cap.
2. Community Engagement: With over 149,000 holders, Rich Quack’s active community can drive organic growth and market activity.
3. Market Sentiment: A shift in the broader market’s sentiment toward BSC memecoins could reignite interest in $QUACK.
Conclusion
Rich Quack’s journey from a satirical memecoin to a community-driven ecosystem showcases its resilience and adaptability. Despite its significant decline from the 2021 highs, $QUACK remains a contender for future rallies. Its strong community, innovative approach, and untapped potential in major exchange listings position it as a token to watch.
While the current market conditions suggest caution, the adage “every fall must surely rise” holds weight in the crypto world. For traders and investors willing to take a calculated risk, $QUACK offers an intriguing opportunity for potential gains.

is BNB the next TRXTron has been a major overperformer with catching a niche in the growing stablecoin market. While BNB has been losing market share both in its chain and with its exchange.. BNB does still look strong. It does still share an ongoing fractal with TRX. It does look like relative to its weaker performance itll grow.
I suspect TRX will pull BNB into a breakout of highs. Whether itll lead to gains as great as TRX Im not sure. Im not sure if BNB is the best risk reward but I do think BNB could follow TRX soon with not much relative to market risk.

TradeCityPro | XVS & Bitcoin : Key Levels and Insights👋Welcome to TradeCityPro!
In this analysis, I want to review XVS for you. This token is the native token of the Venus project, which operates on the BSC network and specializes in the DeFi sector. It boasts the highest TVL on this network. This platform allows users to collateralize their assets and borrow funds proportionate to their collateral. Currently, the platform's TVL stands at $1.8 billion, and XVS ranks 361 on CoinMarketCap.
👑 Before analyzing XVS, it's better to take a look at Bitcoin to better understand the market conditions. The Bitcoin analysis is done on the 4-hour timeframe.
⏳ 4-Hour Timeframe: Correction Phase in Bitcoin
On the 4-hour timeframe, after breaking the $72,771 resistance (the previous ATH), we witnessed a very sharp, high-momentum move up to $99,022. Currently, Bitcoin has entered a correction phase. The first significant support in this timeframe is $92,004, which overlaps with the 0.236 Fibonacci level. The price has already reached this level. At the same time, the SMA99 has also aligned with the candles in this area, turning this level into a very strong PRZ.
✨ The RSI oscillator has triggered divergence, exiting the lower Bollinger Band several times, which has eliminated the bullish momentum. However, the most important thing in a bullish market is that when the RSI approaches the 30 level, it often represents a good buying opportunity. Using the Bollinger Band indicator, we can better determine trend reversals and RSI triggers. However, all of these require price confirmation, which can be achieved through Dow Theory rules or short-term resistance breakouts.
📊 On the other hand, the volume of corrective candles is increasing, which is not a good sign for the correction's end and makes the bearish scenario more likely.
🔑 If the $92,004 support breaks, the next key support is $86,841, which aligns with the 0.382 Fibonacci level and is likely to serve as a major support during this correction. For now, I won't discuss other supports; if $86,841 is broken, I'll determine the rest later.
✅ XVS Analysis: Weekly and Daily Timeframes
📅 Weekly Timeframe: Long-Term Box
On this timeframe, the price previously formed a long-term box between $3.17 and $9.19. After breaking this range, a new box was formed between $5.29 and $17.43, where the price currently trades in the lower half of the box and is struggling with resistance at $9.19.
🔼 The previous weekly candle was very strong and powerful but couldn't break the $9.19 level. The current candle is also rejecting from this level. For spot buying, breaking this resistance or $17.43 is suitable. The potential targets are $40.22 and $140.26, with $140.26 being the ATH for this coin.
📉 In case of a drop, the first support is at $5.29, and on the RSI, there is a significant support level at 39.32, which can prevent a price decline. If this support is broken, the next level is $3.17, the all-time low for this coin.
📅 Daily Timeframe: Strong Resistance Zone
On the daily timeframe, the $9.19 resistance can be drawn as a range between $8.18 and $8.91, which is very important. Currently, the price is rejecting from $8.91 and has dropped to $8.18.
🔍 The main and significant support on this chart is the ascending trendline, which previously experienced a false breakout. If the price stabilizes below $8.18, the next corrective target will be reaching this trendline.
💣 If the trendline breaks, the next support is $5.98, which is a strong resistance since the market previously reversed from this level after a false trendline breakout and reached the $8.91 high.
🧩 If the RSI stabilizes above 66.27, the price can start pumping because it has already hit this level twice and been rejected. If the RSI breaks below 50, bearish momentum will enter the market, and the bearish scenario will strengthen.
📝 Final Thoughts
This analysis reflects our opinions and is not financial advice.
Share your thoughts in the comments, and don’t forget to share this analysis with your friends! ❤️

@MAGAMemecoin $TRUMP Timeline of EventsA timeline of major and minor events that have happened since the launch of the MAGA meme coin last year. Will be continually updated as new events happen.

#UNFIUSDT #4h (ByBit) Rising wedge near breakdownUnifi Protocol printed an evening star and seems about to lost 200MA support, let's try a short.
⚡️⚡️ #UNFI/USDT ⚡️⚡️
Exchanges: ByBit USDT
Signal Type: Regular (Short)
Leverage: Isolated (5.0X)
Amount: 5.1%
Current Price:
4.5160
Entry Targets:
1) 4.5045
Take-Profit Targets:
1) 3.803
Stop Targets:
1) 4.856
Published By: @Zblaba
NYSE:UNFI BYBIT:UNFIUSDT.P #Unifi #DAO unifiprotocol.com
Risk/Reward= 1:2.0
Expected Profit= +77.9%
Possible Loss= -39.0%
Estimated Gaintime= 1 week

VENUS $XVS forming a inverse head & shoulders heading to $100?This could be a leverage position on #BNB as that hits all time highs
as it is part of that ecosystem along with
#Floki
#CAKE
#AI
#ID
#WHY
&
#BEL
as major dapps on BSC
Let's see if it can crush the neckline

$BNB 's Bart Head PatternA very nice chart of #bnb #binance coin for the tutorial of Bart Head Pattern aiming orange box. Crushing 700 #usd is invalidation. Not financial advice.

#GAMEFI is a winning Crypto category along with #AI & #MEMESTherefore will produce the best returns
(along with #DEFI again)
To simplify investing
how do we take advantage of #CZ being forced to step down, fined, publicly flogged
His crime running the best crypto business in history.
Invest in a #BSC project that could 10X in rapid fashion
Got the best ticker
on CZ's public blockchain
and can be bought with a DEX on pancakeswap
***** I just found this , and I am ignoring the rapid price runup
this is not the time to be looking for DEEP pullbacks

PANCAKESWAP #CAKE Bull Flag pointing to ~ $7Cake is the yield farming incentive token and major LP pair on Pancakeswap
And was a major winner in the last cycle
People were buying Rolex's off cake rewards from pools alone!
So it's bear market is clearly over.
And the chart appears a #DEFI season is upon us.
Current price action suggests a Bull flag.
Entry points matter - but bull markets correct mistakes if you are long.
Good luck to all.

SXP --- Looking GoodAnother example of how to buy and sell an altcoin.
We gotta be diligent on our selling plans.
you can wait for the trendline to break
or add to positions on any further weakness.

BNB Heading to $450 NextBNB has escaped its slump on the third attempt. It's now heading to $450 and there's nothing you can do to stop it.
NFA!

#TWT/BTC 12h (Binance) Falling wedge breakout and retestTrust Wallet Token pulled back to support and entered oversold territory in sats, looks like a great reward opportunity for a bounce towards 200MA daily.
⚡️⚡️ #TWT/BTC ⚡️⚡️
Exchanges: Binance
Signal Type: Regular (Long)
Amount: 9.2%
Current Price:
0.00002342
Entry Targets:
1) 0.00002335
Take-Profit Targets:
1) 0.00003096
Stop Targets:
1) 0.00002081
Published By: @Zblaba
$TWT BINANCE:TWTBTC #TrustWallet #BSC trustwallet.com
Risk/Reward= 1:3.0
Expected Profit= +32.6%
Possible Loss= -10.9%
Estimated Gaintime= 1 month

$TRX/BTC 1W (#Binance) Falling broadening wedge retestTron printed a bullish hammer on 200MA weekly support, looks like a golden opportunity!
⚡️⚡️ #TRX/BTC ⚡️⚡️
Exchanges: KuCoin, Binance
Signal Type: Regular (Long)
Amount: 4.5%
Current Price:
0.00000233
Entry Targets:
1) 0.00000223
Take-Profit Targets:
1) 0.00000348
Stop Targets:
1) 0.00000173
Published By: @Zblaba
$TRX #TRXBTC #Tron #DPos #SmartContract
Risk/Reward= 1:2.5
Expected Profit= +56.1%
Possible Loss= -22.4%
Estimated Gaintime= 9-10 months
tron.network
