XRPUSDT - Hunting for liquidity before the fallBINANCE:XRPUSDT looks very weak, losing 69% from its high. As part of the downtrend, the coin may experience sharp local spikes in search of liquidity before falling.
Bitcoin is consolidating below 70K without the ability to break through the key level. The market is stagnating after a sharp decline, which may continue.
After the pullback phase, an intermediate consolidation has formed with a liquidity zone of 1.4625 - 1.4886. Within the downtrend, the market may form a short squeeze in the specified zone, followed by a decline to 1.2845.
The market has confirmed two key levels, 1.4625 and 1.3850, with support tested and a weak reaction. If the market begins to contract towards support, this will only increase the chances of a further decline.
Resistance levels: 1.4625, 1.4885, 1.5300
Support levels: 1.412, 1.385, 1.2845
I do not rule out the possibility of an attempt to break the downward structure and grow, but in the current conditions, any bullish momentum can be quickly sold off. Technically, I have identified an area of interest between 1.4625 and 1.4885. There may be a false breakout, a retest of 1.3850, and a further decline
Best regards, R. Linda!
Btc!

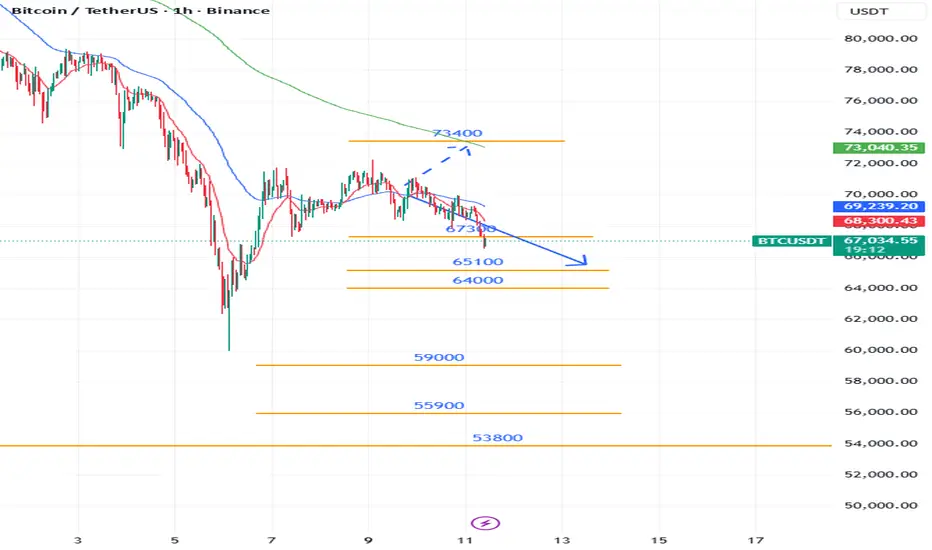
Coinranger|BTCUSDT. Continued decline🔥News
🔹Unemployment data at 16:30 UTC+3
🔥BTC
🔹Some additional information on previous days' levels:
1️⃣ Dynamic 69200 above.
2️⃣ Below, we've reached 67300, heading to 65100, then 64000.
Be careful at 16:30 UTC+3. Increased volatility is possible.
---------------
Share your thoughts in the comments!
EURGBP (1H CHART PATTERN)...EURGBP 1H chart 👀
I see a clear Head & Shoulders pattern:
Left Shoulder ✔
Head ✔
Right Shoulder forming ✔
Rising neckline (slightly upward sloping)
Bias: Bearish if neckline breaks.
🎯 Downside Targets (Measured Move)
📍 Neckline Area
Around 0.8690 – 0.8700
A confirmed break + close below this level activates the pattern.
🎯 Target 1 (conservative)
≈ 0.8660
First horizontal support
Short-term liquidity area
🎯 Target 2 (full measured move)
≈ 0.8615 – 0.8620
Height from Head → Neckline projected down
Matches my marked lower target
❌ Invalidation
Strong break and hold above 0.8730 – 0.8740
If right shoulder turns into higher high structure
Clean Summary
Activate below: 0.8690
TP1: 0.8660
TP2: 0.8620

(XAGUSD) 2H chart...(XAGUSD) 2H chart 👀
What I see
Strong prior downtrend → now recovery
Descending trendline already broken
Price reclaiming short-term support zone (~80–81)
Attempting to push back into / above Ichimoku cloud
Bullish structure forming (higher lows)
Bias: Short-term bullish continuation unless it falls back below 80.
🎯 Upside Targets
🎯 Target 1 (near resistance)
≈ 92.00 – 93.00
Prior resistance zone
Matches my first marked “target point”
Logical take-profit for partial exit
🎯 Target 2 (major resistance)
≈ 100.00 – 102.50
Strong psychological + structural level
Top of previous breakdown area
Matches my second marked target
🎯 Extension Target (if momentum strong)
≈ 107 – 110
Previous supply area
Cloud top / higher timeframe resistance
❌ Invalidation
Clean break and hold below 79.50 – 80.00
Loss of support zone (red demand area)
Clean Summary
TP1: 92–93
TP2: 100–102.5
TP3: 107+ (extension)

EURUSD Scalping/Day TradingEURUSD is consolidating. Can do some profits scalping and Day Trading and also at the break of SUPPORT looking to go SHORT.

ETHUSD 2H CHART...ETHUSD 2H chart 👀
What I see
Clear downtrend (lower highs + descending trendline)
Price below / inside bearish Ichimoku cloud
Recent breakdown from consolidation
Momentum pushing toward previous support
This favors continuation lower unless a strong reclaim happens.
🎯 Downside Targets
🎯 Target 1 (near support)
≈ 1,920 – 1,900
Recent reaction low zone
Psychological 1,900 level
Likely first bounce area
🎯 Target 2 (main structure target)
≈ 1,860 – 1,840
Previous major demand area
Matches my marked “target point” region
🎯 Target 3 (if selling accelerates)
≈ 1,780 – 1,750
Higher timeframe support
Panic / liquidation extension level
❌ Invalidation (bearish idea fails)
Strong break and hold above 2,050 – 2,080
Reclaim above descending trendline + cloud
Clean summary
TP1: 1,920–1,900
TP2: 1,860–1,840
TP3: 1,780 (extension)

GBPUSD – 2H chart...GBPUSD – 2H chart 👇
Structure shows:
Descending trendline recently broken
Strong support zone around 1.3630–1.3640
Price bouncing from support
Next clear resistance above
🎯 Upside Targets (if support holds)
Target 1: 1.3735 – 1.3750
(previous horizontal resistance)
Target 2: 1.3820 – 1.3840
(major resistance zone marked on my chart)
🔑 Invalidation
If price closes back below 1.3600, upside structure weakens and could retest lower levels.
Right now bias = bullish while above support.

BTCUSD – 2H timeframe...BTCUSD – 2H timeframe.
🔍 Structure
Clear downtrend (descending trendline respected)
Price trading below Ichimoku cloud
Currently moving toward major demand zone 63,500 – 62,000
Equal lows liquidity sitting below 64K
📉 Bearish Scenario (More probable short term)
If price breaks 64,000 cleanly:
🎯 Sell Targets:
TP1: 63,500
TP2: 62,000 (strong demand zone)
Extended: 60,000 psychological level
❌ Invalidation: 2H close above 69,500
📈 Bullish Reversal Scenario
If price taps 62K–63K and shows strong rejection:
🎯 Buy Targets:
TP1: 70,000
TP2: 72,000 (my marked supply zone)
Extended: 78,000 – 80,000 major resistance
📌 My View
Short term → downside liquidity sweep toward 62K looks likely
After that → possible bounce to 70K+

EURJPY (2H CHART PATTERN)...EURJPY (2H CHART PATTERN).
As long as price stays below 183.70–184.00, bears are in control.
🎯 Target 1: 181.80
🎯 Target 2: 181.00
🎯 Extended Target: 180.20
❌ Stop loss above 183.60
🔺 If ME are looking for BUY (support bounce trade)
Only valid if we get strong bullish confirmation candle on 2H.
🎯 Target 1: 183.70
🎯 Target 2: 185.00
🎯 Target 3: 186.00 (major resistance)
📌 Key Level to Watch:
Break below 181.80 → strong continuation down.
Strong rejection from current zone → possible retracement to 183.50–185.00.
Right now structure is bearish, so safer setup is sell on pullback unless clear reversal forms.

EURJPY (2H chart pattern)...EURJPY (2H chart pattern).
Bias: Short / Sell (price rejected from resistance & broke trendline)
📍 Sell Zone
185.20 – 185.35 (my marked sell zone)
🎯 Targets
Target 1: 183.60 – 183.70 (first demand / dashed line)
Target 2: 182.40 – 182.50 (next major support)
❌ Stop Loss
Above 186.00 (above resistance & recent high)
📌 Extra confirmation
Trendline break ✔️
Price below resistance ✔️
Ichimoku cloud acting as resistance ✔️
As long as price stays below 185.50–186.00, sells are valid.

BTCUSDT – 1D Chart Update. BTCUSDT – 1D Chart Update
BTC has broken down from the rising channel and confirmed a strong bearish move. The trend is clearly a downtrend on the daily timeframe.
Current Price: ~67.6K
Major Support: 72K–74K (now acting as resistance after breakdown)
Strong Demand Zone: 58K–60K
Immediate Resistance: 70K–72K
After a sharp -30% drop, the price is attempting a small bounce but still trading below the daily MA and breakdown level. Structure remains weak unless BTC reclaims 72K+ with a strong daily close.
Rejection from 70K–72K → continuation toward 60K zone.
Strong reclaim above 72K → short-term relief rally toward 78K–80K.
⚠️ Momentum is still bearish. Wait for confirmation before aggressive longs.

More than just the ticker (okay bet)What you think is not what you think, trust.
Why it makes sense for Bitcoin to go up is not because it should go up, but more so because it should go down, because if it were to go down, it would make sense, it would be rational, it would be reasonable within data, within facts between the context.
But what if I told you, the context is the flaw. The context is the baseline of a conversation, the point where you branch into the metacognitive executions, but if the internal model's representation is flawed, then the entire system collapses.
The laws of nature follow the path of least resistance, so does our brain, so does our consciousness. Inherently so, but the path of least resistance is not always the "right" path, when there is no right or wrong, only perspective, only observation, we fall into analysis paralysis, but to understand and grasp the truth, we must understand the meaning, the making of what everything is, at the grander scale, because we function not as abstract entities, but by potential and potential-able.
Bitcoin is whatever, but do not deny it's potential.

Bitcoin starts toward Ma200 —The age of Crypto!Notice how Ma200 is starting to curve down. Bitcoin's bottom can produce a market reaction towards this level. The market can also draw a v shaped recovery, something not seen in more than six years.
Here Ma200 matches perfectly the 0.618 Fib. retracement level. If we want to be conservative, we can use a range for our recovery rally target. This range can sit between 0.5 - 0.618 Fib.
The easy target sits at $85,323 which is the 0.382 Fib. retracement level.
The next range and main target can be $93,127 - $100,930.
Seeing Bitcoin's extreme readings on several oscillators, means it is not necessary we get a lower low in the latter part of this year.
A strong recovery can certainly support another down-wave but a lower low is not mandatory. It can easily happen but it is not "written in stone" so to speak. So we stay open to all scenarios.
Many signals coming from across the altcoins market support a full bottom already being present. Bitcoin can be different though but it is wise to keep an open mind. The market has never been this depressed before.
A bottom tends to form when market conditions and sentiment turns the worst. It will not get any worse than now.
Bitcoin's projected target for the 2025 bull market sits around $165,000 to $185,000. The actual all-time high resulted in $126,000, a big difference. This projection was made based on past history.
The same past also predicts Bitcoin producing a new major down-wave later in 2026.
Since the bull market didn't show up in its full glory and force, the bear market can also end up coming up short. The bull market was weak in comparison to past cycles, most of the action happened in 2024. The same can happen with the bear market.
Stay open to change, the Cryptocurrency market is young and will continue to evolve.
Nothing forbids Bitcoin starts now growing for months, nothing.
The future is uncertain but bright. All that was missed in 2025 will be recovered plus some more in the years to come.
Trust Bitcoin. Trust the altcoins market.
Cryptocurrency is the evolution of the Internet. Finance will never be the same.
Money is free now. Crypto means freedom. Freedom for the world and the masses. A new age. The age of Crypto.
Namaste.

Bitcoin's weekly MACD & RSI —The bottom is inBitcoin's weekly MACD just hit a new all-time low. The previous ATL happened July 2022.
The histogram hit bottom late November 2025. From this point forward, the MACD can start to recover to trend upward long-term. It will not go any lower.
BTCUSDT MACD (W):
Bitcoin's weekly RSI just hit the lowest point since June 2022, the second lowest reading ever. It is also the second time Bitcoin's weekly RSI enters oversold territory. It will start to recover to trend higher long-term. This is the bottom.
BTCUSDT RSI (W):
These are simple signals, easy to interpret. It simply means the bottom is in, or very close.
MA200 weekly matches perfectly the 0.618 Fib. retracement level in relation to the full long-term bullish cycle. The fact these extreme readings are present and a reversal is happening right above these levels signals that the bottom is in.
It is like a top but in reverse; once the bottom is in, there is no going back. We are going up long-term.
Thank you for reading.
Namaste.

Bitcoin Price Finds Acceptance in HTF Range On the higher timeframe, Bitcoin price action continues to trade within a well-defined daily trading range. A previous range has now been accepted on a daily closing basis, confirming that the market has transitioned into a broader consolidation phase rather than an immediate trend reversal. At present, price is rotating around the midpoint of this high-timeframe range, which often acts as an equilibrium zone during periods of balance.
Looking to the downside, the most important support sits near the $50,000 region. This area aligns with the 0.618 Fibonacci retracement, the 0.786 Fibonacci level, and a key prior swing low. The confluence of these technical factors increases the probability that this zone may be targeted for a liquidity sweep. Such a move would likely take out resting stops below the swing low before price attempts to stabilize.
From a market structure perspective, this suggests that a definitive bottom has likely not yet been established. Instead, Bitcoin appears to be in a reaccumulation and consolidation phase, where further range-bound trading is needed to absorb supply. If a swing-failure pattern forms at lower support, it could provide the foundation for a macro reversal and a rotational move back toward higher levels.

ETH — Price Slice. Capital Sector. 1707.41 BPC 2.5© Bolzen | The Architect | BPC Framework
Bolzen Market Institute
🏷 ETH — Price Slice. Capital Sector.
Publication date on TradingView: 11.02.2026
🏷 1707.41 — at the time of publication, the price had not been reached.
🏷 BPC — The Bolzen Price Covenant — Strength Index: 2.5
The energy block reflects the intentions of capital. The direction of capital flow is determined dynamically. The key mechanism of liquidations lies in the tendency of price to gravitate toward areas where real participants of the system are concentrated — regardless of whether they are in longs or shorts.
Such zones represent areas of asymmetric advantage: when the price approaches them, some participants are forced to close positions at a loss, others lock in profits, and a third group (institutional players) uses this flow to enter in the direction of the next concentration zone.
Institutional players generate energy blocks through miners. Subsequently, these energy blocks form the range of capital movement across various timeframes for exchange speculators. However, the ultimate goal in ensuring liquidity is to reach the energy block mark.
The results are presented in the dashboard for the international arena. It is necessary to manually determine, without third-party software, the direction of the impact node and the concentration of real system participants. This is achieved through high cognitive and intellectual effort — without templates and solely through pure chart analysis.
Three-dimensional analytics is intellectual property. The methodology is closed and does not require evaluation from the standpoint of the old world. We offer the ability to think but do not provide trading recommendations and are not educators.
We thank you and regard TradingView as an impartial platform for demonstrating the transition into a new analytical reality.
Quantum structure of obligations and capital movement in price formation within energy blocks.
🏷 Vertical chart — Energy Grid Dashboard.
🏷 Static tape No. 1: The price is published according to the production order of the energy block.
🏷 The energy block price is already ordered — not by time but by the priority of block execution. It is important not to confuse: block priorities dynamically reorganize in response to hidden energetic impulses, while the execution order of prices fixes their manifestation in the market. Each price in the dynamic tape is linked to energy production measurement indicators, unavailable to the general public. Those who see the structure before its manifestation do not follow the price — they anticipate it.
EΞ2Φ8Ψ45Θ·ζ⁻¹·106Λ732·Ω²
📎 Screenshot:
🏷 When trading from levels, use liquidation zones from BPC 10 and higher.
🏷 Bolzen Liquidity Map — ETH (numerical equivalent of the map):
Updated versions of the Bolzen Liquidity Map — ETH are in restricted access.
The permanent Energy Grid Dashboard for ETH and BTC is publicly available and intended for international institutional review.
Dear international community,
I thank the TradingView moderation for their neutrality and support of analytical work on a global scale, as well as everyone who follows my research. This platform serves as a space to demonstrate the contribution to analytical development.
Attention and time are your key resources. ATH — is emotion; timeframes — are your best allies. Thank you.
— The Architect
BPC — The Bolzen Price Covenant

ETH — Price Slice. Capital Sector. 1722.33 BPC 26© Bolzen | The Architect | BPC Framework
Bolzen Market Institute
🏷 ETH — Price Slice. Capital Sector.
Publication date on TradingView: 11.02.2026
🏷 1722.33 — at the time of publication, the price had not been reached.
🏷 BPC — The Bolzen Price Covenant — Strength Index: 26
The energy block reflects the intentions of capital. The direction of capital flow is determined dynamically. The key mechanism of liquidations lies in the tendency of price to gravitate toward areas where real participants of the system are concentrated — regardless of whether they are in longs or shorts.
Such zones represent areas of asymmetric advantage: when the price approaches them, some participants are forced to close positions at a loss, others lock in profits, and a third group (institutional players) uses this flow to enter in the direction of the next concentration zone.
Institutional players generate energy blocks through miners. Subsequently, these energy blocks form the range of capital movement across various timeframes for exchange speculators. However, the ultimate goal in ensuring liquidity is to reach the energy block mark.
The results are presented in the dashboard for the international arena. It is necessary to manually determine, without third-party software, the direction of the impact node and the concentration of real system participants. This is achieved through high cognitive and intellectual effort — without templates and solely through pure chart analysis.
Three-dimensional analytics is intellectual property. The methodology is closed and does not require evaluation from the standpoint of the old world. We offer the ability to think but do not provide trading recommendations and are not educators.
We thank you and regard TradingView as an impartial platform for demonstrating the transition into a new analytical reality.
Quantum structure of obligations and capital movement in price formation within energy blocks.
🏷 Vertical chart — Energy Grid Dashboard.
🏷 Static tape No. 1: The price is published according to the production order of the energy block.
🏷 The energy block price is already ordered — not by time but by the priority of block execution. It is important not to confuse: block priorities dynamically reorganize in response to hidden energetic impulses, while the execution order of prices fixes their manifestation in the market. Each price in the dynamic tape is linked to energy production measurement indicators, unavailable to the general public. Those who see the structure before its manifestation do not follow the price — they anticipate it.
EΞ2Φ8Ψ45Θ·ζ⁻¹·106Λ732·Ω²
📎 Screenshot:
🏷 When trading from levels, use liquidation zones from BPC 10 and higher.
🏷 Bolzen Liquidity Map — ETH (numerical equivalent of the map):
Updated versions of the Bolzen Liquidity Map — ETH are in restricted access.
The permanent Energy Grid Dashboard for ETH and BTC is publicly available and intended for international institutional review.
Dear international community,
I thank the TradingView moderation for their neutrality and support of analytical work on a global scale, as well as everyone who follows my research. This platform serves as a space to demonstrate the contribution to analytical development.
Attention and time are your key resources. ATH — is emotion; timeframes — are your best allies. Thank you.
— The Architect
BPC — The Bolzen Price Covenant

Bolzen Liquidity Map — ETH Bolzen Liquidity Map — ETH
27.12.2025
Liquidity Map in Numerical Form
Treat the listed levels as entry nodes. All zones are certified under the Bolzen Price Covenant (BPC) ≥ 10, confirming their status as structural power nodes. These levels remain valid as of the current Execution Tithe . As new prices emerge with BPC ≥ 10, adjust your framework accordingly. This is not advice—it is documented capital geometry.
7487.31
7277.98
6604.21
5966.99
5480.04
5191.51
4983.63
4788.86
4601.91
4416.95
4246.36
4076.69
3912.98
3752.38
3602.94
3460.38
3315.85
3187.98
3059.80
2936.75
2820.76
2723.11
2618.94
2322.14
2246.54
2172.83
2086.43
2004.65
1927.44
1876.05
🏷 I. Interactive Reference Guide: BPC — The Bolzen Price Covenant
🏷 P.S. English is not my native language — I offer no apologies for stylistic imperfections. What you see here is not a post. It is a demonstration of another level of preparation: the symbiosis of human intuition and algorithmic precision. Mathematics and aggressive market analysis — against the machine of liquidations.
The Architect
BPC — The Bolzen Price Covenant

ETH — Price Slice. Capital Sector. 1680.23 BPC 16© Bolzen | The Architect | BPC Framework
Bolzen Market Institute
🏷 ETH — Price Slice. Capital Sector.
Publication date on TradingView: 11.02.2026
🏷 1680.23 — at the time of publication, the price had not been reached.
🏷 BPC — The Bolzen Price Covenant — Strength Index: 16
The energy block reflects the intentions of capital. The direction of capital flow is determined dynamically. The key mechanism of liquidations lies in the tendency of price to gravitate toward areas where real participants of the system are concentrated — regardless of whether they are in longs or shorts.
Such zones represent areas of asymmetric advantage: when the price approaches them, some participants are forced to close positions at a loss, others lock in profits, and a third group (institutional players) uses this flow to enter in the direction of the next concentration zone.
Institutional players generate energy blocks through miners. Subsequently, these energy blocks form the range of capital movement across various timeframes for exchange speculators. However, the ultimate goal in ensuring liquidity is to reach the energy block mark.
The results are presented in the dashboard for the international arena. It is necessary to manually determine, without third-party software, the direction of the impact node and the concentration of real system participants. This is achieved through high cognitive and intellectual effort — without templates and solely through pure chart analysis.
Three-dimensional analytics is intellectual property. The methodology is closed and does not require evaluation from the standpoint of the old world. We offer the ability to think but do not provide trading recommendations and are not educators.
We thank you and regard TradingView as an impartial platform for demonstrating the transition into a new analytical reality.
Quantum structure of obligations and capital movement in price formation within energy blocks.
🏷 Vertical chart — Energy Grid Dashboard.
🏷 Static tape No. 1: The price is published according to the production order of the energy block.
🏷 The energy block price is already ordered — not by time but by the priority of block execution. It is important not to confuse: block priorities dynamically reorganize in response to hidden energetic impulses, while the execution order of prices fixes their manifestation in the market. Each price in the dynamic tape is linked to energy production measurement indicators, unavailable to the general public. Those who see the structure before its manifestation do not follow the price — they anticipate it.
EΞ2Φ8Ψ45Θ·ζ⁻¹·106Λ732·Ω²
📎 Screenshot:
🏷 When trading from levels, use liquidation zones from BPC 10 and higher.
🏷 Bolzen Liquidity Map — ETH (numerical equivalent of the map):
Updated versions of the Bolzen Liquidity Map — ETH are in restricted access.
The permanent Energy Grid Dashboard for ETH and BTC is publicly available and intended for international institutional review.
Dear international community,
I thank the TradingView moderation for their neutrality and support of analytical work on a global scale, as well as everyone who follows my research. This platform serves as a space to demonstrate the contribution to analytical development.
Attention and time are your key resources. ATH — is emotion; timeframes — are your best allies. Thank you.
— The Architect
BPC — The Bolzen Price Covenant

BITCOIN - LONG - Value Holds While Leverage PanicsBitcoin 4H Analysis
Price is currently trading inside the Point of Control of the Jan 14 impulse up. This is a high participation area where both buyers and sellers have done the most business, making it a key decision zone.
As long as we hold this PoC, the market is accepting value. A clean acceptance and breakout from this range opens continuation toward Target 1 at ~80k (Zone 1), followed by Target 2 at ~92.5k (Zone 2), both aligned with higher timeframe liquidity and fib-based resistance clusters.
Order flow perspective
Spot CVD is showing a clear bullish divergence. While price went sideways to slightly lower, spot buyers continued to step in. This signals real demand absorbing sell pressure rather than chasing price.
Stablecoin-margined futures CVD remains firmly negative. Perp traders are still selling and pressing shorts without downside expansion. Coin-margined futures CVD confirms the same behavior, showing leverage positioned defensively.
Open interest across both stablecoin and coin-margined contracts continues to bleed. This suggests leverage is being flushed rather than new risk being added, which supports a basing structure.
Accumulation / Distribution
The A/D indicator is turning up after a sharp downside sweep. Despite the volatility, accumulation is increasing, which confirms that smart money is absorbing supply during consolidation rather than distributing into strength.
Coinbase spot flow
Coinbase Spot CVD is trending hard up. Large spot participants are aggressively accumulating while derivatives remain skewed short. This divergence historically favors upside resolution once price exits value.
Summary
We are trading at value. Spot is leading, accumulation is increasing, leverage is leaning the wrong way, and acceptance above the PoC sets the stage for continuation into ~80k first, then ~92.5k. Until value is lost, downside looks corrective rather than impulsive.

The Breaker Block Explained : REVERSE OB The Breaker Block Strategy: Turning Failed Orders Into New Opportunities
In trading, we are often taught that "old resistance becomes new support." A Breaker Block is the institutional version of this concept. It occurs when a specific order block—a zone where big banks previously transacted—fails to hold price, gets completely overrun, and is then "flipped" to be used in the opposite direction.
Why do traders pay such close attention to this? Because it represents a Change in State of Delivery. When an order block is violated, it signals that the opposing side (buyers or sellers) has taken control, and the "failed" zone often becomes a high-probability entry point for a reversal.
What Exactly is a Breaker Block?
At its core, a breaker block is a failed Order Block that the market respects after breaking through it.
In Smart Money Concepts (SMC), price delivery is driven by liquidity. Often, the market will push price above an old high (to grab buy-side liquidity) or below an old low (to grab sell-side liquidity) before reversing. During this reversal, price will smash through the Order Block that caused that liquidity grab.
Once that Order Block is broken, it becomes a Breaker.
* Before the break: It was a zone where price was expected to reverse.
* After the break: It becomes a "flipped" level where traders wait for price to return and react.
"Breaker Blocks often align with the overall trend, signaling potential reversals or significant price shifts." — Michael J. Huddleston (ICT)
The Two Types: Bullish and Bearish
Understanding the difference between the two is critical for identifying trend direction.
1. Bearish Breaker Block
A bearish breaker typically forms during a trend reversal from bullish to bearish.
* The Setup: Price makes a Higher High (sweeping liquidity from the previous high). The move up comes from a specific bullish candle (the Order Block).
* The Break: Immediately after grabbing that high, price reverses aggressively and crashes down through that bullish Order Block.
* The Trigger: That broken bullish candle is now your Bearish Breaker. When price rallies back up to test this level, traders look to sell, anticipating that the old support will act as new resistance.
2. Bullish Breaker Block
A bullish breaker forms during a reversal from bearish to bullish.
* The Setup: Price makes a Lower Low (sweeping liquidity from the previous low). This drop originates from a specific bearish candle (the Order Block).
* The Break: Price reverses and surges up through that bearish Order Block.
* The Trigger: That broken bearish candle becomes your Bullish Breaker. Traders wait for price to drop back into this zone to buy, expecting it to hold as support.
Breaker Block vs. Mitigation Block vs. Order Block
These three terms confuse many traders, but the difference lies in Liquidity and Failure.
Order Block: A zone where price originated a strong move. It holds on the first test.
Breaker Block: A failed Order Block that breaks *after* taking out a High or Low. (Crucial Difference: It swept liquidity)
Mitigation Block: A failed Order Block that breaks *without* taking out a High or Low.
If the price makes a Lower Low and then breaks up, it's a Breaker. If it fails to make a Lower Low and breaks up, it's a Mitigation Block. Breakers are generally considered higher probability because the liquidity sweep confirms that "Smart Money" has already engaged.
How to Identify High-Probability Breakers
Not every broken candle is a tradeable breaker. The best setups share specific characteristics that you can spot on a chart:
1. The Liquidity Sweep: Look for price to take out a Swing High or Swing Low immediately before the break. This "Stop Hunt" is the engine that powers the reversal.
2. Displacement: The break through the Order Block shouldn't be lazy. You want to see a large, energetic candle that closes decisively past the level. If price just wicks through it, the breaker is weak.
3. The Retest: Patience is key. You are not chasing the breakout candle. You are waiting for price to "breathe" and return to the crime scene (the breaker block) to get your entry.
Trading Strategy: The Entry & Risk Management
When you spot a valid breaker, the execution should be systematic.
* The Entry: Place your entry at the beginning (proximal line) of the breaker block candle body. Some traders prefer the 50% level of the block for a more refined entry, though you risk missing the trade.
* The Stop Loss: Your invalidation point is usually the High (for bearish) or Low (for bullish) of the breaker candle itself. If price completely engulfs the breaker again, the setup has failed.
* The Target: Aim for the opposing liquidity. If you enter a Bullish Breaker, target the nearest Swing High where short sellers have their stops.
The "Unicorn" Setup
For higher accuracy, look for a Fair Value Gap (FVG) that overlaps with your Breaker Block. When a Breaker and an FVG align at the same price level, ICT traders call this a "Unicorn Model," and it is considered one of the highest-probability entry signals in price action trading.
Conclusion
Breaker Blocks are a powerful tool because they use the market's failure against itself. They allow you to enter a trade exactly when trapped traders are trying to exit theirs.
Remember, the goal isn't to predict every move but to react to clear changes in state. When an Order Block fails after a liquidity grab, don't view it as a broken level—view it as a new opportunity.
-TUFFYCALLS (TEAM MUBITE)

BTC SHORT-TERMEXIT FROM THE CHANNEL POSSIBLE T1, T2
Remember to secure your SL
This is not investment advice

STRK – Down 57% From Jan High | Key Levels AheadSTRK has pulled back 57% from its January high, showing clear bearish momentum. Price is approaching key zones that could attract bulls — or trigger further breakdowns.
🔻 Support Zones
$0.0463 – A critical confluence zone:
Rejection point on Feb 5
Midpoint of last week’s long tail
May act as support ahead of Sunday's token unlock, which increases circulating supply.
$0.0410 – If $0.0463 fails, bulls’ stops lie here (Feb 6 low).
$0.0400 – Psychological level; no strong structure below but could trigger a short-term bounce.
🔺 Resistance Zones
$0.0534–$0.0549 – Initial supply zone:
Created by Feb 5 bearish candle void
Distribution zone on Feb 2
$0.0597 – Feb 3 swing high. Break above may trigger stop runs.
$0.0618 / $0.0639 / $0.0659 – Layered bearish voids from late January. Expect increased selling pressure here.
⚠️ Outlook
Bearish short-term trend
Watch how price reacts at $0.0463
Sunday’s token unlock could be a volatility catalyst
Bulls need to reclaim $0.0549+ to shift momentum
📌 Levels in Focus
Support: $0.0463 → $0.0410 → $0.0400
Resistance: $0.0534 → $0.0549 → $0.0597 → $0.0618–$0.0659
