PUMP Breakout Alert!🚨 NYSE:PUMP Breakout Alert! 🚨
NYSE:PUMP is currently testing the red resistance zone 🔴
At the same time, it has formed a bullish Double Bottom pattern ✅
If price breaks out, the first target will be the green line level 🎯
This setup could confirm strong bullish continuation if buyers hold momentum.
Btc!

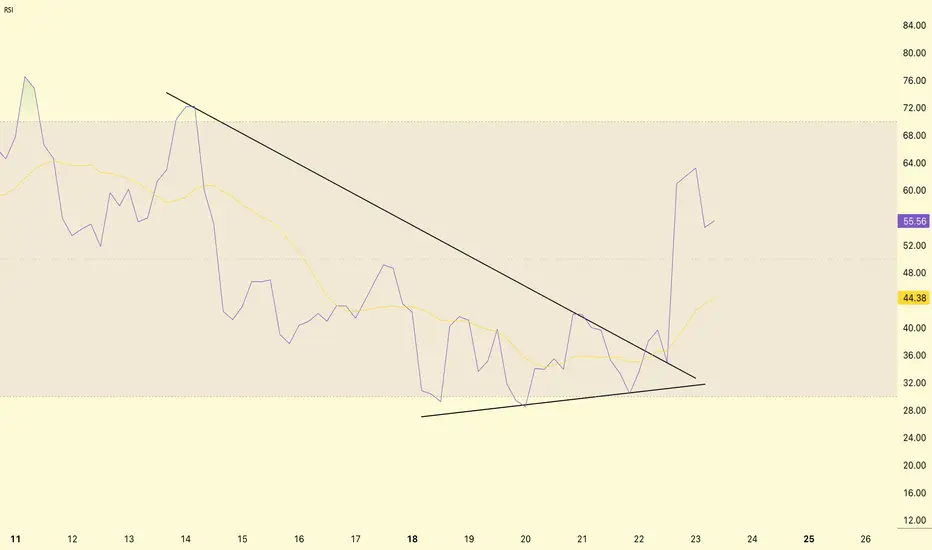
BTC/USDT RSI Analysis !!BTC/USDT RSI Analysis
RSI (Relative Strength Index) breakout analysis.
Descending wedge in RSI
From August 11 to August 22, RSI was forming a descending wedge pattern (lower high, higher low).
This is usually a bullish reversal setup.
RSI breakout
RSI broke out of the bullish wedge on August 22 → rose from ~30 to ~65.
Current RSI = 55.97 → from neutral to bullish territory.
Moving average (yellow line) = 44.41, which means RSI is above the trend, indicating positive momentum.
RSI breakout confirms strong buying interest.
This could mean that BTC has completed its short-term correction phase and is ready for another rise.
DYOR | NFA
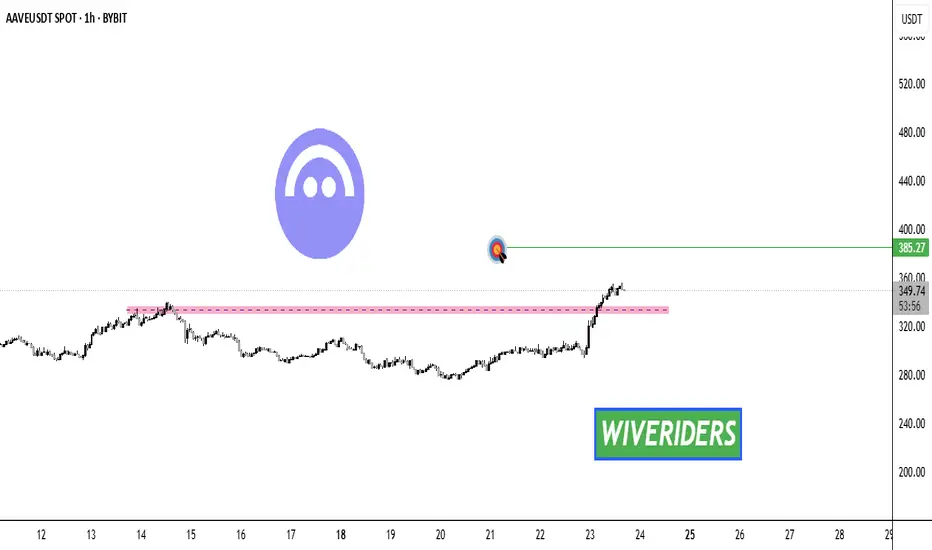
AAVE Breakout Alert! 🚨 CRYPTOCAP:AAVE Breakout Alert! 🚨
CRYPTOCAP:AAVE has broken out of the red resistance zone 🔴✅
The first target is the green line level 🎯
This breakout confirms bullish momentum and could drive further upside if buyers maintain control 💪
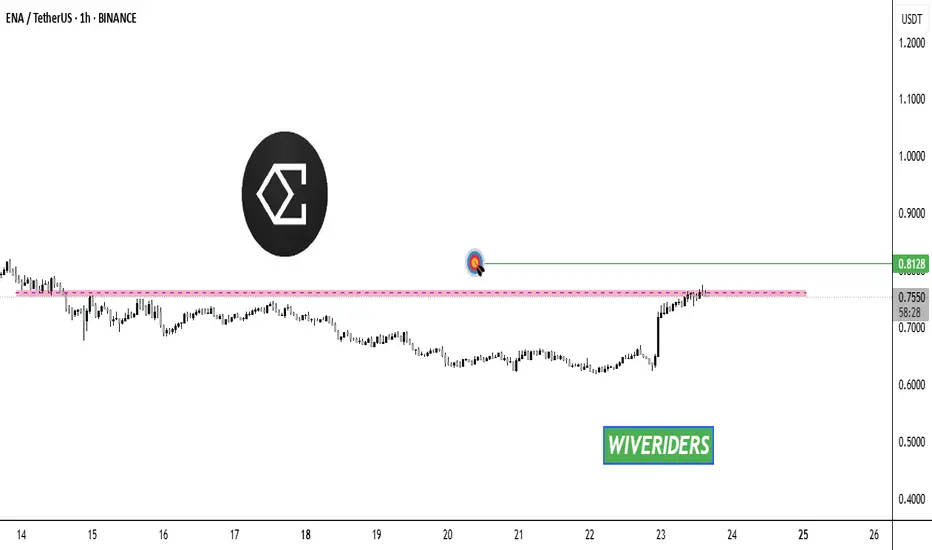
ENA Breakout Alert!🚨 MIL:ENA Breakout Alert! 🚨
MIL:ENA is currently testing the red resistance zone 🔴
If price breaks out, the first target will be the green line level 🎯
A confirmed breakout here would signal bullish continuation and could fuel further upside ✅
ARB Breakout Alert! 🚨 AMEX:ARB Breakout Alert! 🚨
AMEX:ARB is currently testing the red resistance zone 🔴
If price breaks out, the first target will be the green line level 🎯
A confirmed breakout here would signal bullish continuation and could push price higher ✅

112K THE POWER RETURN OR THE END OF CYCLE? - BTC now still GREENBTC is currently at a critical point. From a cycle perspective, we are at the bottom of the cycle—a zone where major whales can decide whether to continue the cycle or bring it to an end.
When BTC just slips below 112K it does not directly end the cycle; it need also provides time frame confirmation of at least 4H+ There is high chance BTC can return from 112k zone.
If BTC holds its levels and rises above 112K with confirmation, we could the strong cycle.
If BTC breaks down further below 12K–10K, it would signal the end of the cycle that started around 84K.
At this moment BTC is still long for the cycle
Momentframe by 112K /110K = END CYCLE
Low time frame BTC = RED
High frame time BTC = RED
Cycle frame time BTC = GREEN

Bitcoin Bullish & $137,000 in August 2025 —Top Altcoins ChoiceOk, many not August 2025 but the rise starts this same month...
What I am trying to say is that Bitcoin is bullish now and will continue growing immediately. By late August Bitcoin will be green and the entire altcoins market is already turning green. The retrace is what you are seeing now. The retrace is no big deal because there was a jump before the move was deployed.
Bitcoin moved to $125,000 and then dropped. This happens to strengthens support. Notice how $112,000 remains unchallenged. If Bitcoin produced a drop without moving to 125,000 that would be a different story.
Bitcoin is bullish because prices are not trading at $110,000 or lower. The fact that the action is happening above $112,000 confirms a very strong bullish bias on all timeframes and based on all charting systems. The Bitcoin bull!
Simplicity. Above $112,000 we win. Above $100,000 bullish long-term.
Above $110,000 bullish mid-term.
The amount of noise we have so far reveals plenty. Bearish volume was high but not high enough. Ethereum was hit but not strong enough. The smaller altcoins are showing no signs of lower lows. This will be a stop that will only last a few more days.
What about the altcoins? —Top Altcoins Choice
With the market shaking I want to know what is going to happen with my holdings, each trading pair is different. Has the chart been compromised?
Share a comment with your favorite trading pair and I will do an analysis for you.
Your support is highly appreciated.
👉 If you enjoy the content follow.
The bull market is not over.
Bitcoin will continue rising.
The altcoins will continue rising.
We know we are bullish based on hundreds of charts.
The best is yet to come.
Namaste.

THE NEO CYCLE CAN BREAK TO $12-$26 N3 Blockchain comingThe NEO cycle is starting to confirm in this zone, but we are waiting for a second confirmation. If the cycle is confirmed, we could see a new high around $12, with the potential to reach a top target of $26.
NEO is showing an A-level setup, though it may take time to fully build. This is shaping up to be a swing trade, so it should be monitored closely, step by step.
Some exchange data show interesting views about NEW and the building of volume
TA shows possibilities for a new break.

ETC Breakout Alert!🚨 BME:ETC Breakout Alert! 🚨
BME:ETC is currently testing the red resistance zone 🔴
If price breaks out, the first target will be the green line level 🎯
A confirmed breakout here would signal bullish continuation and could push price higher ✅

SPX Breakout Alert!🚨 SPX Breakout Alert! 🚨
SP:SPX is currently testing the red resistance zone 🔴
If price breaks out, the first target will be the green line level 🎯
A confirmed breakout here would signal bullish continuation and could drive further upside ✅

Bitcoin · A Beautiful Sight · $200,000 Cancelled?Hello my dear friend,
Yesterday Bitcoin managed to close below a bunch of moving averages and people started to freak out; What is happening? Is this the end? The world was wondering. Many succeeded in missing the previous all-time high and EMA89 as support, a price tag of $112,000.
Today, the bullish bias is confirmed; support holds.
Bitcoin ignored testing the lower boundary of the sideways range, $100,000-$110,000, and remains really strong. People are saying that yes, it is possible now; Bitcoin can hit $155,000 in the coming months.
Trading volume is rising. With rising volume and this strong momentum we can expect additional growth. Yesterday Bitcoin was trading below EMA55, EMA34, EMA21, EMA13 and EMA8. Today, Bitcoin is recovering nicely above all these levels; a higher high comes next.
Why a higher high and not a lower high or confirmation of resistance?
Since the retrace is ending early, fast and at a high price, we know the bulls are strong; sellers are weak. Nobody is trying to get rid of their Bitcoins while many are trying to accumulate as much as possible. Bitcoin's supply is finite and will become less and less accessible; just one of the many reasons why prices will continue to grow.
Bitcoin is digital gold. A store of value.
Money for the future. Digital cash.
Thanks a lot for your continued support.
Namaste.

BITCOIN Local Short! Sell!
Hello,Traders!
BITCOIN made a bullish
Rebound from the horizontal
Support of 111k just as
I predicted in my previous
Analysis but now the coin
Is retesting a local resistance
From where we will be expecting
A local bearish correction
Sell!
Comment and subscribe to help us grow!
Check out other forecasts below too!
Disclosure: I am part of Trade Nation's Influencer program and receive a monthly fee for using their TradingView charts in my analysis.

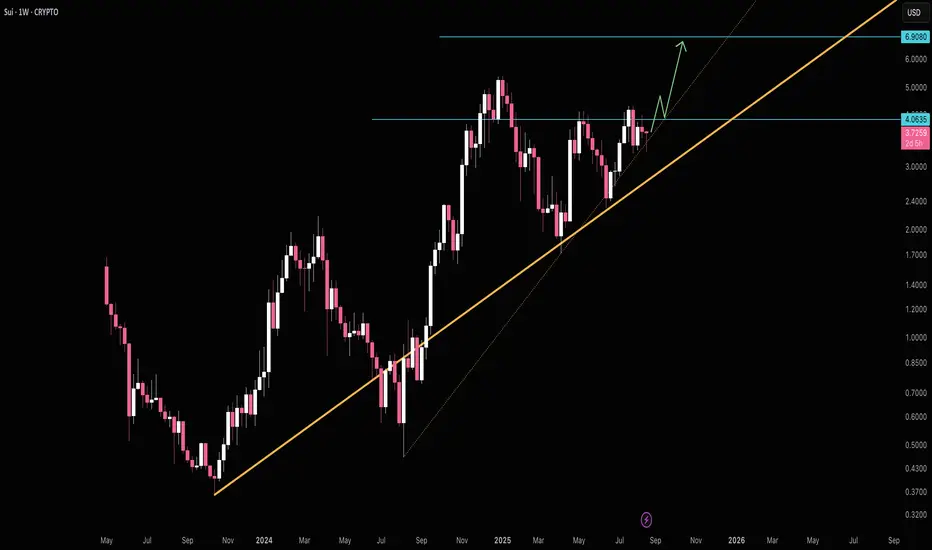
SUI to $6.9SUI's riding the uptrend up to breaking $4 resistance. $6.90 is next major resistance.
Good luck!
Bitcoin · $200,000 Confirmed —Ether Hits New All-Time HighThe Bitcoin bears lost the battle; Bitcoin is now set to hit a new all-time high. The bullish bias is confirmed.
This week started bad and red. Red because of lower prices and bad because last week closed as an inverted hammer, perfect bearish signal. This hammer was supported by another rejection just three weeks further back. And so, Bitcoin was looking bearish but not for long.
This same week now has a long lower wick, boom! Prices are recovering strong.
BTCUSDT moved down and tested EMA13 (orange) as support. It moved below EMA8 (red) for a few days and never reached EMA21 (yellow). Bitcoin's current price is trading safely above EMA8 ($115,288).
The week recovered all loses and is now trading almost at the top of the session. This is ultra-bullish and can result in a DragonFly Doji. Bitcoin closing at current price or higher, confirms the bulls are in. Once the bulls are in and confirmed, something we predicted already using the altcoins, we know we will get a higher high next. A higher high needs resistance and that's $137,000 short-term. Mid-term $155,600 and beyond $200,000 long-term.
Thank you for reading.
Namaste.

Has Altcoin rally begun?A long-term support trend-line on Bitcoin dominance has just broken. This suggests BTC dominance may decline , which often shifts liquidity toward Altcoins. If confirmed in weekly time frame, we could see stronger moves across the Altcoin market.
Disclaimer: This is not financial advice. Just sharing my market view.

BTC Bulls Make a Stand at Key Demand Zone | Is a Reversal ImmineChart: BTCUSDT, 1H
Bias: Neutral to Short-Term Bullish
Analysis:
Hello, traders! Here's a look at the current BTCUSDT price action, which finds itself at a critical juncture.
The Bearish Context (Macro):
For the past several days, Bitcoin has been in a clear and structured downtrend. This is confirmed by:
A strong rejection from the "Perfect Sell Zone 1" around the $122,000 - $120,000 level.
A series of lower lows and lower highs.
Multiple breaks of structure (marked as "Strong" lows being broken) to the downside, confirming bearish momentum is in control.
The Bullish Reaction (Micro):
Despite the strong bearish trend, the price has now entered a significant "Perfect Buy Zone 1" between approximately $111,500 and $108,500. We are seeing a very aggressive reaction from this area:
A massive bullish engulfing candle has formed, showing that buyers have stepped in with force.
This push has resulted in a minor break of structure to the upside (the latest "Break" label), which could be interpreted as a Change of Character (CHoCH). This is the first potential sign that the short-term bearish momentum is weakening.
Potential Scenarios & Key Levels :
Bullish Reversal / Pullback: If the bulls maintain control, the immediate target would be the previous support levels, which may now act as resistance.
TP 1: $114,400 (Fibonacci 0.786 level)
TP 2: $115,700 (Recent consolidation area)
TP 3: $116,875 (Fibonacci 0.618 level)
An ideal entry for a long position could be on a successful retest of the recently broken resistance around $112,800.
Bearish Continuation: If this bullish push is merely a liquidity grab and fails to hold, a break below the "Perfect Buy Zone" (a close below $111,500) would invalidate the bullish scenario. This would likely signal a continuation of the macro downtrend toward lower price targets.
Conclusion:
We have a classic conflict: a dominant bearish trend versus a strong bullish reaction from a key demand zone. While the immediate momentum favors the bulls, caution is advised. A confirmation of a higher low would strengthen the case for a reversal.
Disclaimer:
This is not financial advice. This is for educational purposes only. Always do your own research (DYOR) before entering any trade.

ETH Swing Long Opportunity ETH Daily Recap & Game Plan – 20.08.2025
📊 Market Sentiment
Overall sentiment remains bullish, supported by expectations of a 0.25% rate cut in the upcoming FOMC meeting. A weakening USD and increasing global risk appetite are creating favorable conditions for further upside in crypto assets.
📈 Technical Analysis
Price has been climbing in recent weeks, and we are currently in a retracement phase along with global markets (NQ and ES).
Price tapped into an untapped swing high, which is a strong zone I’m watching for reactions.
Additionally, price reached the equilibrium level of the Fibonacci (0.5), which places it in discount territory for me.
📌 Setup Trigger
The setup has already been triggered for me.
A 1H demand zone formed right after the EQ level was tested, so I entered the trade.
📋 Trade Management
Stoploss: 4035$
Targets:
TP1: 4279$
TP2: 4672$
TP3: 4888$ (ATH)
💬 Like, follow, and comment if you find this setup valuable!
⚠️ Disclaimer: This content is for informational and educational purposes only and does not constitute financial, investment, or trading advice. Always do your own research before making any financial decisions.

TradeCityPro | Bitcoin Daily Analysis #160👋 Welcome to TradeCity Pro!
Let’s move on to analyzing Bitcoin. Today, Powell gave a speech that had a big impact on the market. Let’s see what the market will do next.
⏳ 4-Hour Timeframe
Today, Jerome Powell delivered his speech at the Jackson Hole event and spoke about U.S. Federal Reserve policies.
🔔 His comments were in favor of the crypto market, raising expectations for an interest rate cut, and this caused Bitcoin to move upward.
🔍 As you can see, the current 4-hour candle is a very large green candle, and the price was supported by the zone we had marked.
📊 The buying volume that entered Bitcoin is very high, and the probability that the price ranges after this candle is high.
⚡️ Considering that we are close to the weekend, this ranging could continue until the weekly candle closes.
🚀 However, at the same time as this bullish candle in Bitcoin, its dominance dropped and declined. For this reason, altcoins like Ethereum moved upward even more strongly than Bitcoin.
📈 If the upward movement continues, we can use a candle setup or RSI entering the Overbuy zone as a long trigger.
❌ Disclaimer ❌
Trading futures is highly risky and dangerous. If you're not an expert, these triggers may not be suitable for you. You should first learn risk and capital management. You can also use the educational content from this channel.
Finally, these triggers reflect my personal opinions on price action, and the market may move completely against this analysis. So, do your own research before opening any position.

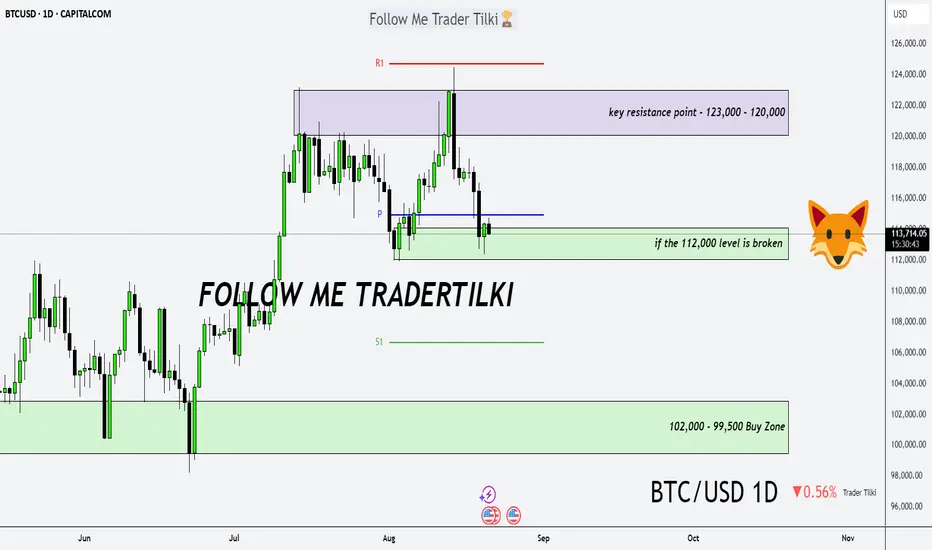
Bitcoin Daily Analysis – The Trend Is Our FriendGood morning, Guys,
I’ve prepared a fresh Bitcoin analysis for you.
🔹 First off, I stand firmly behind my long-term targets of **127,000 – 137,000 – 146,000**. I previously shared these levels with you in a weekly analysis.
🔍 Now let’s shift to the 1-day chart:
What is Bitcoin telling us right now?
📉 If the **112,000 level breaks downward**, we could enter a correction phase toward **102,000** or even **99,500**. I expect strong buying interest to return from those zones.
📈 After that, we’re facing a key resistance structure between **123,000 – 120,000**.
But I believe this zone will also be broken—because we’re in an **uptrend**, and…
💬 **The trend is our friend. Never forget that.**
Bitcoin above the $112k ┆ HolderStatBINANCE:BTCUSDT has tested the $111,978 support after forming a double top near recent highs. The level may produce a false break, and if buyers defend it, BTC could recover toward $122,500, continuing the overall bullish trend.

BITCOIN PREDICTION: PUMP TO $135K STARTING???! (Buy Now?) Yello Paradisers! In this video, I'm sharing with you the high time frame chart, the double shooting star candlestick pattern, double top formation, bearish divergence that needs to be confirmed, and its channel that we are trying to break to the downside. High time frame chart, I'm sharing with you the ABC zigzag and the potentiality of that C move being already finished. If not, the previous low needs to hold, and we are looking at things on a medium time frame. The bullish things on a medium time frame are the bullish divergence, and on a low time frame chart, the Elliott wave count that seems to be completed to the downside. If the previous low is going to hold, we are starting a new impulse towards $129,000 as a higher degree third wave. Then we will have a fourth wave, and the final fifth wave will take us towards $135,000. Watch the video where I'm explaining all the confirmations and the price action dynamics, and how we will be developing with the highest probability.
Paradisers! Keep in mind to trade only with a proper professional trading strategy. Wait for confirmations. Play with tactics. This is the only way you can be long-term profitable.
Remember, don’t trade without confirmations. Wait for them before creating a trade. Be disciplined, patient, and emotionally controlled. Only trade the highest probability setups with the greatest risk to reward ratio. This will ensure that you become a long-term profitable professional trader.
Don't be a gambler. Don't try to get rich quick. Make sure that your trading is professionally based on proper strategies and trade tactics.

Others: Now or Never- As always, the chart tells the full story (Trend, Fibonnacci and Elliot Waves).
Historically, OTHERS.D (altcoin dominance) has had big swings depending on market cycles:
- During altcoin seasons (e.g. 2017, 2021), it has surged strongly as capital rotated from BTC and ETH into mid-cap and small-cap coins.
- Macro Cycle : if Bitcoin finishes its post-halving run (2025–2026), then money often rotates into altcoins, pushing OTHERS.D higher.
- Historical levels: OTHERS.D peaked near 20% in 2021. So 27% is ambitious but not impossible if altcoin adoption accelerates.
Remember, I only provide technical analysis and assumptions, fundamentals can shift everything at any moment, whether through governments, wars, unforeseen events, or even something as wild as an asteroid or alien invasion.
Happy Tr4Ding !

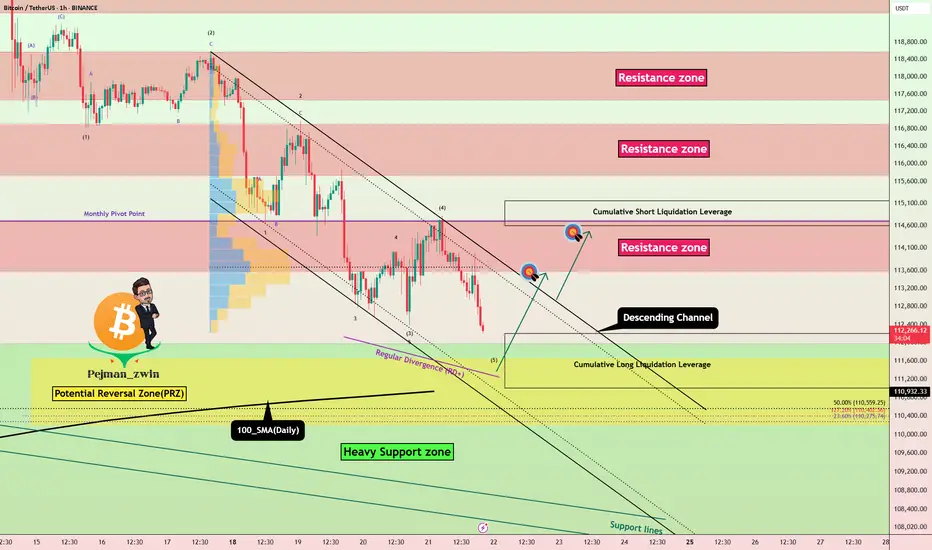
Bitcoin Long Setup: PRZ + Heavy Supports in Action!Bitcoin ( BINANCE:BTCUSDT ), as I expected in the previous idea , fell to at least $112,640 and is completing the second target (Full Target) .
Bitcoin is approaching the Heavy Support zone($111,980-$105,820) and 100_SMA(Daily) , Potential Reversal Zone(PRZ) , and Cumulative Long Liquidation Leverage($112,200-$111,000) , generally , heavy supports and resistances are NOT broken with the first attack , so I am publishing this analysis with the label ''LONG'' .
In terms of Elliott Wave theory , Bitcoin is completing a main wave 5 , as the main wave 3 was an extended wave .
Also, we can see the Regular Divergence(RD+) between Consecutive Valleys .
I expect Bitcoin to start rising from the Potential Reversal Zone(PRZ) and Cumulative Long Liquidation Leverage($112,200-$111,000) and increase to at least $113,617 .
Second Target: $114,391
Cumulative Short Liquidation Leverage: $115,157-$114,599
Note: Stop Loss(SL): $110,100
Please respect each other's ideas and express them politely if you agree or disagree.
Bitcoin Analyze (BTCUSDT), 1-hour time frame.
Be sure to follow the updated ideas.
Do not forget to put a Stop loss for your positions (For every position you want to open).
Please follow your strategy and updates; this is just my Idea, and I will gladly see your ideas in this post.
Please do not forget the ✅' like '✅ button 🙏😊 & Share it with your friends; thanks, and Trade safe.