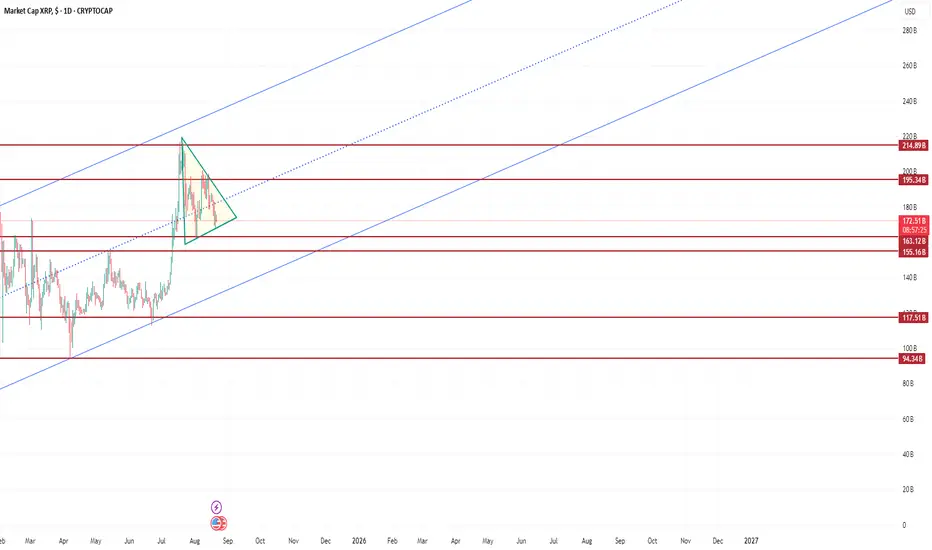
What is the horizon of XRP ? The given line chart illustrates that long-term trend has been clearly upward from nov,2024 by now. After a rapid growth on july 2025, it hit a peak at 219$, then it collapsed to 162$, a strong support line which stopped already chart for many times. Now, chart is inside a triangle and it is fluctuating there between 195 and 162$.
Given these facts, until XRP is between 195 and 162$, it does not expect that it can experiencer an serious increase or decrease. If it can break above the resistance level, 195$, there is opportunity to increase to top of the canale. On the other hand, If it breaks below the support level, 162$, it would decline to the bottom of the canal.
Therefore, the charts id in very crucial condition, and everything depends upon the first break that will it occur through the top or bottom.
Btc!
Sonic ($S) – Rebound After Heavy DownsideAfter months of downside, $S looks ready to repeat its historical cycle of massive accumulations followed by explosive breakouts.
✅ Previous cycles show gains of +1,600%, +5,600%, and +900% after similar consolidation phases.
✅ The current falling wedge breakout on the weekly chart suggests that momentum is shifting back in favor of the bulls.
✅ Strong fundamentals are aligning:
Testnet 2.1 upgrade (Aug 12) integrated Ethereum’s Pectra for scalability & interoperability.
TVL inflows of $21M and growing trading volume (June $3.1B → July $4.9B).
US expansion plans (ETF, NASDAQ PIPE, Delaware entity) with governance vote ending Aug 31.
🎯 Targets Ahead
First resistance: $0.54
Mid-term: $0.84 → $1.45
Long-term (cycle projection): $9 → $15+
⚡️ History shows what happens after long consolidations: parabolic runs. With fundamentals lining up and technicals breaking out, this could be the beginning of Sonic’s next major cycle.
💡 “After all the downside, it’s time for $S to return – the setup looks explosive.”

TradeCityPro | Bitcoin Daily Analysis #159👋 Welcome to TradeCity Pro!
Let’s dive into the Bitcoin analysis. Today, Bitcoin is sitting right on a very important support level. Let’s see what could happen in the market.
⏳ 4-Hour Timeframe
Today, I removed the old range we had on Bitcoin and added a support zone around 112000.
✔️ The reason for removing the old range was that the price had broken through it several times, both from above and below, so it could no longer be considered a Maker Buyer or Maker Seller zone.
🔔 The new zone I drew is a very strong support, and right now the price is fluctuating inside it.
✨ The 114790 trigger is a good entry signal for a long position, confirming that the price has been supported by the Maker Buyer zone. The important resistance levels above are at 116829 and 119096.
💥 If the 112233 level breaks, a sharp bearish leg could occur. But in my view, it is unlikely to happen today. If it does, it will probably come after Powell’s speech tomorrow.
🧩 Breaking the 30 level on RSI is still the momentum trigger for Bitcoin. If it enters the oversold zone, Bitcoin’s momentum will turn bearish, and the RSI could move down toward 24.60.
🔍 For today and tomorrow, I prefer not to open any new positions and wait until Powell’s speech at the Jackson Hole event to see when the market chooses its direction.
❌ Disclaimer ❌
Trading futures is highly risky and dangerous. If you're not an expert, these triggers may not be suitable for you. You should first learn risk and capital management. You can also use the educational content from this channel.
Finally, these triggers reflect my personal opinions on price action, and the market may move completely against this analysis. So, do your own research before opening any position.

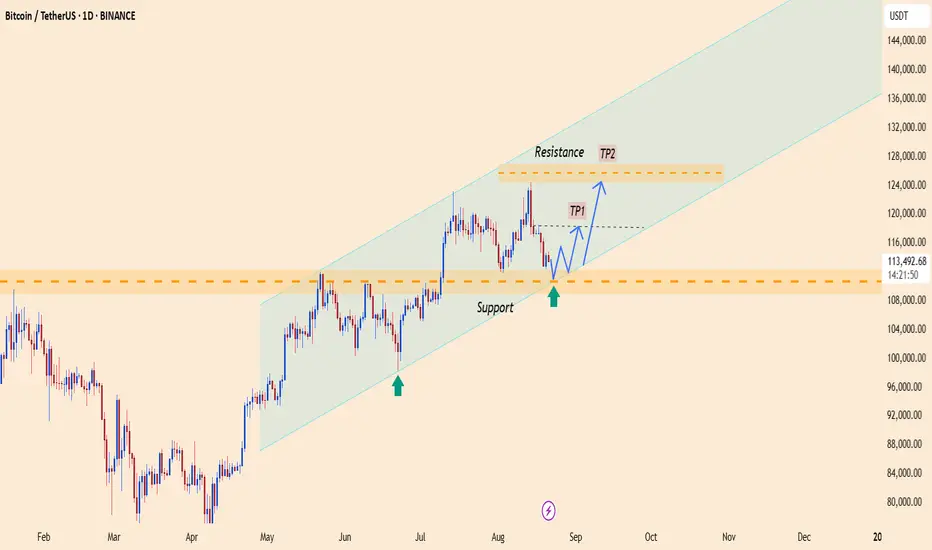
BTC Game PlanBTC Game Plan
📊 Market Sentiment
Overall sentiment remains bullish, supported by expectations of a 0.25% rate cut in the upcoming FOMC meeting. A weakening USD and increasing global risk appetite are creating favorable conditions for further upside in crypto assets.
📈 Technical Analysis
Price is currently retracing lower after printing new all-time highs.
It is moving toward the 112,000$ level, which contains significant liquidity. Therefore, I expect a strong bounce from that zone.
Additionally, price is approaching the equilibrium level (0.5 Fibonacci), which represents a discount for me.
📌 Game Plan
I expect price to retrace to the 111,316$ level and bounce from there.
🎯 Setup Trigger
I will be watching the 4H market structure for confirmation before initiating a position.
📋 Trade Management
Stoploss: 4H swing low confirming the BOS
Targets:
TP1: 118,446$
TP2: 124,351$
💬 Like, follow, and comment if you find this setup valuable!
⚠️ Disclaimer: This content is for informational and educational purposes only and does not constitute financial, investment, or trading advice. Always do your own research before making any financial decisions.

BTC 1H Analysis – Key Triggers Ahead | Day 18💀 Hey , how's it going ? Come over here — Satoshi got something for you !
⏰ We’re analyzing BTC on the 1-hour timeframe timeframe .
👀 On the 1-hour timeframe of Bitcoin, we can see that after hitting the $115,000 zone, it got rejected with a relatively strong red candle and is now moving toward its support at $112,700 .
⚙️ We have two key zones in the RSI : the support zone at 30 , and the resistance zone for long positions at 59.67. Breaking these levels can push Bitcoin toward its alarm zone and sensitive price area for a breakout .
🕯 The size of the red candles is getting smaller , showing reduced selling pressure , while the green reversal candles from $112,700 are closing larger and stronger than before .
💵 USDT.D on the 1-hour timeframe is moving toward its resistance at 4.46% , but the trend is weakening and the size of the buying candles is shrinking . In previous attempts to reach this zone, it faced rejection . If the 4.36% support level is lost , strong inflows could move into Bitcoin .
🔔 Our trading alarm zones are at $115,000 and $112,700 . These zones usually break with increased volume and volatility , and by watching price behavior there , we can find the best trading opportunities .
❤️ Disclaimer : This analysis is purely based on my personal opinion and I only trade if the stated triggers are activated .

BTC at the bottom of GTF range🎯 Key Levels to Watch:
• Above: 114150 / 115700 / 116455
• Below: 112300 / 111850 / 110653
🔥 BTC Liquidation Heatmap:
• Above: 114957 / 116098 / 116953
• Below: 112866 / 112201 / 110061
Liquidity pool under 111850 remains major magnet for the price. Will it be wiped out or not, no one knows for sure, but chances are very high. Especially since stocks took a hit yesterday. So either BTC dips and pumps back up fast, or that can turn into full scale correction down to 109k at least.
Developing quarter VWAP and Daily 20sma now form the strongest resistance on the way from 116010 to 116455 (values are approximate).
⏰ TG alarms set for: 111850, 110432, dev Quarter VWAP/VAH & Day 20-sma

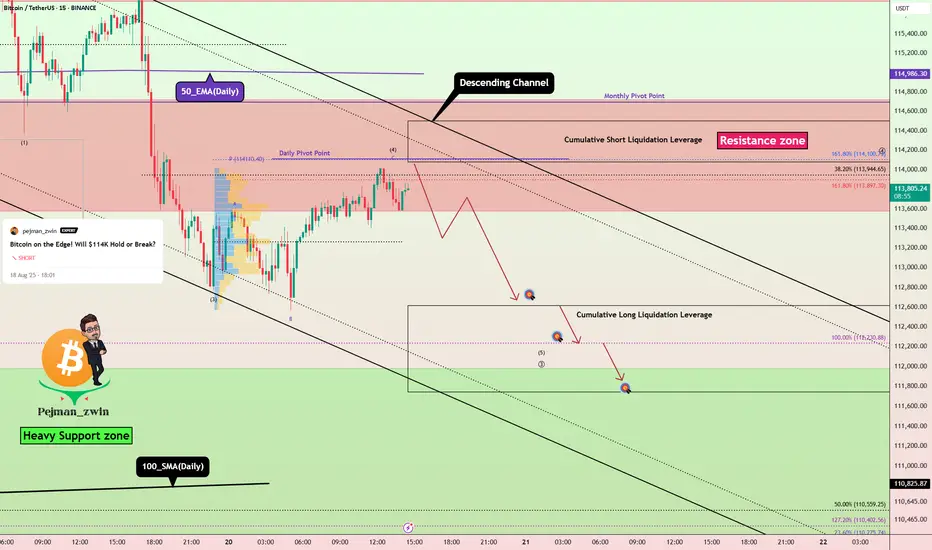
Bitcoin Short Setup _ Short-termBitcoin ( BINANCE:BTCUSDT ) has managed to break the Support zone($114,720-$113,570)/Now=Resistance zone and 50_EMA(Daily) , as I expected in the previous idea . And now it seems that Bitcoin is completing a pullback .
Also, on the 1-hour time frame , if you look closely, Bitcoin seems to be moving inside a descending channel .
In terms of Elliott wave theory , Bitcoin seems to be completing microwave 4 of the main wave 3 , so that microwave 4 could have an Expanding Flat structure(ABC/3-3-5) .
I expect Bitcoin to drop to at least $112,640 after completing the pullback ( microwave 4 of the main wave 3 ).
Second Target: $112,323
Cumulative Short Liquidation Leverage: $116,755-$115,778
Cumulative Short Liquidation Leverage: $114,500-$114,077
Cumulative Long Liquidation Leverage: $112,615-$111,743
Note: From today until Friday, important indexes will be released from the US, which can create excitement in financial markets, especially crypto, and even change the market trend when released.
Note: Most likely, after Bitcoin touches the Heavy Support zone($111,980-$105,820) and 100_SMA(Daily), we should wait for Bitcoin to bounce back (you might be able to look for a long position trigger in that zone).
Note: Stop Loss(SL): $114,823
Please respect each other's ideas and express them politely if you agree or disagree.
Bitcoin Analyze (BTCUSDT), 15-minute time frame.
Be sure to follow the updated ideas.
Do not forget to put a Stop loss for your positions (For every position you want to open).
Please follow your strategy and updates; this is just my Idea, and I will gladly see your ideas in this post.
Please do not forget the ✅' like '✅ button 🙏😊 & Share it with your friends; thanks, and Trade safe.
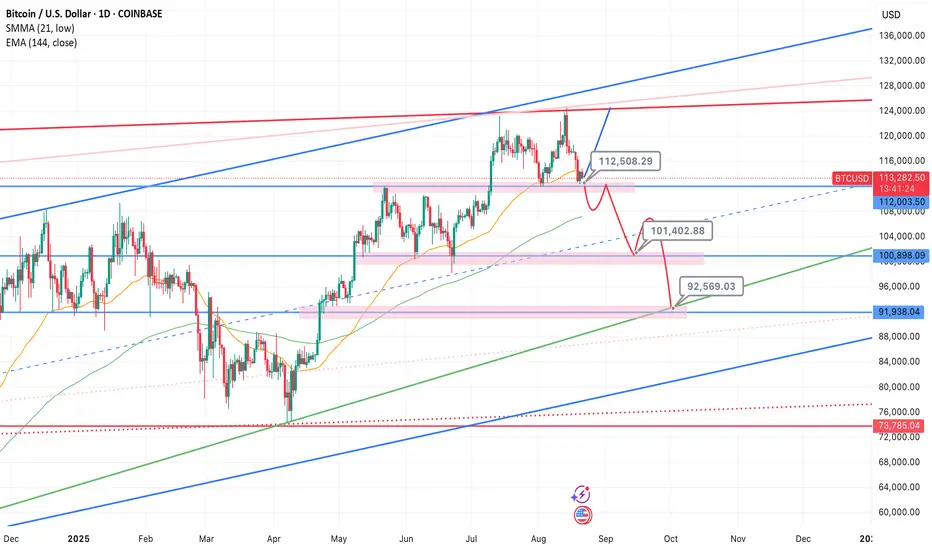
Bitcoin Holds the Line – $112.2K Is Key SupportAccording to on-chain data, BTC’s move to $125K was driven by short liquidations, not new capital inflow, therefore a rejection of highs into further consolidation was expected, after confirming by technical analysis reversal pattern. When rallies aren’t backed by real inflows, the downside tends to be ruthless. After rally printed a new all-time high, then tactical traders triggered a chain of long liquidations.
So the question now is—was this just a flush before a fresh leg up? Or is this market still unwinding?
I remain bullish from current levels. The recent drop looks more like a healthy correction than a trend reversal.
Key Risk:
The bullish scenario breaks if $112,200 support fails and we see a confirmed reversal structure (not just one wick/ short-term candle, but several days of follow-through).
Support Levels to Watch (Buy-the-Dip Zones):
$112,500
$101,400
$92,600
Macro View:
Liquidity signals continue to improve, profit-taking is largely complete, and we don’t see a cycle top yet. Long-term structure remains bullish, and this pullback should be seen as an accumulation opportunity.
Disclaimer:
Markets are subject to unpredictable events and the randomness of markets, please use appropriate risk management. DYOR
BTC Explodes: Heading Towards New Targets!The BTC/USDT chart shows a strong upward trend, with the price currently trading within a stable ascending channel. Bitcoin has rebounded from the support level at 3,314.700 USD and is now heading towards the next target at 3,372 USD. This price structure, with higher highs and higher lows, indicates that the bullish trend is strengthening. If BTC remains above the support level at 3,334 USD, the probability of continuing the upward movement towards 3,372 USD is very high.
News Supporting the Uptrend:
FOMC Minutes: The dovish tone from the FOMC has weakened the USD, which supports BTC's upward trend.
Jobless Claims: Higher-than-expected jobless claims data signals a weaker economy, pushing BTC higher.
PMI Index: Weak PMI figures reinforce the decline of the USD and create favorable conditions for BTC's price increase.
Trading Strategy:
Buy when BTC stays above the current support level, targeting the next level at 3,372 USD. Protect capital with a reasonable stop loss.
BTC 108-110K Vital area is TestingMorning folks,
Not many things to say for now, as major problem stands in fundamental area - US liquidity drought. S. Bessent grabs everything that he could and even more. He already finished RRP source totally and now US Treasury intends to put his hands in Banking Reserves. They still need ~ 350 Bln for their TGA Fed account and another 250Bln of net debt borrowing.
The major question whether BTC will able to hold this? So we do not want to take part in this adventure, especially with Jackson Hole meeting right around the corner.
We suggest to watch for market reaction on this support area and rely on clear patterns. If somehow this area will be broken, BTC could return back into 80-100K trading range. Many things will depend on close price of this week.
So, stay aside for now.

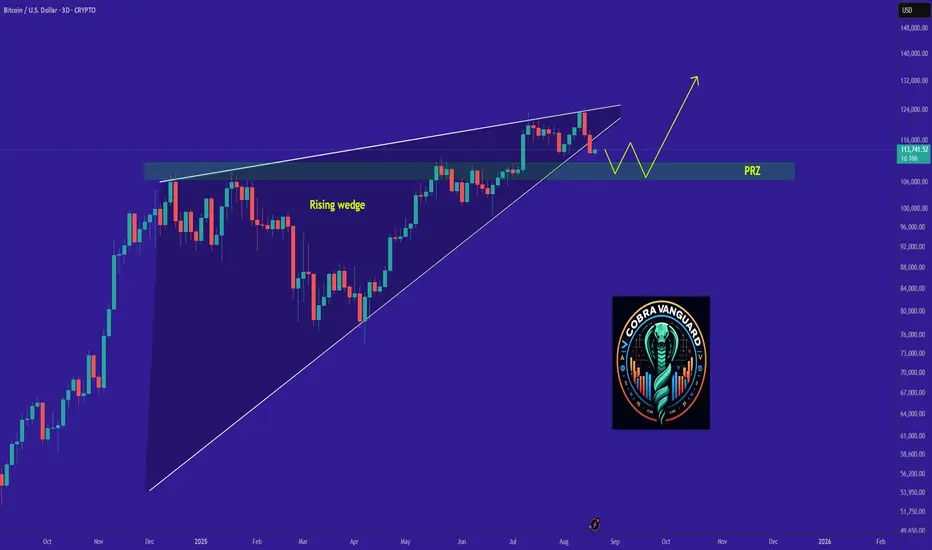
bitcoin's Situation, A Comprehensive Analysis !!!The price has broken the descending wedge and could now drop to 109K. It seems the PRZ (Potential Reversal Zone) is a stable range for Bitcoin.
#XRP How Long To Reach 3.31 ?#XRP
The price is moving within a descending channel on the 1-hour frame, adhering well to it, and is heading for a strong breakout and retest.
We have a bearish trend on the RSI indicator that is about to be broken and retested, supporting the upside.
There is a major support area (in green) at 2.80, which represents a strong basis for the upside.
For inquiries, please leave a comment.
We are in a consolidation trend above the 100 Moving Average.
Entry price: 2.90
First target: 3.30
Second target: 3.14
Third target: 3.31
Don't forget a simple matter: capital management.
When you reach the first target, save some money and then change your stop-loss order to an entry order.
For inquiries, please leave a comment.
Thank you.

Potential bearish reversal?The Bitcoin (BTC/USD) is rising towards the pivot which acts as a pullback resistance and could reverse to the 1st support, which is a multi swing low support.
Pivot: 116,456.65
1st Support: 112,346.982
1st Resistance: 118,969.64
Risk Warning:
Trading Forex and CFDs carries a high level of risk to your capital and you should only trade with money you can afford to lose. Trading Forex and CFDs may not be suitable for all investors, so please ensure that you fully understand the risks involved and seek independent advice if necessary.
Disclaimer:
The above opinions given constitute general market commentary, and do not constitute the opinion or advice of IC Markets or any form of personal or investment advice.
Any opinions, news, research, analyses, prices, other information, or links to third-party sites contained on this website are provided on an "as-is" basis, are intended only to be informative, is not an advice nor a recommendation, nor research, or a record of our trading prices, or an offer of, or solicitation for a transaction in any financial instrument and thus should not be treated as such. The information provided does not involve any specific investment objectives, financial situation and needs of any specific person who may receive it. Please be aware, that past performance is not a reliable indicator of future performance and/or results. Past Performance or Forward-looking scenarios based upon the reasonable beliefs of the third-party provider are not a guarantee of future performance. Actual results may differ materially from those anticipated in forward-looking or past performance statements. IC Markets makes no representation or warranty and assumes no liability as to the accuracy or completeness of the information provided, nor any loss arising from any investment based on a recommendation, forecast or any information supplied by any third-party.

BTCUSDT (Daily)✅ BTC/USDT — 1D (Spot) | Aug 22, 2025 — Professional Technical Analysis
🔎 Chart Context
• Pair: BTC/USDT
• Timeframe: Daily
• Current price: ~113,983
• The chart shows BTC in a retracement phase after rejecting from the 123,260 high, with projected upside target 131,438.
📊 Key Observations
1. Market Structure
• BTC created a higher high at 123,260 earlier this month.
• The correction is testing key daily demand zones.
• Structure remains bullish on daily timeframe as long as price holds 111,900 – 110,600 block.
2. Support & Demand Zones
• 111,999 – 111,915: Immediate demand zone, currently being tested.
• 110,600 – 110,400: Deeper liquidity shelf, acting as a strong structural support.
• 103,269 – 100,403: Long-term support zone (last defense before bullish invalidation).
3. Resistance & Supply Zones
• 118,000 – 120,000: Minor supply zone from breakdown.
• 123,260: Recent high & liquidity cluster.
• 131,438: Key upside target (marked on chart), representing the next liquidity pool.
4. Liquidity & Fair Value Gaps
• Current retracement is designed to rebalance liquidity gaps left by July’s rally.
• Liquidity sits below 111,900; once swept, a bullish continuation into 131,000+ becomes likely.
📈 Bullish Scenario (Higher Probability)
• BTC holds above 111,900–110,600 demand block.
• Path:
• Accumulation → reclaim 118,000–120,000 → break 123,260 high.
• Target: 131,438 (major liquidity zone).
• This aligns with the chart projection, suggesting a sweep into demand before a new impulse.
📉 Bearish Scenario (Lower Probability)
• BTC fails to hold 111,900–110,600 block.
• Breakdown path:
• Retest from below capped at 115,000–116,000.
• Move toward 103,269–100,400 support.
• A daily close below 100,000 would shift structure bearish and invalidate bullish continuation.
⚡ Trading Plan
Long Setup (Preferred with trend):
• Entry: 111,900–110,600 demand zone.
• TP1: 118,000
• TP2: 123,260
• TP3: 131,438
• Stop: Below 110,000
Short Setup (Countertrend, Risky):
• Entry: Failure bounce into 118,000–120,000.
• TP: 111,900 → 103,000
• Stop: Above 123,500
✅ Conclusion
BTC/USDT Daily remains structurally bullish, with the current pullback retesting 111,900–110,600 demand. As long as this zone holds, the probability favors continuation toward 131,438 after reclaiming 123,260. A breakdown below 110,000 would signal deeper correction into 103,000–100,000.

BTC Trendline Broken: 110k Support Is the Last Stand1. Recent Context
In my previous BTC analysis, I wrote that as long as the ascending trendline held, bulls had nothing to fear. But on Monday, that line was broken to the downside. After a few hesitations, I decided to close my long positions around 116k.
________________________________________
2. The Key Question
Can bulls defend 110–111k, or are we heading for a deeper correction?
________________________________________
3. Why the Chart Looks Weak Short-Term
• The trendline break changes the bullish structure.
• Bulls must defend 110–111k; if this zone cracks, the damage could be significant.
• To regain momentum, BTC must break back above 120k. Without that, upside looks limited.
________________________________________
4. Trading Plan
At this point, I’m out of the market.
• I won’t buy into 111k support even if a rebound is probable.
• Instead, I’ll treat that rebound as a chance to sell short at better prices.
• 120k zone is the ideal level for a short setup, both technically and from a risk/reward perspective.

BTC Long? ~ Strict NO ~ Wait for 108.5kI wonder who is so damn bullish on this COOOOOIINN right. now hahahhaha

Bitcoin (BTCUSD) | Key Support Retest💎 MJTrading
📸 Viewing Tip:
🛠️ Some layout elements may shift depending on your screen size.
🔗 View the fixed high-resolution chart here:
BINANCE:BTCUSD is retesting a key support zone at 110,000 – 113,000 within its uptrend channel.
👉 As long as support holds, bias remains bullish continuation and could send price toward 117k → 120k → ATH 123,700.
Failure to hold the 112k zone could shift momentum back to sellers, invalidating the higher-low structure.
======================
📝 Trade Setup:
🟢 Entry Zone: 112,000 – 114,000 (support retest / bounce confirmation)
❌ Stop Loss (SL): Below 110,000 (structure invalidation)
🎯 Take Profit (TP) Levels
✅ TP1 → 117,000 (near-term resistance)
📈 TP2 → 120,000 (round level / next resistance)
💰 TP3 → 123,700 (all-time high retest)
======================
#BTC #Bitcoin #Crypto #PriceAction #TechnicalAnalysis #Trading #MJTrading
Psychology Always Matters:

SUI Game Plan - AltcoinSUI Game Plan - Altcoin
📊 Market Sentiment
Overall sentiment remains bullish, supported by expectations of a 0.25% rate cut in the upcoming FOMC meeting. A weakening USD and increasing global risk appetite are creating favorable conditions for further upside in crypto assets.
📈 Technical Analysis
Price was rejected from the broken HTF bullish trendline.
It retraced back to the daily swing demand zone to gather more liquidity.
Price is currently trading below the 0.5 Fibonacci equilibrium level, which I consider a discount zone.
📌 Game Plan
I expect a deeper retracement towards the 4H swing liquidity at $3.45.
Additionally, the 0.75 Fibonacci max discount level aligns with this 4H swing liquidity. Running that liquidity would likely trigger a strong bounce.
🎯 Setup Trigger
I’ll be watching for a 4H break of structure (BOS) to initiate entries.
📋 Trade Management
Stoploss: 4H–1H swing low confirming the BOS
Targets:
TP1: $3.90
TP2: $4.18
TP3: $4.44
💬 Like, follow, and comment if you find this setup valuable!
⚠️ Disclaimer: This content is for informational and educational purposes only and does not constitute financial, investment, or trading advice. Always do your own research before making any financial decisions.

TradeCityPro | Bitcoin Daily Analysis #158👋 Welcome to TradeCity Pro!
Let’s get into Bitcoin analysis. Yesterday, Bitcoin’s decline continued, and now, after finding support at its key support zone, it is showing an attractive entry point for opening a position.
⏳ 4-Hour Timeframe
Yesterday, Bitcoin made another bearish leg and dropped close to the 112233 zone.
✔️ The recently closed 4-hour candle shows market indecision since it came with high volume and left large wicks on both sides, signaling a battle between buyers and sellers.
💥 The RSI oscillator still hasn’t dropped below the 30 zone and was supported there. Breaking this level would trigger another bearish leg toward 110000.
📊 If 112233 breaks, we can open a short position. It’s not a bad trigger, and the break of this zone would be the first sign of a trend change.
⚡️ However, I personally am still waiting for confirmation of the main trend and won’t open any position yet. For shorts, I think it’s still too early, and for longs, the structure hasn’t formed properly.
🔍 If today Bitcoin makes a bullish leg and climbs above 114790, then tomorrow we can consider opening a long position. But for now, no suitable trigger has been formed yet.
❌ Disclaimer ❌
Trading futures is highly risky and dangerous. If you're not an expert, these triggers may not be suitable for you. You should first learn risk and capital management. You can also use the educational content from this channel.
Finally, these triggers reflect my personal opinions on price action, and the market may move completely against this analysis. So, do your own research before opening any position.

Bitcoin Goes Bullish · Altcoins Market Resumes GrowingBitcoin and the altcoins market is about to perform one of those surprise moves that it really loves, a huge major advance; we are going up.
How are you feeling in this wonderful new week my friend?
I am happy to have your attention. Please, continue reading below and let me know in the comments what you think about this analysis.
The markets are open, people are trading, buying and selling while prices are rising. Bitcoin is no longer going down and the retrace was very small. The total drop so far amounts to less than 10%, but it is wise to consider that the current range is not $110,000 to $120,000 but $100,000 to $120,000. It is a wide range.
The new all-time high is not a major new level but instead a double-top compared to mid-July. Seeing how a double-top made no impression on the bears, seeing how the market continues super strong, we can easily predict that the bull market is not over and Bitcoin will continue to grow. What about Litecoin?
Chainlink is no longer trading at bottom prices but it has plenty of room available for growth. It is not at the bottom but certainly not a new all-time high either. The same for Cardano. Will it stop growing and enter a bear market when it was already doing so great? No, it will continue growing long-term.
Hedera also grew nicely and a small portion of the market is in the same boat. The bigger part though is still trading near support but not for long. August is the last chance to get those still behind while prices are still low. The fact that many projects are ahead, high up, confirms where the market is headed.
If you think a few years back, everything was down including Bitcoin.
If you think last year, everything was down but Bitcoin.
If you see how the market is doing now, many projects are very strong and growing. This reveals what is coming to the rest of the market.
First one, then two, then six, then twenty and then everything grows.
Bitcoin is about to make a surprise move... The entire market is set to grow.
Namaste.

BTC Analysis - August 20, 2025, 09:28 AM EDT 📊 Price: ~$114,016, consolidating after failing $120,000 resistance (24h).
Technical Analysis:
• Supports: $112,300, $108,000
• Resistance: $116,800, $120,000
• RSI: 46 (daily, neutral), 50 (4-hour)
• MACD: Bearish, histogram narrowing
• EMAs: Below 20-day ($117,300), above 50/200-day ($115K/$110K)
• Bollinger: Near mid-band ($115,400, daily)
Patterns:
• Ascending Channel: Retest of mid-channel ($114K–$115K, August 15–20)
• Bearish Pinbar: August 14
• Doji: August 19
On-Chain:
• MVRV Z-score: 2.2, neutral, nearing rally trigger
• Active Addresses: Up 3% (30d)
• CDD: Low, strong HODLing
• LTH Supply: 74% held >155 days
• STH Supply: Down 13% (30d), profit-taking
Fundamentals:
• M2: $107T (Feb 2025), 3.8% growth, 0.94 correlation with BTC
• ETFs: $15B inflows (2025), $0.8B weekly (August 15)
• Regulatory: GENIUS Act supports crypto (July 2025)
BTC Reserve: Exchange reserves down 10% (2025), low selling pressure.
Dominance: 61% (BTC.D), neutral, altseason if <63.2%.
Social Sentiment: 450K #BTC mentions on X, 55% bullish ( low volatility, dip-buying).
Trends: Neutral short-term, possible dip to $112,300. Long-term: $130K–$200K (2026).
Signal: Buy (60% confidence)
• Buy on dips: $112,300 or $108,000
• Stop-loss: <$108,000
• Target: $116,800 short-term, $130,000 (Q4 2025)
Disclaimer: Research before investing. #BTC

Bitcoin · Short-Term, Flash Crash & The Altcoins (1000% vs 100%)We've been tracking Bitcoin's retrace but it is wise not to lose focus on the noise, the short-term. Bitcoin is doing great based on its price but after growing a nice 67% since 7-April it needs a break. This is exactly what I mean when I say that an altcoin can grow 300% when Bitcoin grows 20%.
Here we have Ethereum growing more than 245% in the same period of time Bitcoin used to grow 67%. This is normal, Bitcoin has a bigger market capitalization, but Ethereum is the queen, #2. While it isn't Bitcoin it is still big. Some smaller altcoins have grown even more and have more potential for growth. And that's my main point.
Regardless of what happens in the short-term, Bitcoin will continue growing because the bull market is not over. Bitcoin growing more means the altcoins still have so much more to give. Lots to give. Just think about it. What one does, the rest follows.
So Ethereum did what Bitcoin did and XRP did what Bitcoin did and Solana also did the same, they all went to hit a new all-time high while remaining high up in price. Another bullish signal.
When the market is bearish and set to crash, just hitting a new all-time high produces a major bearish reaction. What we are seeing now is shy action, sideways, consolidation at resistance and small retraces; all classic bull market action.
The main support range is $100,000 to $110,000. Trading above it simply means super-bullish for the entire market. If Bitcoin were to drop to $100,000, nothing changes at all, truly. There will be some blood short-term but such an event would only last days, literally 1-3 days and that's it, the next day we get growth.
For example, 5-August 2024. A major crash and market flush but never again one new low. Once Bitcoin hit bottom 5-August 2024 around $49,600, it started to grow long-term. The same is true with 7-April 2025, the bottom was hit at $74,400 and no new lows, what followed was long-term growth.
Present day, think of the same. Bitcoin is retracing to move higher. Any major low would be the last and final low before long-term growth. If a new low does not happen, even better; regardless of the short-term, flash crash or no flush, Bitcoin is going up.
Focus on the bigger picture, buy those trading low.
When Bitcoin grows 100%, all the potential left in this bull market, a smaller altcoin project can grow 1,000% or more. Choose wisely, we are in this market to grow.
Namaste.

BTCUSDT 1H🔎 Chart Context
• Pair: BTC/USDT
• Exchange: Binance
• Timeframe: 1H (intraday)
• Date: 20 August 2025
• Current price: ~113,578
The chart uses Fair Value Gaps (FVG), Change of Character (CH), Supply/Demand blocks, and liquidity sweeps to track short-term moves.
📊 Key Observations
1. Overall Structure
• BTC is in a clear short-term downtrend on the 1H timeframe.
• Price broke down from 116,500–117,000 supply block, confirming a bearish CH 1H.
• Since then, the structure has been forming lower highs and lower lows.
2. Fair Value Gap (FVG)
• An FVG is marked near ~115,500–115,800.
• Price is currently trading well below this zone.
• Typically, market tends to retrace into FVG zones before resuming the main direction (here: bearish).
3. Liquidity Levels
• Above: Liquidity around 115,000–115,800 (FVG) → potential pullback target.
• Below: Liquidity pools near 112,000–111,000 demand block.
• A deeper liquidity sweep could reach 110,500–111,000, marked as the downside magnet.
4. Support & Demand Zones
• 113,000–112,000: Nearest minor support.
• 111,000–110,500: Major demand block, strong liquidity resting here.
5. Resistance & Supply Zones
• 115,000–115,800 FVG zone: Key intraday supply area.
• 116,500–117,000: Higher timeframe supply where the breakdown started.
📈 Bullish Scenario (Countertrend Relief Rally)
• If BTC defends 113,000 support, expect a bounce into 115,000–115,800 FVG.
• This would be a retracement move, not a trend reversal.
• Path: 113,000 → 115,000–115,800 → rejection.
• Only a clean reclaim of 117,000 CH zone would flip short-term bias bullish again.
📉 Bearish Scenario (Higher Probability)
• Trend is already bearish, so the likely path is:
1. Short retracement into 115,000–115,800 FVG.
2. Continuation lower toward 112,000.
3. Final sweep into 111,000–110,500 demand zone (major liquidity target).
• This scenario is also drawn on your chart with the projected arrow.
⚡ Trading Plan
• Short Setup (Preferred):
• Entry: 115,000–115,800 FVG zone.
• TP1: 113,000
• TP2: 112,000
• TP3: 111,000–110,500 demand
• Stop: Above 117,000 (CH invalidation).
• Long Setup (Risky, Countertrend):
• Entry: 111,000–110,500 demand zone.
• TP1: 113,000
• TP2: 115,000 FVG
• Stop: Below 110,000
