TradeCityPro | Bitcoin Daily Analysis #154👋 Welcome to TradeCity Pro!
Let’s move on to Bitcoin analysis — today I’ll cover the 1-Hour timeframe since Bitcoin is ranging and there isn’t much signal on higher timeframes.
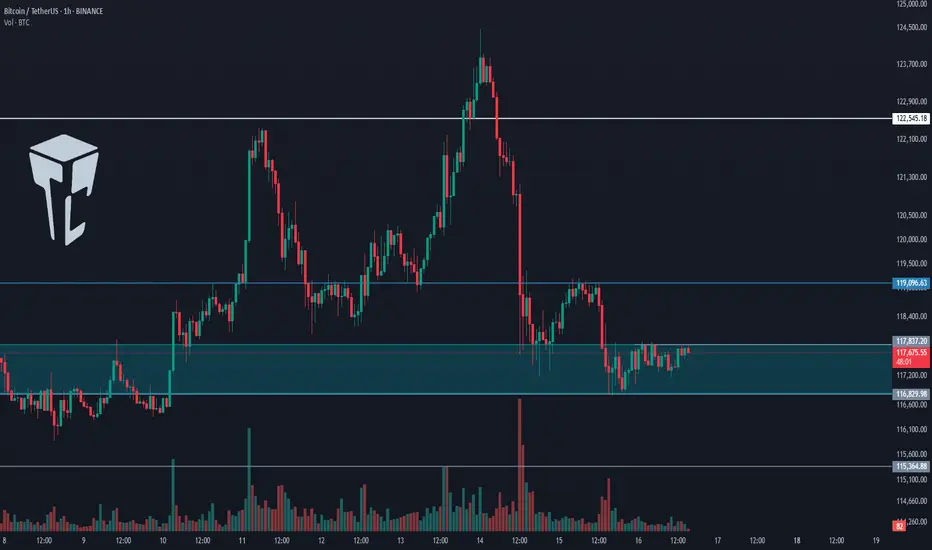
⏳ 1-Hour Timeframe
Currently, Bitcoin is sitting inside its support zone and hasn’t given a confirmed breakdown below this level yet.
📊 However, due to the lack of strong buyers and continuously decreasing volume, it looks like there’s still a chance for deeper corrections.
✔️ Of course, since it’s the weekend, lower volume can be expected. At the start of next week, we’ll need to see which direction price decides to move first.
🥸 Right now, Bitcoin has formed a box structure within the support zone. I believe the breakout of this box will be very important.
If the box breaks to the upside, Bitcoin could head back toward the 122545 resistance level.
If it breaks to the downside, the probability of another move toward 110000 will increase.
🔔 For now, I won’t be opening any new positions until the weekend is over. I’ll wait to see how the market reacts next week. Naturally, I won’t be giving any triggers for new positions until then.
❌ Disclaimer ❌
Trading futures is highly risky and dangerous. If you're not an expert, these triggers may not be suitable for you. You should first learn risk and capital management. You can also use the educational content from this channel.
Finally, these triggers reflect my personal opinions on price action, and the market may move completely against this analysis. So, do your own research before opening any position.
Btc!
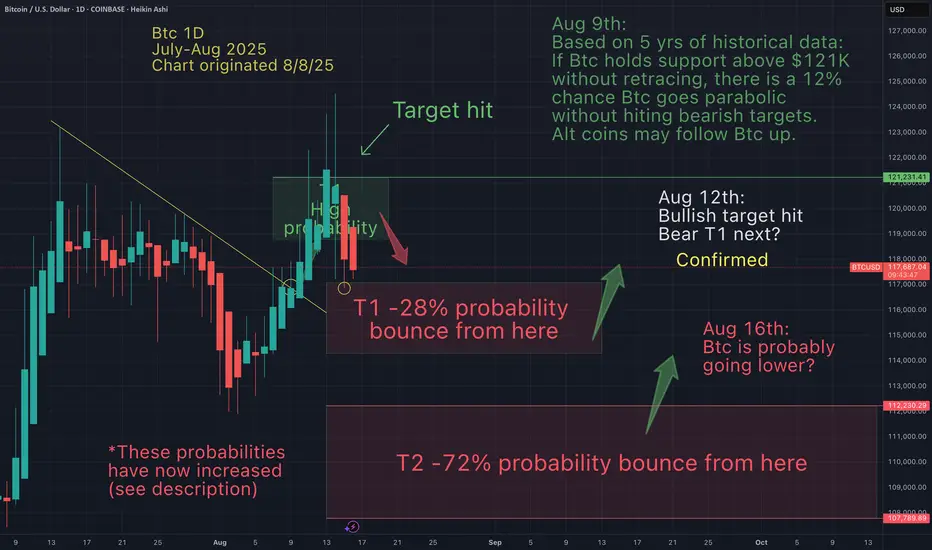
You will ask yourself "how did he know Btc would do that"?On Aug 9th I suggested Btc would pump from $112K to at least $121K (green box). That has now been confirmed. I also anticipated that Btc would retrace from there, to either T1 or T2 (Red boxes). That is now confimed and Btc may still go lower. See original chart below.
Simply determining support and reisitance is not enough! I must determine with greater certainty in which direction the asset going (at all times). Will it hit support first or reistance? This makes ALL the difference in trading. I have determined the diection from Aug 9th to go up... And then down from my T1 (green box)...and then up from one of my 2 red boxes.
Now that the 12% chance of a Btc pump without a retrace has been ruled out, the probabilities for my 2 bearish targets have increased accordingly. Now T1 (red) is 28% & T2 is 72%.
I have taken profit at the top and will buy back in at the next low. I am monitoring price action closely and anticpate buying into this next bottom.
May the trends be with you.
BRIEFING Week #33 : Status Quo... for nowHere's your weekly update ! Brought to you each weekend with years of track-record history..
Don't forget to hit the like/follow button if you feel like this post deserves it ;)
That's the best way to support me and help pushing this content to other users.
Kindly,
Phil

Cardano (ADA) +100% soonWhy Might ADA (Cardano) “Explode” in Price soon?
1. Major Upgrades & Governance Milestones
In August 2025, the Cardano community passed a landmark $70 million (≈96 million ADA) proposal to fund pivotal upgrades—including Ouroboros Leios, Hydra, Mithril, and Project Acropolis—designed to significantly boost scalability, interoperability, and developer tooling
These upgrades are expected to be rolled out over a 12-month roadmap—with milestone-based releases tightly monitored by stakeholders—making each major rollout a potential catalyst for ADA price jumps
2. Technical Breakouts & Chart Patterns
Analysts recently identified a bull-flag breakout on ADA’s chart, suggesting a potential 100–150% rally toward $1.60–$1.75 if momentum continues
Technical indicators (such as RSI and MACD) point to possible 46% gains if ADA breaks above key resistance levels or a push toward $0.90–$1.00 if the bullish trend extends
3. On-Chain & Institutional Activity
Cardano’s ecosystem is showing strong on-chain momentum with daily transactions near 2.6 million, low average fees and growing developer confidence
Institutional sentiment is increasing—Grayscale has allocated ~18.5% of its smart-contract fund to ADA, and ETF speculation is growing as regulatory clarity improves
Long-term holders remain resolute—over 15 billion ADA hasn’t moved for more than a year, indicating low selling pressure, while retail buzz increases
4. Whale Activity & Real-World Utility
A recent spike in "whale activity", including large ADA accumulation and a positive MVRV ratio (~22%), often precedes strong upward momentum
Improved real-world integration—like native ADA tools for Apple platforms and potential Apple Pay compatibility—can enhance mainstream adoption and act as price triggers
5. Broader Market & Macro Sentiment
ADA’s price tends to move with broader crypto sentiment. However, even amid market corrections, ADA has shown resilience and occasionally outperformed larger tokens—e.g., pumping while others crashed, driven largely by ETF buzz and technical setups
Headlines and media sentiment—even speculative projections (e.g., targeting $10)—can fuel dramatic moves, though these should be viewed with caution.
6. Forbes Advisor’s Top 10
Cryptocurrencies (August 14, 2025) Cardano (ADA)
BNB (BNB)
Bitcoin (BTC)
Polkadot (DOT)
Ethereum (ETH)
Litecoin (LTC)
Solana (SOL)

Next Volatility Period: Around August 24th
Hello, traders!
Follow us to get the latest updates quickly.
Have a great day!
-------------------------------------
(BTCUSDT 1D Chart)
After this volatility period, the price has re-entered the 115854.56-119177.56 range.
Accordingly, the key question is whether the price can rise after finding support in the 115854.56-119177.56 range.
The next volatility period is around August 24th (August 23rd-25th).
----------------------------------------
To determine the volatility period, support and resistance points and trend lines must be drawn on each timeframe chart.
Support and resistance points are drawn using the DOM(60), HA-High, HA-Low, and DOM(-60) indicators included in the HA-MS indicator.
Trend lines are drawn by connecting the points where the K value of the StochRSI indicator forms peaks in overbought or oversold zones.
Therefore, the trend line is drawn by connecting the peaks formed in overbought zones with a high trend line and the peaks formed in oversold zones with a low trend line.
If these two trend lines form a channel, the trend is likely to continue. If the trend lines intersect, a new trend is likely to be created.
(1M Chart)
The trend lines on the 1M chart are not specifically distinguished between high and low trend lines, but are instead displayed in a single color.
This is because we determined that distinguishing between them is unnecessary, as they represent long-term trends.
When creating trend lines, you must use peaks created in overbought or oversold areas.
The 1M chart displays a dotted trend line, which connects points in overbought or oversold areas that do not have peaks.
These trend lines are not used to determine periods of volatility.
(1W Chart)
Draw support and resistance points and trend lines on the 1W chart, just like on the 1M chart.
When possible, draw trend lines only from recently created peaks and delete previously drawn trend lines.
(1D Chart)
Draw support and resistance points and trend lines on the 1D chart, just like on the 1M and 1W charts.
The points where these support and resistance points and trend lines intersect or intersect are used to identify periods of volatility.
When possible, areas where multiple support and resistance points and trend lines intersect or intersect are considered periods of high volatility.
Also, since trend lines on 1M > 1W > 1D charts differ in accuracy, it's best to select points where they intersect more frequently when utilizing trend lines drawn on 1D charts.
-
Indicators or other analysis techniques created by others require long-term observation to understand and utilize.
Therefore, rather than defining them as right or wrong, consider them as possible and consistently check real-time data to make them your own.
-
Thank you for reading to the end.
I wish you successful trading.
--------------------------------------------------
- This is an explanation of the big picture.
(3-year bull market, 1-year bear market pattern)
I will explain in more detail when the bear market begins.
------------------------------------------------------

ETH Daily Recap & Game Plan – 15.08.2025ETH Daily Recap & Game Plan – 15.08.2025
📊 Market Sentiment
Overall sentiment remains bullish, supported by expectations of a 0.25% rate cut in the upcoming FOMC meeting. A weakening USD and increasing global risk appetite are creating favorable conditions for further upside in crypto assets.
Ethereum is approaching all-time highs, fueled by a $1B single-day ETF inflow. Additionally, rumors of potential SEC approval for Ethereum staking policy could directly boost ETH’s utility — strengthening the long bias.
📈 Technical Analysis
Price has started a retracement move after Bitcoin reached new all-time highs.
Currently, ETH is testing the daily demand zone (blue box) — a level where we may see a reaction. For confirmation, I want to see a 4H break of structure before initiating any trades.
Since it’s the weekend, I expect some choppy price action and possibly a deeper retracement. I’m watching two potential scenarios (Blue vs. Red).
📌 Game Plan
Scenario 1 (Blue)
→ Price sweeps 4H swing liquidity at 4255$, then rejects.
Scenario 2 (Red)
→ Price dips deeper, tapping the untested swing high at 4112$ and possibly into the equilibrium discount zone (0.5 Fibonacci), before rejecting.
🎯 Setup Trigger
Waiting for a 4H break of structure before entering any position.
📋 Trade Management
Stoploss: 4H swing low confirming the BOS
Target: Run directly toward all-time highs at 4867$
💬 Like, follow, and comment if you find this setup valuable!
Disclaimer: This content is for informational and educational purposes only and does not constitute financial, investment, or trading advice. Always do your own research before making any financial decisions.

ETH Long Idea - Daily Recap - 14.08.2025📊 Market Sentiment
Overall sentiment remains bullish, supported by expectations of a 0.25% rate cut in the upcoming FOMC meeting. A weakening USD and increasing global risk appetite are creating favorable conditions for further upside in crypto assets.
Ethereum is approaching all-time highs, fueled by a $1B single-day ETF inflow. Additionally, rumors of potential SEC approval for Ethereum staking policy could directly boost ETH’s utility — strengthening the long bias.
📈 Technical Analysis
Price has pulled back to the daily fair value gap. HTF fair value gaps are historically strong zones for potential bounces.
📌 Game Plan
I expect possible expansion toward all-time highs here, as we have broken the LTF market structure.
📋 Trade Management
Entry: 4602$
SL: 4455$
TP: All-time highs at 4867$
💬 Like, follow, and comment if you find this setup valuable!
Disclaimer: This content is for informational and educational purposes only and does not constitute financial, investment, or trading advice. Always do your own research before making any financial decisions.

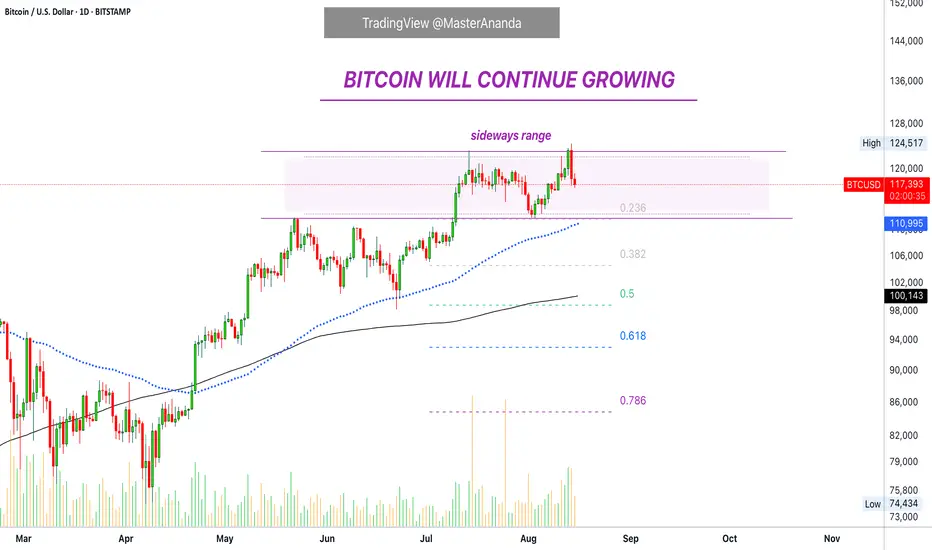
Bitcoin Sideways: Bullish Altcoins, Bullish BitcoinIt seems we are seeing a repeat of the May-June period.
When Bitcoin moves sideways at a high price, the altcoins market tends to blow up. This is exactly what we are about to see and what we have been seeing for months.
Bitcoin is growing, the altcoins are growing; everything is about to speed up. We will see a strong influx of capital into the market and we will see some major positive developments.
Why Bitcoin bearish?
Because you are focusing on the really short-term. There is nothing bearish about this chart or Bitcoin if we focus on the bigger picture, only the short-term shows potential for lower and this lower would be part of consolidation before additional growth as mentioned before.
Notice how Bitcoin is safely trading above EMA89 (blue) and MA200 (black). Then notice how the trading volume in the last two days is not as high as 15 and 25 July. This much selling yet prices remaining stable and even rising afterward is a major signal of strength. In short, all selling is being bought; the demand for Bitcoin is just too strong.
With a very strong demand for our beloved Bitcoin what do you think will happen next?
The market will continue growing.
There are always less and less Bitcoins always, it is a deflationary currency; it is built into the system so that the crypto-currency appreciates overtime. This system has been shown to work and Bitcoin is going up.
We are seeing the effect of months and months of positive news and developments and we have not seen it all. There is more to come.
Thanks for your support.
If you enjoy the content, you can always choose to follow.
Namaste.
BTC 1H Analysis – Key Triggers Ahead | Day 12💀 Hey , how's it going ? Come over here — Satoshi got something for you !
BINANCE:BTCUSDT
⌛ On the 1-hour Bitcoin timeframe, we can see that the trend has shifted from bullish to a deep correction. The reason for this move was the release of higher-than-expected Producer Price Inflation, influenced in part by Trump’s tariff policies. As a result, the likelihood of an interest rate ( CPI) cut has decreased — which is not particularly favorable news for the market.
👀 After forming a new all-time high, Bitcoin faced heavy selling pressure and a sharp rejection, pushing it towards support levels. The current key support for Bitcoin is at $117,200, which could attract market makers (buyer entries). The next support is likely around $115,000.
🎮 Fibonacci levels have been drawn from a higher low to Bitcoin’s all-time high. The most important levels are $117,200 and $119,800. A breakout above or below these levels could provide potential long or short trading opportunities.
⚙️ On the RSI, the key resistance zone is at 35.88. Historically, each time the RSI has reached this level, Bitcoin has reacted strongly. A rejection here could lead to a deeper correction, while a breakout above it could trigger upward momentum.
🕯 Both trading volume and the number of transactions are increasing, but selling pressure is leaving increasingly “red” candles. This rise in volume could be a useful signal for planning entries.
🔔 There’s no specific alarm zone today since Bitcoin is in a phase of uncertainty, and the exact reason for the market’s drop has not yet been fully absorbed.
CRYPTOCAP:USDT.D 📈USDT.D has broken a strong resistance level and is now moving toward its next resistance .
🖥 Summary: Trump’s tariffs have fueled higher producer inflation, reducing the chances of a rate cut. Bitcoin’s critical support is at $117,200; if this breaks, the price could move towards lower levels.
❤️ Disclaimer : This analysis is purely based on my personal opinion and I only trade if the stated triggers are activated .

BTC/USDTBTC is currently in consolidation, with a deviation above the range already in place.
If we see a deviation below the range, long setups can be considered — but only with clear confirmation

Litecoin Entering Its Blast Off Point LTC/USDThis is what it looks like to me. It looks like we may be finding some support around here. If I am right and this fractal is repeating I think we see Litecoin actually go straight up to $250 before it comes back down to retest the now support previous resistance at around 135, quite quickly then reverse sharply to the upside. Im long here, lets hope Im right cause this would wash out alot of longs and shorts right before the real big move. None of this is financial advice just my opinion.

SUI Setup – Support Zone Long OpportunitySUI, with its smaller market cap compared to majors like ETH, BTC, and SOL, remains more sensitive to market swings. Price has now retraced into a key support zone, offering a potential long entry for the next upside leg.
Trade Setup:
• Entry Zone: $3.40 – $3.60
• Take Profit Targets:
🥇 $4.00 – $4.20
🥈 $5.00 – $5.20
• Stop Loss: $2.90

BITCOIN PREDICTION: CRITICAL UPDATE (warning) Yello Paradisers! In this video, we are going through high-timeframe, medium-timeframe, and lower-timeframe analysis. This multi-timeframe analysis is important for us to understand the whole context of the market, and that is how we are able to make the best trading decisions as professional traders.
I'm explaining to you that we are on the high-timeframe chart, trading inside of a channel ABC zigzag formation. From an Elliott Wave perspective, we are currently in the C wave, which is a motive wave, and we are creating the smaller secondary wave. We can see a bullish divergence confirmed, and we are waiting for RSI to have a successful bullish reclaim.
I'm updating you about the 0.61 Fibonacci retracement level and all of the confluences at around $116,000 and $117,000. From a medium-timeframe perspective, we are updating the Elliott Wave price action development count. I'm sharing with you the contracting triangle. The deviation that happened during the E wave, the confluence of the $116,000 and $117,000, and truly sharing with you how important this demand zone area really is.
Then we are moving our attention to low time frame analysis where I share with you the most probable price action development in the upcoming days, weeks, and months.
Paradisers! Keep in mind to trade only with a proper professional trading strategy. Wait for confirmations. Play with tactics. This is the only way you can be long-term profitable.
Remember, don’t trade without confirmations. Wait for them before creating a trade. Be disciplined, patient, and emotionally controlled. Only trade the highest probability setups with the greatest risk to reward ratio. This will ensure that you become a long-term profitable professional trader.
Don't be a gambler. Don't try to get rich quick. Make sure that your trading is professionally based on proper strategies and trade tactics.

Bitcoin held steady at $117k ┆ HolderStatBINANCE:BTCUSDT recovered after a stop-hunt below recent lows, with momentum now aiming toward $125,000+. Holding above $114,500 is key for bullish continuation.

Bitcoin to 85K TargetRising Wedge speaks for itself
Never properly backtested the 84-86K area breakout.
Every pullback has been front runned and never properly hit any fibs on each pullback. Typical rising wedge behavior.
Bearish divergences on the Daily and almost all time frames. Get rekt bulls.
TradeCityPro | Bitcoin Daily Analysis #153👋 Welcome to TradeCity Pro!
Let’s move on to Bitcoin analysis — yesterday we saw Bitcoin’s reaction to the news, and now we’ll see what it plans to do today.
⏳ 4-Hour Timeframe
Yesterday, the 117,000 support level held, and Bitcoin managed to bounce from this area, preventing further decline.
✔️ As I mentioned before, if the price doesn’t close below this level, the overall trend remains bullish. As long as we stay above this zone, I’ll be looking for long triggers in the market, not shorts.
💥 Yesterday, with the news release, Bitcoin dominance saw an upward correction, but the overall trend remains bearish. If that continues, we can keep focusing more on altcoins.
🔔 Currently, there’s no trigger for opening a Bitcoin position, and personally, I’m not very eager to trade it now, because dominance is dropping, and as long as Bitcoin isn’t bearish, altcoins can keep moving up.
✨ Considering the sharp decline in volume in today’s candles, I think the chances are high that Bitcoin will range until the start of next week. If dominance continues its correction, the market won’t be giving us many trade setups over the next few days.
🔍 For now, it’s better to wait until our strategy’s structure and triggers form again, and then, once they’re activated, we can open our positions.
❌ Disclaimer ❌
Trading futures is highly risky and dangerous. If you're not an expert, these triggers may not be suitable for you. You should first learn risk and capital management. You can also use the educational content from this channel.
Finally, these triggers reflect my personal opinions on price action, and the market may move completely against this analysis. So, do your own research before opening any position.

US30 - potential head and shoulders on 30min chartWatching the US30Cash for a potential short setup.
A head and shoulders pattern may be forming on the 30-minute timeframe. I’m still waiting for confirmation on some key variables before entering the trade.
Trade Details:
📊 Risk/Reward: 2.7
🎯 Entry: 45 224
🛑 Stop Loss: 45 261
💰 Take Profit 1 (50%): 45 141
💰 Take Profit 2 (50%): 45 084
Thanks for checking out my post! Make sure to follow me to catch the next update. If you found this helpful, give it a like 👍 and share your thoughts 💬 — I’d love to hear what you think!
Please note: This is not financial advice. This content is to track my trading journey and for educational purposes only.

BTC Accumulates and Adjusts Slightly💎 BTC WEEKEND PLAN UPDATE (15/08)
BTC Analysis After PPI
Trading Highlights
After the PPI release, BTC completed its bullish wave and reached a peak of 123.2K, exactly at the 2.618 Fibonacci Extension level – a strong resistance zone that had been anticipated.
Afterward, the price sharply reversed, dropping to the 117K support area – aligning with the main uptrend line and the 0.236 Fibonacci retracement of the most recent bullish wave → this was where we successfully executed a bottom-picking buy.
Current Price Action
The price is now recovering from 117K toward the 120.7K – 121K resistance area (a confluence of the 0.618 Fibonacci retracement, a previous supply zone, and the H4 EMA).
The short-term trend remains a technical rebound after a sharp drop, with no confirmed sustained bullish reversal yet.
Scenarios & Next Trend
• Main Scenario: Price rebounds to 120.7K – 121K → faces selling pressure → sharply reverses downward following a corrective wave toward 116K – 115K (strong support).
• Alternative Scenario: If 121K is broken with high volume, BTC could revisit the 122.9K – 123.2K zone.
Key Levels
• Resistance: 120.7K – 121K / 122.9K – 123.2K
• Support: 117K / 116K – 115K”

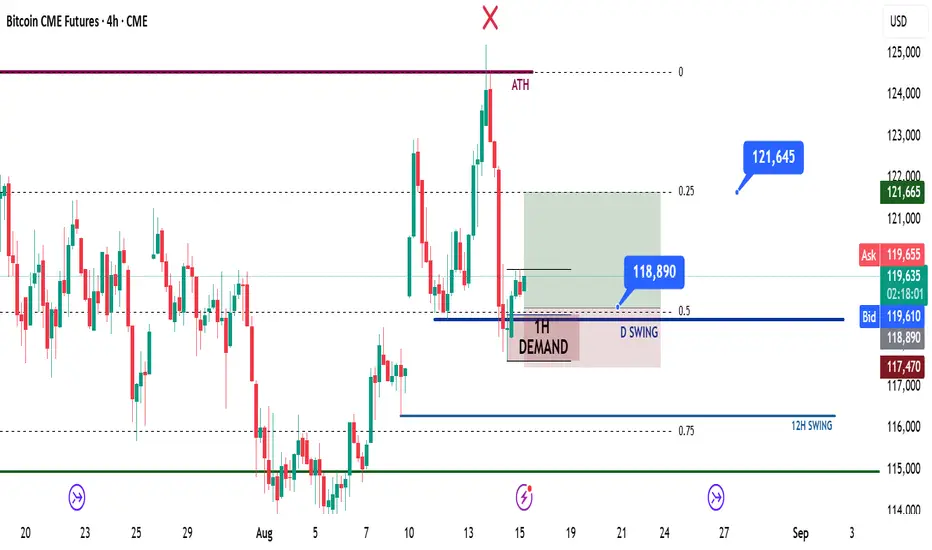
BTC Daily Recap & Game Plan – 15.08.2025BTC Daily Recap & Game Plan – 15.08.2025
📊 Market Sentiment
Overall sentiment remains bullish, supported by expectations of a 0.25% rate cut in the upcoming FOMC meeting. A weakening USD and increasing global risk appetite are creating favorable conditions for further upside in crypto assets.
📈 Technical Analysis
Price has started retracing into the daily swing level and the 0.5 Fibonacci zone, as anticipated in my previous Bitcoin daily update post (linked in the attachment, please check).
We have now seen a 1H break of structure following liquidity grabs.
📌 Game Plan
I will be looking for an entry around the $118,800 level, as there is a 1H demand zone that could support a move higher.
📋 Trade Management
Entry: $118,800
SL: $117,000
TP: $121,600
💬 Like, follow, and comment if you find this setup valuable!
Disclaimer: This content is for informational and educational purposes only and does not constitute financial, investment, or trading advice. Always do your own research before making any financial decisions.
BTCUSD H4 | Bullish bounce offBitcoin (BTC/USD) has reacted off the buy entry of 117.387.77, which is a pullback support that aligns with the 61.8% Fibonacci retracement and could rise from this level to the upside.
Stop loss is at 113,331.94, which is a swing low support.
Take profit is at 122,526.14, which is a multi swing high resistance.
High Risk Investment Warning
Trading Forex/CFDs on margin carries a high level of risk and may not be suitable for all investors. Leverage can work against you.
Stratos Markets Limited (tradu.com ):
CFDs are complex instruments and come with a high risk of losing money rapidly due to leverage. 65% of retail investor accounts lose money when trading CFDs with this provider. You should consider whether you understand how CFDs work and whether you can afford to take the high risk of losing your money.
Stratos Europe Ltd (tradu.com ):
CFDs are complex instruments and come with a high risk of losing money rapidly due to leverage. 66% of retail investor accounts lose money when trading CFDs with this provider. You should consider whether you understand how CFDs work and whether you can afford to take the high risk of losing your money.
Stratos Global LLC (tradu.com ):
Losses can exceed deposits.
Please be advised that the information presented on TradingView is provided to Tradu (‘Company’, ‘we’) by a third-party provider (‘TFA Global Pte Ltd’). Please be reminded that you are solely responsible for the trading decisions on your account. There is a very high degree of risk involved in trading. Any information and/or content is intended entirely for research, educational and informational purposes only and does not constitute investment or consultation advice or investment strategy. The information is not tailored to the investment needs of any specific person and therefore does not involve a consideration of any of the investment objectives, financial situation or needs of any viewer that may receive it. Kindly also note that past performance is not a reliable indicator of future results. Actual results may differ materially from those anticipated in forward-looking or past performance statements. We assume no liability as to the accuracy or completeness of any of the information and/or content provided herein and the Company cannot be held responsible for any omission, mistake nor for any loss or damage including without limitation to any loss of profit which may arise from reliance on any information supplied by TFA Global Pte Ltd.
The speaker(s) is neither an employee, agent nor representative of Tradu and is therefore acting independently. The opinions given are their own, constitute general market commentary, and do not constitute the opinion or advice of Tradu or any form of personal or investment advice. Tradu neither endorses nor guarantees offerings of third-party speakers, nor is Tradu responsible for the content, veracity or opinions of third-party speakers, presenters or participants.

Correction or just a bullish dip?Bitcoin dumped all the way to Daily 20-sma and found temporary support there. Day candle formed bearish engulfing. Strong downside move often cause a dead cat bounce first, but dump momentum may take price lower on the following swing.
🎯 Key Levels to Watch:
• Above: 120066 / 120900 / 122092
• Below: 117940 / 117400 / 116630
🔥 BTC Liquidation Heatmap:
• Above: 119400 / 120090 / 122174
• Below: 117095 / 116060 / 115484
Short term range ~117400-119255. Price will swing in between till break one way or another.
Most probable bounce target is re-test of zone above 120k which correlates with Wednesday NY low and developing quarter VAH.
If there will be another dip, nearest liquidity pool is within 115485-116060 zone.
⏰ TG alarms set for: 122092 (Tokyo low), 120066 (week open), 117400 (LTF range low), dev Quarter VWAP & VAH & Day 20-sma

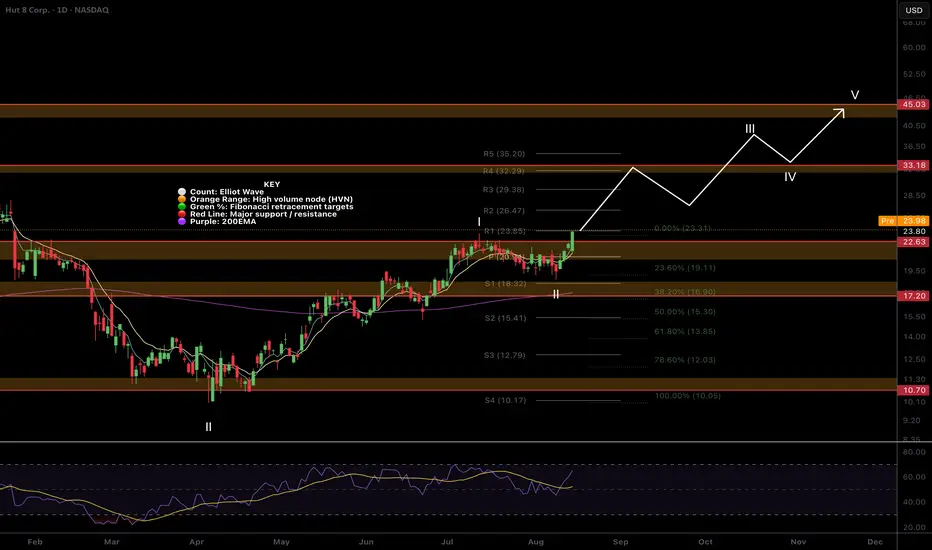
$HUT is Blasting Off Again!NASDAQ:HUT pull backs continue to be shallow making an accurate Elliot wave count difficult but this is a characteristic of a strong wave 3.
The next target is $33 major High Volume Node resistance at the R4 daily pivot.
RSI is printing daily bearish divergence but this will be offset soon if price continues upwards.
Safe trading
Bitcoin : Stay heavy on positionsSame view as before. No change.
Bitcoin : Stay heavy on positions (2x)
For new Bitcoin entries, now is the time.
If you're using leverage, I’d wait for a scale-in signal before jumping in.
** This analysis is based solely on the quantification of crowd psychology.
It does not incorporate price action, trading volume, or macroeconomic indicators.
