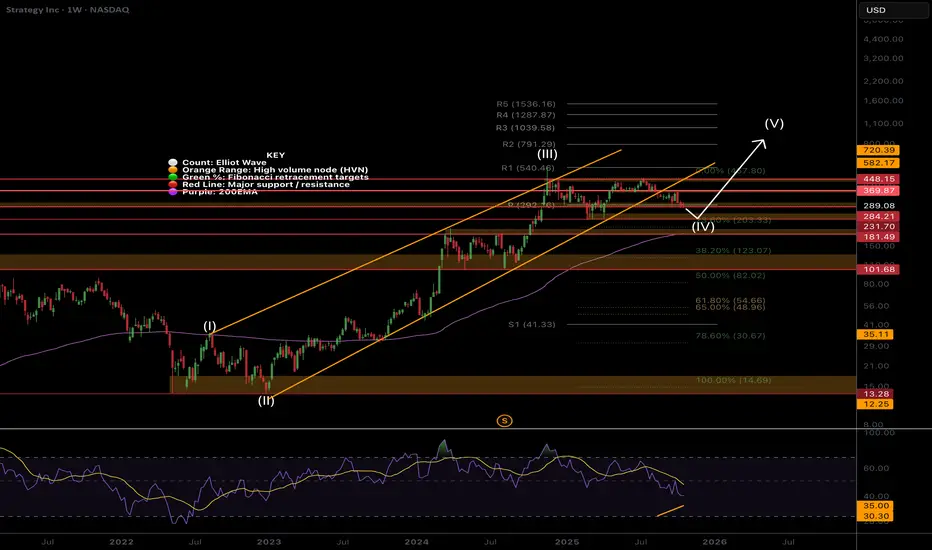
MSTR still in wave 4 rangeNASDAQ:MSTR Price is still in a wave (IV) which are expected to be long and drawn out, yet shallow which is what we have here. I don’t expect wave (V) to kick in until Bitcoin moves. Wave (V) has an expected of the R3 daily pivot at $1039 but will overextend if Bitcoin does.
Price has fallen out of the lower channel boundary and sitting at the weekly pivot, still above the weekly 200EMA so the outlook us bullish. wave (4) may complete at the 0.236 Fibonacci retracement at $203. For now I am waiting to see what happens before entering but believe good opportunities are setting up.
Safe trading
Btc-bitcoin
BTC - Liquidity Dynamics leading to new HighsMarket Context
Bitcoin has shown a constructive reaction from the recent lows, printing a clean double bottom structure that suggests short-term demand entering the market. After a previous buy-side liquidity sweep and rejection, price has rebalanced and is now challenging a fair value gap (FVG) that previously served as resistance. This marks a key decision zone where the next directional move will unfold.
Fair Value Gaps & Structure
The FVG overhead has already acted as resistance, capping the first impulsive move from the lows. Should price retrace slightly to take out the remaining sell-side liquidity below the double bottom before re-engaging higher, it would confirm the area as a springboard for a bullish continuation. A clean reclaim and hold above the FVG zone would signal a shift in order flow favoring buyers.
Liquidity Dynamics
The current setup offers both sides of the market clear liquidity targets: sell-side liquidity resting under the double bottom and buy-side liquidity resting above the prior high. Smart money could engineer a sweep of the lower side first to accumulate before expansion, or alternatively, break directly through resistance to trigger a larger bullish leg.
Final Thoughts
The structure reflects a balanced but bullish-leaning scenario — a classic accumulation and breakout setup. A deeper retest to clear out lower liquidity would strengthen the foundation for continuation, while sustained strength above the FVG opens the door for a reaction toward new highs.
If this analysis aligned with your view, drop a like — do you think we clear the lows first, or head straight for a bullish breakout?

MARA Strong breakout incomingNASDAQ:MARA is stalling at the weekly pivot as expected but is above the 200EMA. Wave (II) appears complete at the 0.5 Fibonacci retracement with a swing below the lower boundary trend-line.
Wave 3 of (III) appears to be underway so I am looking for an aggressive breakout to the upside once we clear the current resistance. The R1 pivot is the first target at $30 where the last bit of major resistance before the stronger breakout should come in, the High Volume Node.
Wave (III) has a target of $83 at the next major High Volume Node resistance, just above the R5 pivot.
Analysis is invalidated if we fall below $10. RSI is at the EQ with plenty of room for upside
Safe trading

IREN Exhausted? PUllback time?IREN wave (3) ran incredibly and I am looking for a deeper pullback as people begin to take profit. I have closed my positions at a 10x and am waiting for re-entry. The weekly pivots have been ran, RSI is at max overbought but can remain here for months (as it has done).
Initial downside targets for wave (4) is the 0.236 Fib retracement at $39 followed by the 0.382, $26.43. Expect shorts to pile in adding to any downside momentum.
In the long term I believe we have much higher to go towards $100 in wave (5).
Safe trading

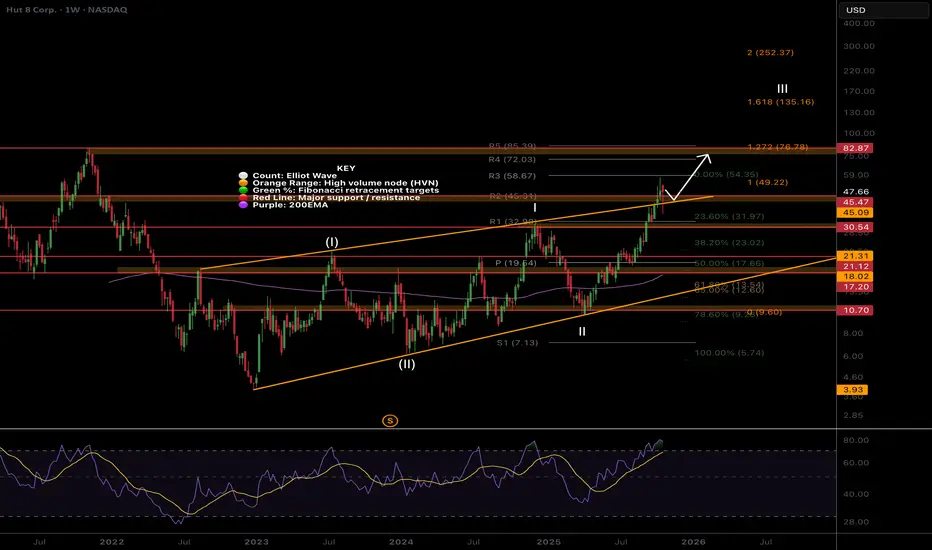
$HUT Breaking out, test of channel done and dusted!Hut has broken out of the channel upper boundary and a test of the boundary took place as expected, quickly catching a bid and recovering 17% Friday, producing a long signal for me.
The next target is the High Volume Node resistance at $82 just under the R5 weekly pivot. Fibonacci extension has a minimum target of the 1.618, $135.
The Elliot wave count suggests a very bullish move come in wave III of (III) which would overextend the 1.618 target above, $200+.
RSI is overbought but can remain here for months.
Safe trading
Coinbase Bottom in, new all time high coming?NASDAQ:COIN had a deep pullback after its recent bullish move but caught a large bid by the end of the week leaving a long lower wick. It appears the bottom is in but investors should be cautious as price is below resistance major resistance High Volume Node and R1 weekly pivot.
If the pullback is complete then we have a very shallow wave 2 within wave (II) and can expect much higher targets perhaps in the $1000s before the end of this business cycle. There will resistance at the upper boundary and R3 weekly pivot around $600 and a breakout above that area will signal we go higher.
RSI has plenty of room for months over overextension in price.
I will be looking to add a long so look out for the signal in my Trade Planning Substack.
Safe trading

CLSK, nothing changed, $40+ incoming, 2x minNASDAQ:CLSK is low cap asset and is prone to large volatile swing like we are seeing but also gives way to opportunities.
Price is attempting to breakout the macro triangle upper boundary was rejected at first. Breaking above wave D at $24 is key to trigger the thrust I'm looking for towards $42 and $80 all time High Volume Node after that.
Price has momentum above the weekly pivot 200EMA but currently trapped in a High Volume Node where we expect price to stall before continuing upwards.
RSI can stay in overbought for months.
Participants are still afraid of this asset coming against them and its volatility, a reflection of the broader sentiment of FEAR in retail that is still persisting at all time high. Ridiculous bear market PTSD.
A recipe for MUCH higher. until market wide confidence takes hold.
Safe trading

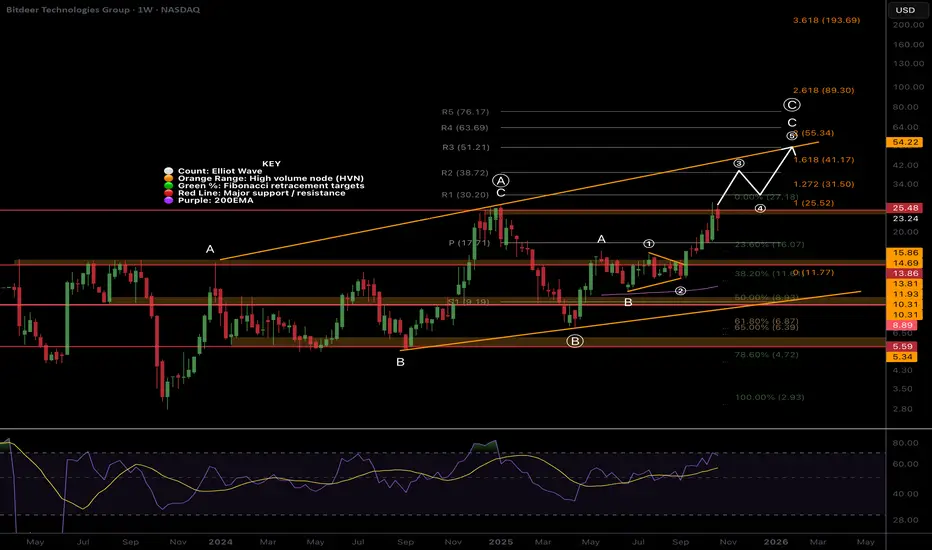
Bitdeer BTDR Macro Outlook. Nothing changed, Min 2x to come $54NASDAQ:BTDR is a low-cap volatile asset so traders and investors should expect wild pullbacks like we are seeing and is feature of these type of assets and is why we can make so much money from them when using the right strategy.
The macro structure is bullish in an Elliot wave ABC as there are many series of 3 wave structures.
Wave (3) of C of (C) is underway with a minimum target of the 1.618 Fibonacci extension $41.17 but price can significantly overextend in these assets.
Terminal target is the channel upper boundary and R3 weekly pivot at $55. A break out above this would be very bullish and could see prices as high as $80+
RSI has months left of upside. Analysis is only invalidated below the 200EMA.
Safe trading
$DOG on Bitcoin A distinct double bottom formation has formed on the chart following the recent decline.
The price reacted strongly to the major support area, and the outlook now indicates upside potential.
Roadmap: Breakout of the neckline.
If it persists above this level, the trend direction should be reassessed.

Bitcoin is now positioned below its main resistance! | Day 10👋🏻 Hey everyone! Hope you’re doing great! Welcome to SatoshiFrame channel.
✨ Today we’re diving into the 1-Hour Bitcoin analysis. Stay tuned and follow along!
👀 Bitcoin has still not succeeded in breaking the resistance zone at $111,458. However, Bitcoin formed a higher low compared to its previous low, which increases the probability of breaking this resistance and gives it a higher win rate for a breakout.
🧮 Pay attention to the RSI oscillator. The 70 zone has maintained its overlap with Bitcoin just like yesterday, with the difference that the RSI support zone is now in the 45 range, which also overlaps with the newly formed higher low.
💰 Bitcoin’s volume in the 1-hour time frame has increased after forming a higher low, meaning this low is being respected by buyers, and the desire to break multi-timeframe resistances has increased. Breaking the current resistance zone requires strong buying volume so that sell orders are filled and some futures orders get liquidated.
✍️ The expected scenario for Bitcoin does not differ significantly from yesterday’s scenario.
🟢 Long Position Scenario
Break the key resistance at $111,458, surpass the 70 level on RSI and enter overbuy territory, accompanied by increased buying volume and a price squeeze.
❤️ Disclaimer : This analysis is purely based on my personal opinion and I only trade if the stated triggers are activated .

Bitcoin playing games at critical levelsBTC is clearly causing the market to capitulate over time. Price capitulation has already been achieved for the most part. The current sideways chop causes many traders to lose focus and exhaust their patience. This is what the market wants. There are some good signs of support at the current H1 structure, but let your guard down, this PA is CRAZY.

Don't sleep on Ethereum!Ethereum is following the pattern seen before the 2021 bull run of Bitcoin, and we are now in the final stages before the parabolic run for Ethereum.
CRYPTOCAP:BTC 2017\2021 vs. CRYPTOCAP:ETH 2021\2025

bitcoin preparing for a strong rally toward 140k$After a brief correction and consolidation near the 103000$ support zone, bitcoin appears to be preparing for a potential rally toward the 140,000$ target.
#btc #bitcoin

BITCOIN + ETH SIGNALS: MASSIVE MOVE INCOMING!!!(Nobody Watching)Yello Paradisers! Enjoy the video!
And Paradisers! Keep in mind to trade only with a proper professional trading strategy. Wait for confirmations. Play with tactics. This is the only way you can be long-term profitable.
Remember, don’t trade without confirmations. Wait for them before creating a trade. Be disciplined, patient, and emotionally controlled. Only trade the highest probability setups with the greatest risk to reward ratio. This will ensure that you become a long-term profitable professional trader.
Don't be a gambler. Don't try to get rich quick. Make sure that your trading is professionally based on proper strategies and trade tactics.

Can BTC Break $111,458 resistance ? - BTC 1H Analysis | Day 9👋🏻 Hey everyone! Hope you’re doing great! Welcome to SatoshiFrame channel.
✨ Today we’re diving into the 1-Hour Bitcoin analysis. Stay tuned and follow along!
👀 On the 1-hour timeframe, we see that Bitcoin is currently below its resistance zone at $111,458. If this level is broken, Bitcoin can move upward toward its next resistance levels.
🧮 The RSI oscillator is currently below the static resistance near level 70, which overlaps with the $111,458 resistance. If the RSI breaks above this zone, Bitcoin can enter overbought territory, making it easier to move toward the next resistance.
🕯 Looking at Bitcoin’s volume, we can see that volume has decreased, and this decline is clearly visible. With the first increase in buying or selling volume, Bitcoin can begin its next move with stronger momentum and potentially cause a price spike.
💵 Today we will also take a look at USDT dominance. The 4.91% support level on USDT dominance overlaps with Bitcoin’s current resistance. If this level is broken, Bitcoin can start its move upward with strong confirmation.
✍️ A complete and clear scenario is now formed for a Bitcoin position, which you can use for your trades in the continuation of this analysis.
🟢 Scenario for Bitcoin resistance breakout 👇🏻
If Bitcoin breaks the $111,458 price level along with RSI crossing above 70 and an increase in buying volume, it can move toward higher price levels.
For this scenario, we also need confirmation from USDT dominance, meaning a break below the 4.91% support zone.
❤️ Disclaimer : This analysis is purely based on my personal opinion and I only trade if the stated triggers are activated .

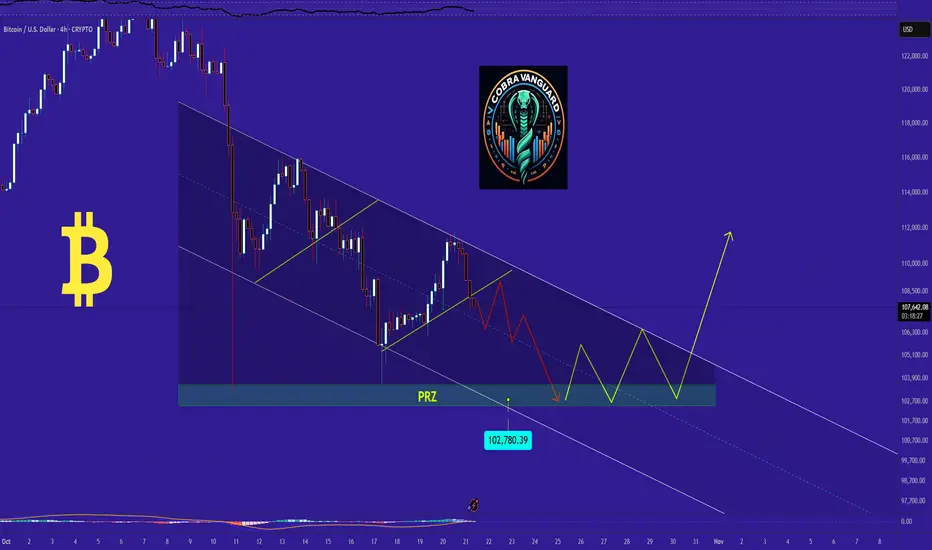
bitcoin Analysis (Update)I believe the price could drop below $103000 and reach the PRZ (Potential Reversal Zone), from which it may start to rise. Additionally, it seems the price is forming a triangle pattern. If this pattern completes, a breakout above the triangle resistance—or the channel—could lead to a strong upward move.
BTC 4H Analysis | Day 8🥳 Hey everyone! Hope you’re doing great! Welcome to SatoshiFrame channel.
✨ Today we’re diving into the 1-Hour Bitcoin analysis. Stay tuned and follow along!
👀 On Bitcoin’s 4-hour time frame, as shown in the chart, we can see that after a series of declines, Bitcoin has consolidated inside a large 4H range (box). This box has been classified by traders and is currently being “priced in” for the market’s next move. For now, price is still some distance from the top of the box, but the mid-range area, where price is currently hovering, could be a good zone for a potential long setup.
⛏ Multi time frame levels (1H and 15M) have already triggered signals for traders, and price is now moving toward $111,144. A breakout above this level could confirm a long entry. However, breaking this resistance may be challenging and could have a lower win rate, so we’ll use a more conservative risk approach for this move.
🧮 Looking at the RSI oscillator, it’s forming a short-term oscillating resistance near the overbought zone. The 65 level aligns beautifully with the $111,144 price resistance, meaning if RSI breaks above this threshold, that resistance could be taken out, allowing momentum to push further into the overbought region.
🕯 Bitcoin’s volume over the past few days has been strong enough to support powerful moves, but the activity has been mostly indecisive, aimed at liquidity collection within the range. If you pay close attention, you’ll notice extremely precise triggers forming at the box’s highs and lows. In short, large amounts of capital that are expected to exit gold are still in a phase of indecision, and Bitcoin hasn’t yet absorbed that risk capital.
🧠 I’m considering two main scenarios for Bitcoin’s position:
🟢 Scenario 1
Breakout above the $111,144 resistance, accompanied by RSI crossing above 65 and a noticeable increase in buy volume, signaling intent for a Bitcoin pump.
🟢 Scenario 2
Set a buy stop with a larger stop size, staying positioned for a gradual breakout. As Bitcoin breaks higher levels, we can scale in with additional volume.
❤️ Disclaimer : This analysis is purely based on my personal opinion and I only trade if the stated triggers are activated .

Bitcoin at the Top of Wedge – Bearish Reversal Coming Again?As I expected in yesterday’s idea , Bitcoin dropped to the $107,800 level, hitting its target .
In the last few hours, BTC started to pump again and is now trading near a cluster of resistances : the 100_SMA(Daily) , the 50_SMA(Daily) , and Cumulative Short Liquidation($117,517-$116,020) . This creates a strong resistance , and I don’t think Bitcoin will easily break through it. ( As of the time of writing, there’s no fresh news influencing the market .)
From an Elliott Wave perspective, it looks like Bitcoin is forming a Triple Three Correction(WXYXZ ).
On the Classical Technical side, Bitcoin is at the top of an ascending broadening wedge pattern , which is a reversal pattern . There’s also a Regular Bearish Divergence (RD-) between the two peaks in this pattern.
I expect that in the coming hours, Bitcoin will start to drop again. After breaking the important $111,000 level , it could fall at least to the lower line of the ascending broadening wedge .
Note: In these past few days, the Bitcoin and crypto market have been quite volatile and driven by news, especially related to US-China tensions. So always manage your risk carefully and avoid impulsive decisions based on sudden headlines.
New CME Gap: $107,690-$107,220
Cumulative Long Liquidation: $107,105-$104,297
Cumulative Short Liquidation: $115,241-$113,454
Stop Loss(SL): $116,200
Please respect each other's ideas and express them politely if you agree or disagree.
Bitcoin Analysis (BTCUSDT), 1-hour time frame.
Be sure to follow the updated ideas.
Do not forget to put a Stop loss for your positions (For every position you want to open).
Please follow your strategy and updates; this is just my Idea, and I will gladly see your ideas in this post.
Please do not forget the ✅' like '✅ button 🙏😊 & Share it with your friends; thanks, and Trade safe.

BITCOIN SIGNAL: NEXT MASSIVE MOVE IN THIS DIRECTION IS FORMING!!Yello Paradisers, I hope you are doing fine. This is a video for you. Enjoy. I hope you are enjoying it. Smash the rocket button if you want. I will see you again next time. You can also share this video. I will be retweeting everybody who gonna mention me and TradingView.
And Paradisers! Keep in mind to trade only with a proper professional trading strategy. Wait for confirmations. Play with tactics. This is the only way you can be long-term profitable.
Remember, don’t trade without confirmations. Wait for them before creating a trade. Be disciplined, patient, and emotionally controlled. Only trade the highest probability setups with the greatest risk to reward ratio. This will ensure that you become a long-term profitable professional trader.
Don't be a gambler. Don't try to get rich quick. Make sure that your trading is professionally based on proper strategies and trade tactics.

ZECUSD - Oh no are we in bear market since 2 weeks ? want to finish on a good working idea before stoping publishing hehe
this double bottom formation has been seen too much time lately
I entered now
SL : 340 for now, will update lower at 310 when white trendline broke down
Also depends on BTC reaction but i think daddy is going to see 100k or sub 100k first before going a bit up (last rejection made me switch bear for some days)
first TP : 155
second TP : 60/70
Cheers not advice

BTC 1H Analysis | Day 7🥳 Hey everyone! Hope you’re doing great! Welcome to SatoshiFrame channel.
✨ Today we’re diving into the 1-Hour Bitcoin analysis. Stay tuned and follow along!
👀 On the one-hour timeframe of Bitcoin, we can see that after last night’s pump, Bitcoin failed to break through the resistance zone at $113,400 and was rejected downward from this area. It’s currently sitting at its support floor around $107,537, and losing this level could lead to a further decline.
🧮 The RSI oscillator has now formed two important zones — 50 and 38 — and when the fluctuation limit crosses these zones, Bitcoin may start its next move with increased volatility.
🕯 Last night, Bitcoin had good buying volume while approaching its resistance, but the key point was that it was then pushed down sharply by heavy selling pressure, losing even its multi–timeframe support floors. Keep in mind that Bitcoin needs an increase in buying or selling volume to break through these identified levels.
🧠 I’ve explained the upcoming Bitcoin scenarios in the following paragraph.
🟢 Long Position Scenario: A breakout of the nearest resistance zone at $109,383, along with the RSI crossing above the 50 level and buying pressure strong enough to absorb all the sell orders in this area.
🔴 Short Position Scenario: The current level Bitcoin is sitting at is a very critical support. Losing this support at $107,537, combined with the RSI dropping below 38 and increased selling pressure, could trigger a continued downward move, pushing Bitcoin toward its lower support zones.
❤️ Disclaimer : This analysis is purely based on my personal opinion and I only trade if the stated triggers are activated .

IS BSV READY FOR NEW CYCLE MOVE TO $100 - 2025Bitcoin SV is showing on the short-term view a trend that can have an upcoming increase in volume. Further checking if SV is going to confirm the $25-28, which can lead to a breakout back to up $40 level.

GOLD – top is in?There are many possible Elliott Wave interpretations regarding the recent years in gold, but one thing seems quite clear. The rise that began in August 2025 was preceded by a triangle, which according to wave theory always signals the final wave of an impulse of the same degree. After it concludes, one should expect a correction of the entire impulsive five-wave sequence, typically retracing to the level of the preceding fourth wave.
In recent days, the media have been filled with images of people buying physical gold — and as we know, the crowd is never right. Could this widespread euphoria be signaling the end of the bull run, at least for a while? Many signs point to that. It is not unlikely that we will soon see capital rotation into crypto.
