Bitcoin can Reverse Sharply After this CorrectionHello traders, I want share with you my opinion about Bitcoin. The market structure for Bitcoin has turned decidedly bearish in the short term, following a significant breakdown from its recent triangle consolidation pattern. This corrective phase began after a failed rally to a new all-time high near 126000, which led to a prolonged and volatile period of price action, including a sharp drop to 102000. Currently, following the resolution of the recent triangle to the downside, the price of BTC is in a clear downward movement. In my mind, this final decline is a capitulation move that is heading towards a major area of historical support. I expect that the price will fall into the main buyer zone. I think that a strong and confirmed reversal from this zone will signal that the entire corrective phase is complete and that buyers are ready to re-take control for the next major trend. This would present a significant long opportunity. Therefore, I have placed my TP for this reversal scenario at the 116000 level, targeting a key area of prior price action and a logical first objective for a new rally. Please share this idea with your friends and click Boost 🚀
Disclaimer: As part of ThinkMarkets’ Influencer Program, I am sponsored to share and publish their charts in my analysis.
Btc-bitcoin

RIOT wave 3 continues, $57 min targetWave 3 continues in NASDAQ:RIOT per previous posts with a minimum target of the $57 High Volume Node

$BTC Bottom soon? Expanded flat?CRYPTOCAP:BTC appears to printing wave Y of a running flat correction (or expanded flat)
The rules?
X pokes above all time high on a large 3-wave move and is often rejected even harder.
Y ends above W, if it goes below it is an expanded flat instead and likely ends just below W. Same outcome….
Also the daily 200EMA, macro support trend-line, High Volume Node support and a pop lower could give hidden bullish divergence in daily RSI.
Daily RSI often does not make it into oversold on Bitcoin.
Safe trading

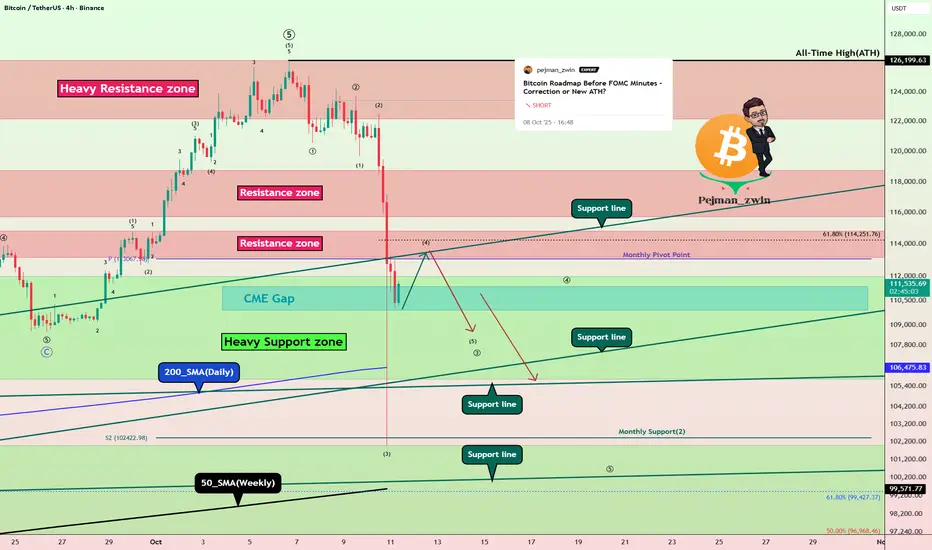
Bitcoin Roadmap: Is a Major Correction the Next Stop?As I expected from the previous analysis , Bitcoin did start to drop and hit its targets .
Now, with the news that the U.S. might impose a 100% tariff on China , we saw Bitcoin sharply sell off last night. Actually, as I mentioned in my previous ideas , the rally from about $109,000 to around $126,199(ATH ) (which was a new all-time high for Bitcoin) had relatively low volume. That was a sign that a correction might be on the way, and last night’s news just acted as a trigger to speed it up.
In fact, what took Bitcoin 10 days to climb was reversed in about 4 days , showing how strong the sellers are right now.
Educational tip: You can use volume candles on TradingView to see which candles had higher volume—the thicker the candle, the more significant the move.
Now, the big question: will Bitcoin keep dropping or bounce back?
Right now, it’s sitting near a cluster of Support lines and close to the daily 200_SMA(Daily) and the 50_SMA(Weekly) , as well as a Heavy Support zone($111,980-$105,820) . Last night’s drop was basically the first test of these supports .
Since it’s the weekend and volumes are usually lower, we don’t expect a huge downward move in the next 48 hours.
Bitcoin might do a pullback to the broken Resistance zone($114,820-$113,180) and then continue its drop.
According to Elliott Wave analysis , Bitcoin seems to be completing a microwave 4 of the main wave 3 .
I expect that after Bitcoin completes , we might see it continue downward and fill the CME Gap($111,355-$109,915) early in the next week.
So, do you think the major correction for Bitcoin has started or not? Let me know what you think!
Note: In case the Support lines break, there’s also a chance that we might see a Death Cross (where the 50-day moving average crosses below the 200-day moving average), which could signal further bearish momentum.
Note: Around the $108,000 level, we have huge buy orders stacked up, which might act as a significant support zone.
Please respect each other's ideas and express them politely if you agree or disagree.
Bitcoin Analysis (BTCUSDT), 4-hour time frame.
Be sure to follow the updated ideas.
Do not forget to put a Stop loss for your positions (For every position you want to open).
Please follow your strategy and updates; this is just my Idea, and I will gladly see your ideas in this post.
Please do not forget the ✅' like '✅ button 🙏😊 & Share it with your friends; thanks, and Trade safe.
BTC/USDT – Downtrend ContinuesBitcoin is facing downward pressure after the escalation of US-China trade tensions. Although President Trump made more conciliatory remarks, which helped ease short-term concerns, the global economic uncertainty remains a major factor driving BTC/USDT into a downtrend.
On the chart, BTC/USDT is moving within a clear downtrend channel. Despite a slight recovery, the price is currently fluctuating around $113,129 and could continue to adjust towards the 106,500 USD and 101,800 USD targets in the near term.
With ongoing macroeconomic instability and no strong signs of recovery, Bitcoin may continue to decline in the short term.

ETH Game Plan – FTKZ ModelETH Game Plan – FTKZ Model
📊 Market Sentiment
After the sharp 10/10 crash triggered by Trump’s 100% tariff announcement on Chinese imports, altcoins saw heavy liquidations some exceeding -80%.
On 12/10, Vice President Vance clarified Trump’s remarks, causing a temporary rebound.
However, Trump’s 15/10 statement reaffirming a trade war with China reignited selling pressure.
Sentiment remains bearish, as volatility and geopolitical risk continue to shape short-term direction.
📈 Technical Analysis
ETH maintains a bullish structure on the weekly timeframe.
If the weekly candle closes below 3350$, it would signal a potential bearish reversal.
Price is currently retracing toward the HTF Key Zone, aligning with both an FFVG and HTF trendline confluence ideal for long setups if support holds.
📘 Model to be used – FTKZ Model (HTF FFVG + Trendline + Key Zone)
1️⃣ Determine the HTF weekly trend — trade only in that direction.
2️⃣ Identify the HTF Fair Value Gap (FFVG) that price may rebalance.
3️⃣ Confirm confluence with HTF trendline support.
4️⃣ Locate the HTF Key Zone showing strong order flow.
5️⃣ Enter after LTF confirmation.
📌 Game Plan
I will be watching ETH to test the 3350$ HTF Key Zone (weekly swing liquidity & monthly FFVG).
If the weekly close forms back above 3350$, I will expect continuation toward higher levels.
🎯 Setup Trigger
Weekly close above 3350$ confirming bullish continuation.
📋 Trade Management
Stoploss: Weekly close below 3350$
Targets: TP1: 4300$ | TP2: Bearish Trendline
Move stoploss to breakeven after TP1 hits.
💬 Like, follow, and comment if this breakdown supports your trading! More setups and market insights coming soon — stay connected!
⚠️ Disclaimer: This content is for informational and educational purposes only and does not constitute financial, investment, or trading advice. Always DYOR before making any financial decisions.

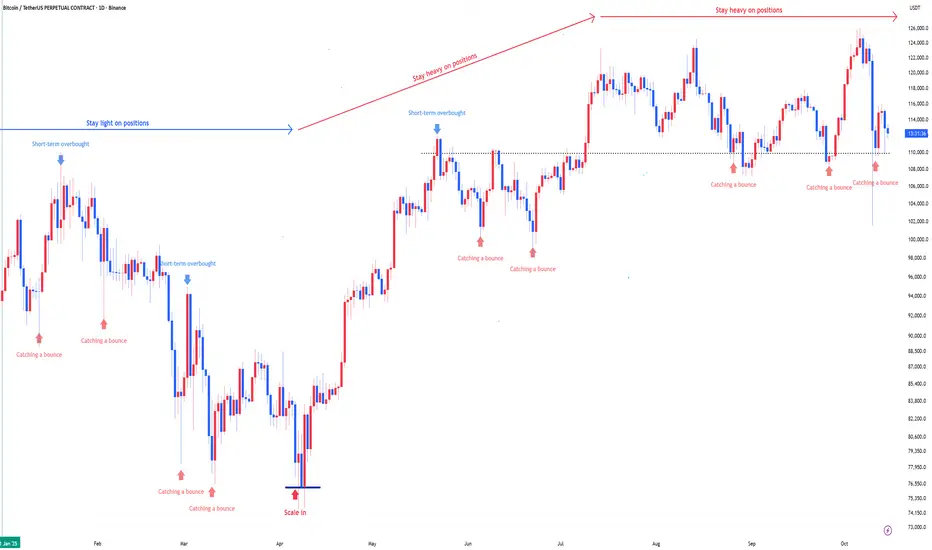
Bitcoin : Stay heavy on positionsBitcoin : Stay heavy on positions (3x)
Maintaining the same outlook as before.
** This analysis is based solely on the quantification of crowd psychology.
It does not incorporate price action, trading volume, or macroeconomic indicators.
Bitcoin is going to the hell???hi follow me , boost this post and read
everything shows me that bull trend is over , weakness in highs , candles and the momentum
the targets for retracement is 83 to 74 and after that 50k
i know its hard to hear that but this is market he do what he wants so accept it.
thank you. i reply to questions anytime.

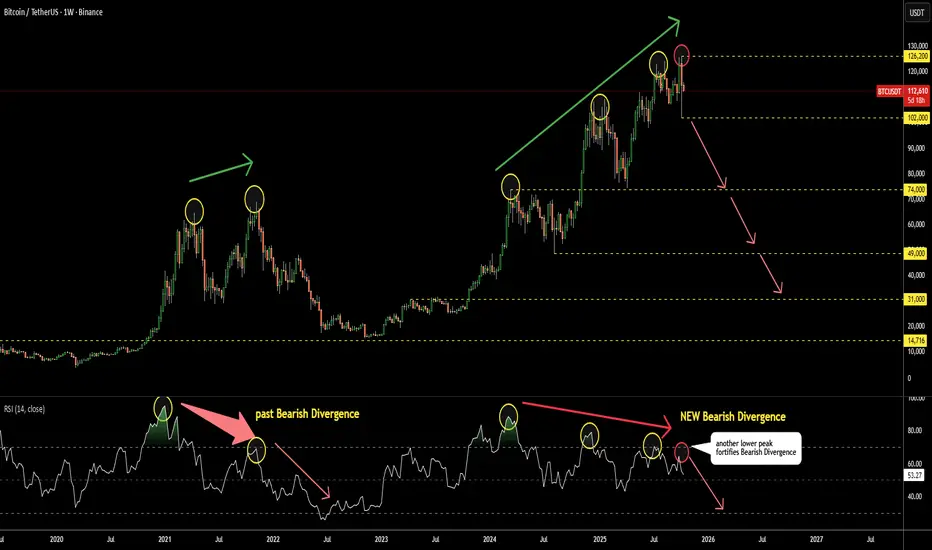
Bitcoin Update: Bearish Divergence on RSI Only Deepens This is a brief update to the analysis shared in August. The RSI has now formed a fourth consecutive lower peak on the weekly chart, further confirming the bearish divergence.
Monitor the RSI closely — a break below 50 (currently at 53) could signal the onset of a bear market.
The first key support level is near 102K, and a decisive move below this level would strengthen the bearish outlook.
Bitcoin Eyes $116.6K Breakout Confirmation📊 Market Update — Bitcoin (BTC/USDT)
BTC has successfully confirmed the low time frame zone, holding steady above both the support and volume range, which signals continued short-term strength.
Currently, price action is consolidating within the upper boundary of the range — a sign of buyer absorption before potential expansion.
🔹 Key Level to Watch: $116.6K
This level acts as an important confirmation point — a 1-hour (or higher) close above this zone could validate a breakout continuation, opening the path toward the $120K–$125K range.
If BTC sustains this structure, the bullish momentum remains intact, with low time frame structure aligning with higher trend support.
📈 Bias: Bullish Continuation
🎯 Next Targets: $116.6K → $120K → $125K

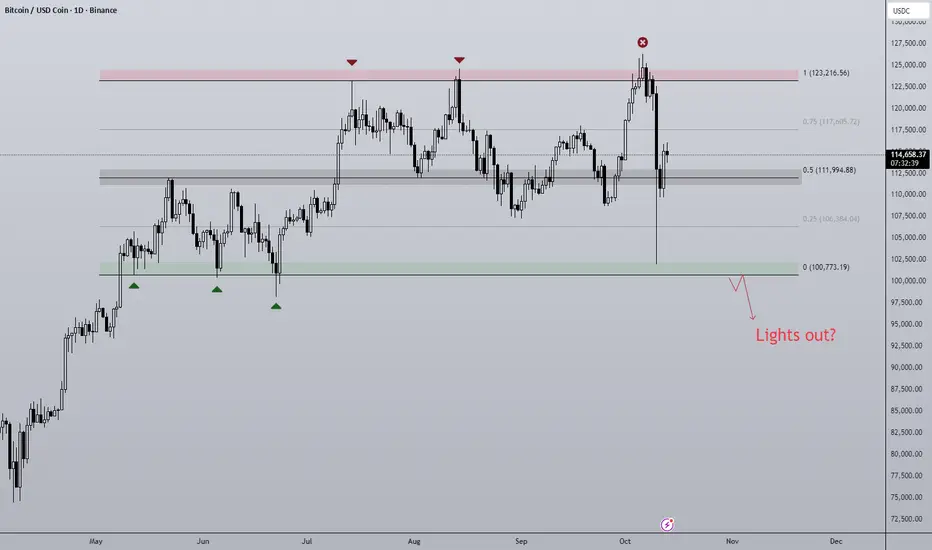
Post Flash-Crash BTC Despite such a large sell-off event, has the outlook on BTC actually changed? Structurally BTC remains very much rangebound with two clearly definable halves of the range. That is until Fridays move off the back of a Tariff Tweet from President Trump causing a liquidation event similar to that of April earlier this year and the Covid crash of 2020.
Bitcoin was less effected when compared to altcoins as is usually the case, some majors dropping as much as 80% in a single 1h candle! An entire bear market in an afternoon. Bitcoin on most exchanges fell roughly 20% on the news and eventually found support at range lows ($100,000), a significant amount of this drop got bought up and so BTC finds itself hovering around range midpoint.
To me this is a no trade zone initially, there is no clear directional bias that is actionable at this time but I am looking for clues as to where price may be going next:
- Should BTC stay above midpoint the next clear resistance level is 0.75 ($117,605). On the lower time frames the trend is bearish, 0.75 would be a good place for the bears to defend.
- A loss of the midpoint would open the door to backfilling the wick, this could get ugly as on the higher time frames a new lower low and price acceptance lower would signal a bearish shift in structure. Calls for "the top is in" will get much louder and so will the 4 year cycle theory comparisons.
- A V-shaped recovery and move straight to the highs would be max pain after such a brutal move down. Although IMO it's the least likely I would not rule it out.
BITCOIN SIGNAL: ROUND 2 OF CRASH INCOMING!!!? (watch out) Yello Paradisers! Enjoy the video!
And Paradisers! Keep in mind to trade only with a proper professional trading strategy. Wait for confirmations. Play with tactics. This is the only way you can be long-term profitable.
Remember, don’t trade without confirmations. Wait for them before creating a trade. Be disciplined, patient, and emotionally controlled. Only trade the highest probability setups with the greatest risk to reward ratio. This will ensure that you become a long-term profitable professional trader.
Don't be a gambler. Don't try to get rich quick. Make sure that your trading is professionally based on proper strategies and trade tactics.

$BTC Trend Continues.Bitcoin is still holding onto its upward trend. The recent move should be seen as a healthy correction within the main uptrend. After being rejected from the supply zone, the price got a strong bounce off the major demand zone, showing that buyers are still in control.
Short-term fluctuations are essentially noise, especially for those not engaging in margin trading. The macro trend remains positive; such pullbacks serve as fuel for the next run.
BTC remains strong, trend up, momentum alive.

BTC – Bounce Off Daily Support, Eyes on Supply!Bitcoin has bounced from the daily support area (the broad green zone around $110K–$112K), reclaiming the intraday breakdown zone near $114K and turning it into support on lower timeframes.
As long as price holds above $112K–$113K, the short-term bias remains constructive and I am looking for continuation toward $118K, followed by the $121K–$122K supply zone highlighted on the chart.
The bulls will remain in control as long as the $107,500 mark holds as support.
⚠️ Disclaimer: This is not financial advice. Do your own research and manage risk.
All Strategies Are Good; If Managed Properly!
~Richard Nasr.

BTC 15M Analysis - Key Triggers Ahead | Day 55☃️ Welcome to the cryptos winter , I hope you’ve started your day well.
⏰ We’re analyzing BTC on the 15-Minutes timeframe .
👀 On the 15-minute timeframe for Bitcoin, we can see that after breaking out and consolidating above the $114,351 zone, BTC began moving upward and is now trading within a 15-minute range. A breakout from this range could trigger the next move. The top of this trading range sits at $115,715 and the bottom at $114,750 — breaking and holding beyond either level could start a strong leg for Bitcoin as the new week begins.
🧮 The RSI oscillator on the 15-minute timeframe shows Bitcoin currently moving within a range capped at 64 on the top and 42 on the bottom. A breakout from this RSI range could significantly increase buying or selling momentum, adding fuel to Bitcoin’s next move.
🕯 The size, volume, and count of green candles have increased since the flash crash, and institutions like BlackRock, World Liberty, and Trump-aligned funds have been averaging solid buy positions. With rising buying volume, Bitcoin could break through its ticker-seller resistance at $115,715 and continue its bullish move following the recent dramatic flash crash.
🔍 Despite concerns like the ongoing U.S.–China economic (tariff) war, the market remains in a risk-off mode on higher timeframes. If entering trades, we aim to manage capital across multiple entries — for example, allocating only 0.25% risk per position or averaging in gradually.
🧠 Two trading scenarios are considered for Bitcoin, both offering clear opportunities for structured entries.
↗️ Long scenario (breakout above the range):
If Bitcoin breaks above $115,715 with rising buy volume and RSI crossing above 64, it could initiate another strong bullish leg toward higher resistance levels.
📉 Short scenario (breakdown below the range):
If the micro-buyer support at $114,750 — a key demand zone — breaks, Bitcoin may extend its correction downward. This move should coincide with RSI losing the 42 level and increasing sell volume. Note: in short positions, take profits quickly and maintain tight risk-to-reward control.
❤️ Disclaimer : This analysis is purely based on my personal opinion and I only trade if the stated triggers are activated .

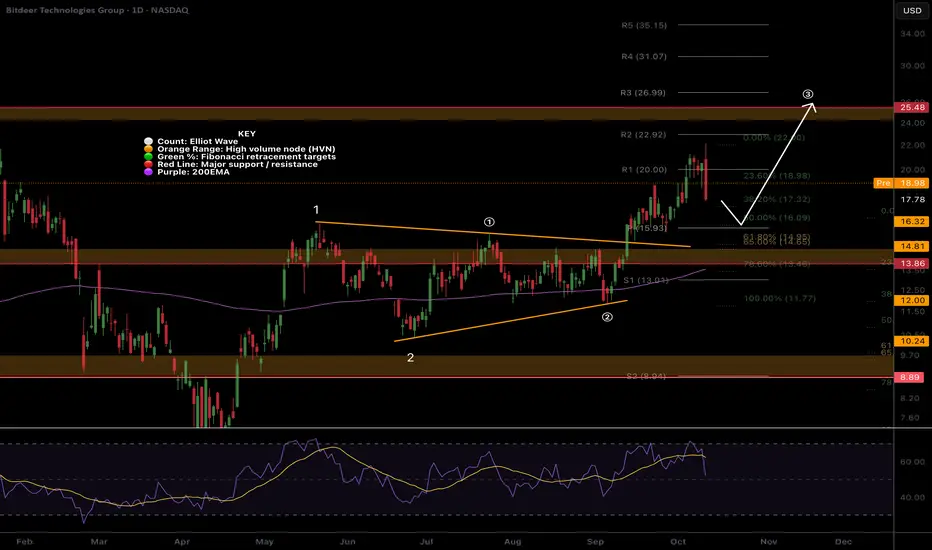
BTDR Volatile, but uptrend intactNASDAQ:BTDR had a huge bearish engulfing candle Friday. I keep my positions smaller on these assets.
Price is still in a wave 3 breakout towards the $25 High Volume Node target. It appears wave (1) of 3 is complete with a wave (2) target of the daily pivot and 0.5 Fibonacci or golden pocket zone nearby. That would also test the untested wave 1 high as support a highly likely event.
RSI has reset to the EQ where it often finds support in a strong uptrend.
Safe trading
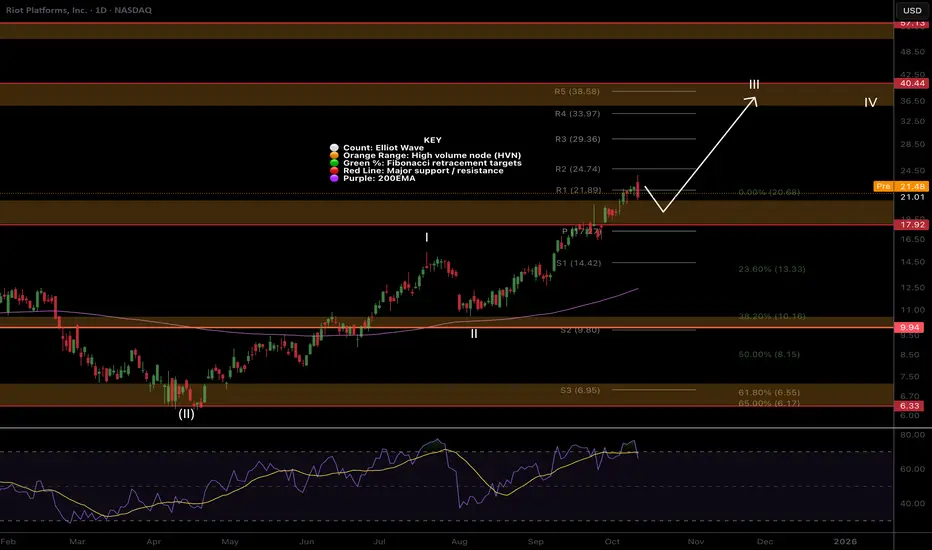
RIOT.. Nothing changed, $40 targetNASDAQ:RIOT broke out through resistance earlier than expected! A retest of the High Volume Node as support is highly likely event and price has a little down to go to get there. It may even be front run today.
RSI is overbought with no bearish divergence and can persist here for months in trending asset.
Wave II is underway and the next target is $40 High Volume Node resistance and the R5 daily pivot.
Safe trading
BTCUSDT – When the U.S.–China Trade War Fills Bitcoin’s SailsTrade tensions have resurfaced after U.S. President Donald Trump announced a 100% tariff on Chinese exports. The renewed fear of a trade war has pushed investors toward decentralized assets like gold and Bitcoin as a hedge against uncertainty. While the USD saw a slight uptick, the risk-off sentiment has driven capital into BTC — now viewed as a modern safe-haven asset.
On the daily chart, BTC continues to maintain its bullish structure within a broad ascending channel that has been in place since June. After a sharp drop to the $108,000 support zone, strong buying pressure quickly stepped in, forming a long-tailed candle — a clear sign that the bulls are still in control. If the price holds above $110,000, BTC is likely to extend its recovery toward the next major resistance around $128,000 in the coming weeks.

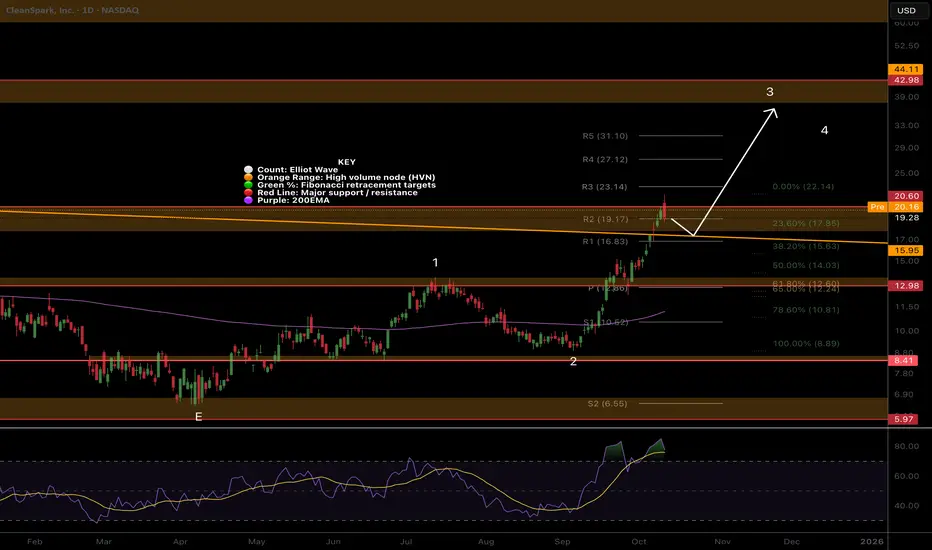
CLSK Rejected at thr major resistance, higher to go CLSK hit our first take profit target at the major resistance High Volume Node but has broken out of the macro triangle structure hinting at a big move still to come! Nothing concerning for me yet happening.
Wave 3 is underway to a minimum target of the $40 High Volume Node
RSI is overbought but no divergence and this can persist up here for months.
Safe trading
COIN Still following the plan.... nothing changedNASDAQ:COIN was expected to test the High Volume Node and channel upper boundary after its breakout as support. That happened Friday and touched it precisely during the market chaos we expect to reverse back to trend this week.
Wave V is underway, wave IV completed at the 0.382 Fibonacci retracement and High Volume Node - a high probability area for a bottom.
RSI tapped overbought but no bearish divergence.
The gap has been filled and could market a reversal point lower on the macro and we should watch carefully but the trend is up for now.
Safe trading

BTC Game Plan - DTB ModelBTC Game Plan – DTB Model
📊 Market Sentiment
After the sharp 10/10 crash triggered by Trump’s announcement of up to 100% tariffs on Chinese imports, risk assets — especially altcoins — faced massive liquidation, with some dropping over 80%.
As of 12/10, headlines indicate that Trump may reach out to President Xi, with Vice President Vance clarifying the statement. The market reacted bullishly, showing a strong rebound.
However, sentiment remains neutral, as volatility persists and geopolitical uncertainty continues to influence short-term direction.
📈 Technical Analysis
BTC retraced into the HTF Demand Zone, running the daily swing liquidity inside it.
Additionally, price retested the bearish trendline, confirming it as a key technical pivot.
Currently, BTC is attempting to recover toward the equilibrium (0.5 Fibonacci) of the recent decline.
📘 Model to be used – Demand to Trendline Break (DTB Model)
1-Identify HTF trend and valid demand zones.
2-Wait for liquidity sweep inside demand for energy confirmation.
3-Watch for price recovery toward equilibrium (0.5 fib).
4-Confirm with a strong close above bearish trendline and equilibrium for entry signal.
📌 Game Plan
I’ll be waiting for BTC to break and close above the 0.5 Fibonacci (equilibrium) and the orange bearish trendline. That will be the first confirmation that the bearish phase may end, and momentum may shift to the upside.
🎯 Setup Trigger
Daily strong close above the orange bearish trendline and 0.5 Fibonacci equilibrium level.
📋 Trade Management
Stoploss: Below $107,500 (protecting capital is more important than chasing profits)
Target: $126,300 (near previous all-time highs)
💬 Like, follow, and comment if this breakdown supports your trading! More setups and market insights coming soon — stay connected!
⚠️ Disclaimer: This content is for informational and educational purposes only and does not constitute financial, investment, or trading advice. Always DYOR before making any financial decisions.

Crypto Total Market Cap AnalysisHi Team!
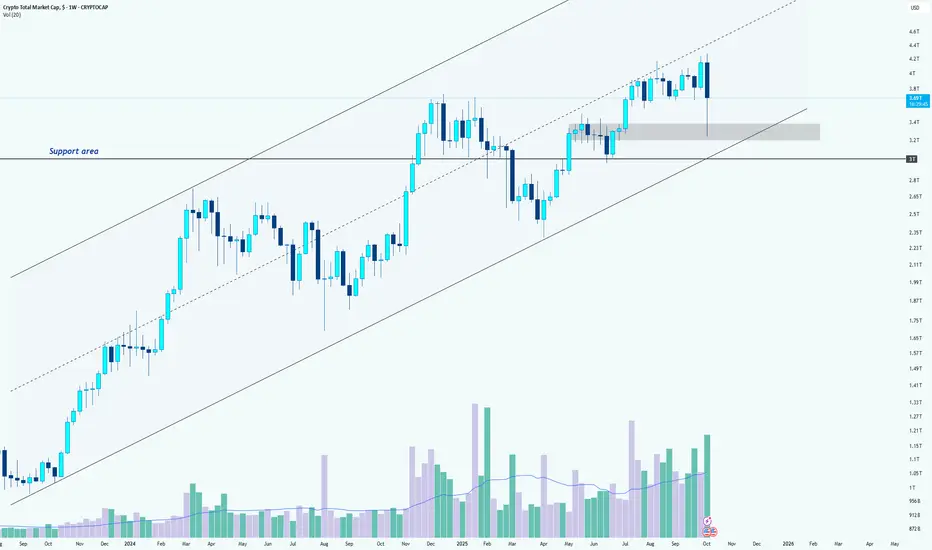
The crypto market continues to show impressive strength, maintaining its position inside the long-term ascending channel. Despite the recent correction, the overall structure remains bullish as long as the lower boundary of this channel holds.
After facing resistance near the upper line of the channel, the total market cap experienced a healthy pullback, which brought it close to the mid-zone of the structure. Buyers stepped in strongly from that area, suggesting that market participants still see dips as opportunities rather than warning signs.
The key support zone lies between 3.1T and 2.84T USD, a region that has acted as both a breakout base and a demand area in the past. As long as this zone remains intact, the broader bullish momentum is likely to continue, keeping the medium- to long-term outlook positive.
If price action stays within the rising channel and the 2.84T support area holds, the total crypto market cap could soon retest the upper trendline, potentially pushing toward new highs.
However, a confirmed breakdown below 2.84T would signal a shift in structure, opening the door to a deeper correction phase.
$BTC Double Top - Business Cycle & Global Liquidity Analysis TWIN PEAKS 🎄🌲
How the Business Cycle Supercharges Liquidity (and Crushes Cycles
Many of you may remember my BTC cycle thesis I wrote ~1.5 years ago. It was based solely on technical analysis covering previous cycles and did not take into account macro conditions such as global liquidity and the business cycle.
While that has been a guiding light to get me to this point, after further macro analysis, my views have changed a bit.
Based on my technical analysis, a price target north of $200k remains for CRYPTOCAP:BTC , but I now believe we will see some sort of a DOUBLE TOP like we did in 2021; this time in mid-December 2025 and late-March / early April 2026.
The December 2025 top will fulfill the “4-Year Cycle prophecy” which has been fueled by the current boom in global liquidity.
Whereas the March / April 2026 top will come from a booming business cycle (measured by the ISM PMI); something we have yet to see.
As you can see in the 2017 and 2021 cycles, the business cycle cues Alt Season.
I don’t think we see a real one without it.
That’s where people spend the money they made through safer assets such as Gold > Stonks > ₿itcoin etc.
We saw Altcoins, NFTs, Sports Cards, Sneakers, Watches, Collectibles etc go parabolic during this time in 2021. And it just so happened that the market for a lot of these high-risk assets topped around that time.
Here's a link to a Michael Jordan rookie card in PSA 9 condition that peaked around February 2021 right before the business cycle topped.
www.psacard.com
I think Altcoins went on for a bit longer after the business cycle topped because they were native on-chain and had less friction to transact (crime season anyone?).
NFTs saw sustained speculation because of the novelty and innovation they were bringing to the space. NFTs should act more like traditional risk assets this time around, and top slightly after the business cycle.
THE FURTHER WE ARE IN THE BUSINESS CYCLE, THE FASTER LIQUIDITY REACHES RISK ASSETS.
Think about it… everyone and their mother are making a ton of money from a booming business cycle ie hairdressers, uber drivers, personal trainers etc and dumb money finds high-risk assets near instantly. We see this with an uptick in google searches, youtube views etc.
This is why global liquidity with a 10-12 week lead overshoots cycle tops in the past.
An immense amount of Global QE in 2021 created an outlier for a continued pump in liquidity, even after the business cycle topped.
Then in the bear market, liquidity deviates from risk assets again as money moves back to safe havens first such as GOLD, which is a near 1:1 injection, and we see ₿itcoin lag by 10-12 weeks.
We should continue to see large caps do well for the remainder of the year as money slowly rotates out of BTC into ETH, SOL, BNB etc, but small caps don’t start to outperform until the business cycle starts convincingly rising well above 50.
Alternative investments such as sports cards are starting to see a similar rotation. Michael Jordan is the ₿itcoin of sports cards, and many of his cards are well above 2021 all-time highs. Other high-end cards from GOATs such as Tom Brady, Mickey Mantle, Wayne Gretzky etc continue to shatter prior records.
NFTs are also starting to see a resurgence with high-end collections such as Crypto Punks, X-Copy etc.
I’m not completely sure if the first or second top will be higher for CRYPTOCAP:BTC yet, but I’m leaning towards the first one in December.
The aforementioned riskier assets should get the lion’s share of business cycle capital in March / April.
At this nexus we will see the Treasury General Account refill suck liquidity out of markets due to tax season. TGA refills have marked previous tops in 2017 and 2021, so I see no reason for this time to be different.
Yes, this will be a much shorter business cycle, which is caused by a historic amount of money printing during the pandemic. The outcome left the US economy in a high-inflation / high-interest rate environment.
The business cycle represents Main Street, and it is clear that the aftermath of the pandemic has crushed middle and lower income households.
~FIN~
JK
POST REFERENCES:
-The 4-Year Boom and Bust Cycle is by design
-Synchronized Bear Market Bottoms
-If you want to dive deeper into the current macro landscape, you should definitely read the playbook I wrote ~10 months ago. It’s been playing out near-perfectly.
