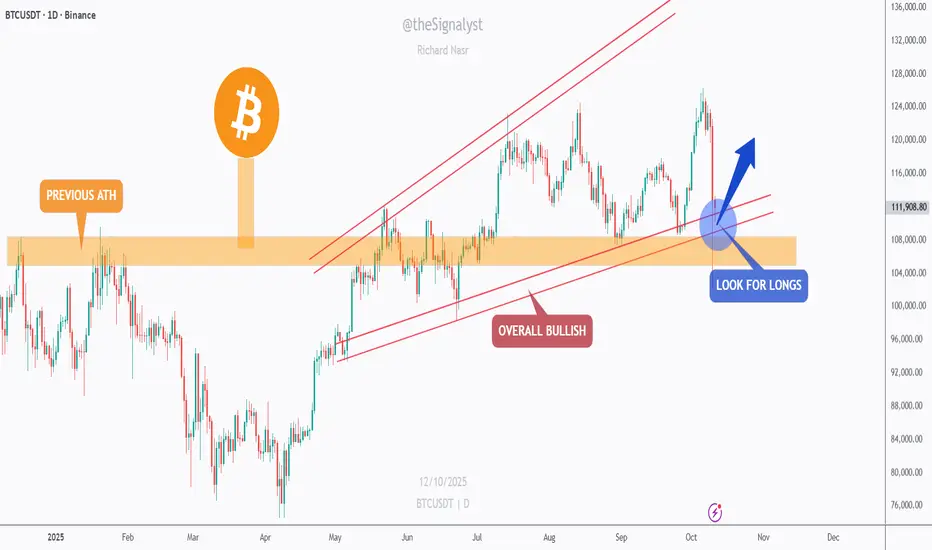
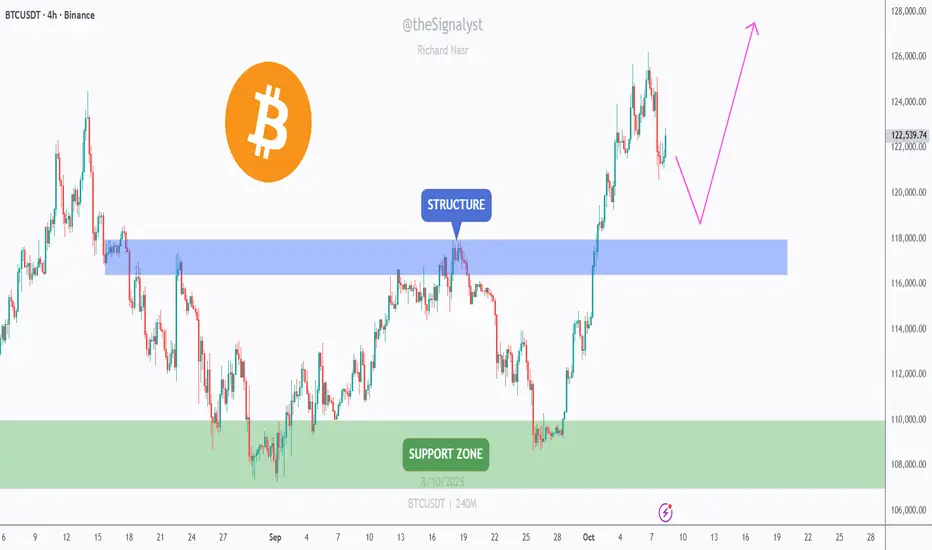
BTC – Bulls Still in Control, As Long As the Intersection Holds!CRYPTOCAP:BTC is retesting a major confluence zone, the intersection of the rising red trendline and the previous ATH structure around $110K–$112K.
This zone has acted as a strong pivot multiple times, and as long as it holds, the overall bullish trend remains intact.
Bullish scenario: Look for trend-following longs near the current intersection, targeting the upper red trendline around $125K.
Bearish invalidation: A daily close below $107K would break the confluence and signal a potential shift in momentum.
📈 The structure is still clean, a healthy correction within an ongoing bullish cycle.
⚠️ Disclaimer: This is not financial advice. Always do your own research and manage risk properly.
📚 Stick to your trading plan regarding entries, risk, and management.
Good luck! 🍀
All Strategies Are Good; If Managed Properly!
~Richard Nasr
Btc-bitcoin
Bitcoin Facing Channel Resistance: Another Drop Ahead?Hello guys!
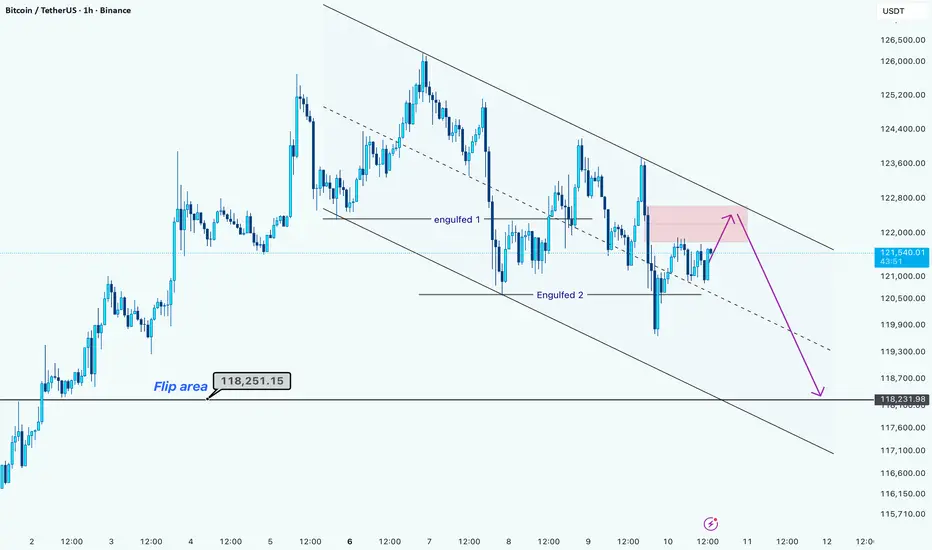
BTC is currently moving within a descending channel, showing consistent lower highs and lower lows, confirming a short-term bearish structure. The price continues to respect this channel, and until a clear breakout occurs, the downward bias remains intact.
Key Observations:
Two bearish engulfing (Engulfed 1 & Engulfed 2) have marked strong rejections from the upper boundary, reinforcing seller dominance at higher levels.
After the second engulfing, the price rebounded slightly, forming a minor pullback within the channel.
The upper boundary around $122,200–$122,500 is acting as dynamic resistance, aligning with the trendline.
Short-Term Expectation:
BTC could potentially push once more toward the upper boundary of the channel (around $122,200), where sellers may re-enter.
If the resistance holds, a continuation toward the $118,200–$118,300 support zone is expected, which aligns with the lower boundary of the channel and previous reaction levels.
Levels to Watch:
Resistance: $122,200 – $122,500
Support: $118,200 – $118,300
Breakout confirmation: A clean close above $122,500 could invalidate the bearish setup and open the way for a short-term bullish correction.
Bias: Bearish below $122,500
Buy Stop ideaThe liquidity grab caused by trumps 100% tariffs on china has fueled enough liquidity for price to revert back to 120k.
If price doesn’t trigger our stop order before 21st of October then price has more liquidity inducement to carry out before the move so we delete the untriggered order

$BTC.D Head and Shoulders + Death CrossWho remembers when I put out this Head & Shoulders idea for CRYPTOCAP:BTC.D September 2nd? 🤓
On the verge of the 20 / 50 WMA Death Cross ☠️
This SHOULD be the top for ₿itcoin Dominance.
Does not mean that it won't float around here for a few weeks tho 🫶

BITCOIN SIGNAL: NEXT TARGET REVEALED!! (scary) Yello Paradisers! Enjoy the video!
And Paradisers! Keep in mind to trade only with a proper professional trading strategy. Wait for confirmations. Play with tactics. This is the only way you can be long-term profitable.
Remember, don’t trade without confirmations. Wait for them before creating a trade. Be disciplined, patient, and emotionally controlled. Only trade the highest probability setups with the greatest risk to reward ratio. This will ensure that you become a long-term profitable professional trader.
Don't be a gambler. Don't try to get rich quick. Make sure that your trading is professionally based on proper strategies and trade tactics.

Bitcoin - KEY support is at 118kBitcoin - KEY support is at 118k
taht's a POC of a range + vwap from siwng low
that level should work as powerful support or trend woudl reverse
i`ll take LONG in a case of local CONFIRMATION

$DOGE \ $BTC CRYPTOCAP:DOGE ➚ CRYPTOCAP:BTC
Dogecoin is moving towards the upper band of the bullish falling wedge formation it has been trading within for some time, and if a breakout occurs, it will create the potential for a significant run against BTC.
Expectations are high, but approval is at a breaking point!

BTC - Distribution after ATH sweepMarket Context
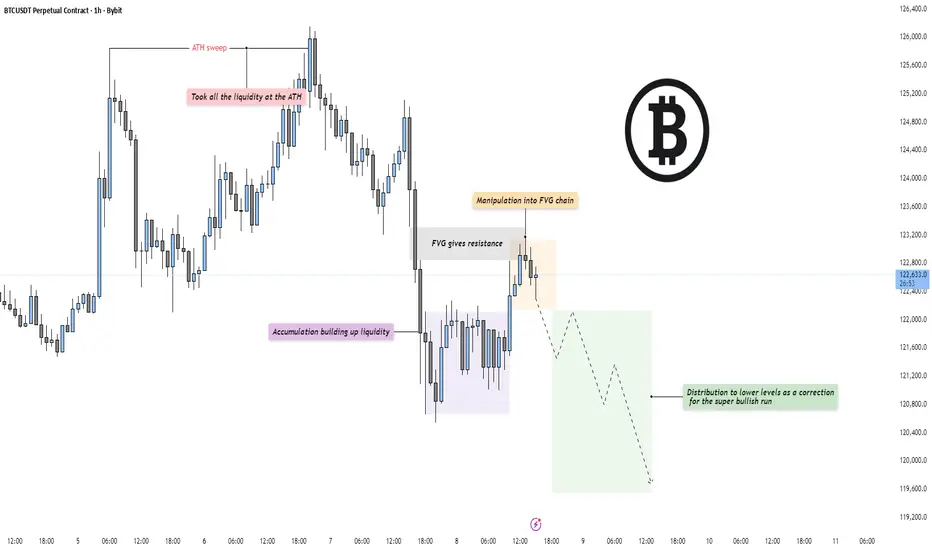
Bitcoin has completed a clear liquidity sweep at the all-time high (ATH) and is now transitioning into a corrective phase. After taking all the liquidity above the prior high, price aggressively rejected and shifted structure to the downside, signaling that smart money may now be engineering a retracement. The move lower has found a temporary pause within a lower accumulation zone where liquidity is rebuilding.
Fair Value Gaps & Manipulation
Following the ATH sweep, price manipulated back into a fair value gap (FVG) chain, where it met resistance. This area acted as a precise reaction point, rejecting further bullish attempts and confirming the FVG as an active supply zone. Each touch into this chain has resulted in lower highs, supporting the idea that distribution is underway. The fair value gaps below are likely to be targeted next as price seeks efficiency.
Liquidity Dynamics
Liquidity above has already been collected — the current draw now lies beneath. The accumulation zone below current price holds resting sell-side liquidity, and the market could aim to fill those inefficiencies before finding new demand. A retracement into these lower levels would act as a healthy correction to the prior bullish impulse, maintaining structural balance.
Final Thoughts
The market has shifted from an aggressive expansion phase to a potential distribution stage. With liquidity taken at the highs and FVGs now providing resistance, the bias leans toward a corrective move lower before any renewed bullish continuation. A break below the local accumulation floor would confirm deeper targets.
If this breakdown helped clarify the current BTC structure, a like is always appreciated — and let me know: are you positioning for the correction, or waiting for the next bullish leg to form?
$BTC Preparing for a new run.Bitcoin continues to progress steadily within its long-term rising channel. The price is currently consolidating at the lower band of the channel, gathering strength for the next strong upward wave.
On the downside, momentum has been held by the major descending trend resistance that has persisted for months. A break above this resistance line would signal a strong shift in momentum, as seen in the past.
The technical structure is creating simultaneous bullish potential on both the price and momentum sides, signaling that the bull run will be more intense in the coming period.
The rising channel is being maintained.
Momentum is poised to break out.
Bitcoin (BTC), End of Cycle Season Based on Cycle DurationBINANCE:BTCUSDT
Bitcoin appears to have already formed its peak within the current bullish cycle and may now be preparing for a correction.
Alternatively, if BTC makes another attempt to reach a new all-time high within October, that period could mark the final peak of this cycle.
Looking at historical data, Bitcoin has shown a repeating pattern —
an uptrend lasting approximately 3 years and 11 months (1,065 days) from the bottom,
followed by a downtrend of about 1 year (365 days) from the peak.
During down cycles, the cycle low has typically formed between the EMA 50 and EMA 100.
Backtesting monthly charts shows that Bitcoin often breaks below the EMA 50, finds support above the EMA 100, and then breaks through the Ichimoku Cloud, signaling the start of a new bullish cycle.
Become an early follower and be part of the journey.🚀
I am Korean and I used Google Translate.

RIOT Continues in Wave 3. Resistance? What resistance?NASDAQ:RIOT shot straight through resistance now support with only a small consolidation. The path should be clear for a stronger move towards $38

CLSK Breaking out!CLSK continues with momentum closing above the macro triangle upper boundary trend-line and now testing the last resistance before a breakout! This will coincide with a break above wave D and flip the macro structure bullish bringing in more capital!
Daily RSI is overbought with slight bearish divergence but can remain this way for weeks in a strong uptrend!

Gold Showed the Way... Is Bitcoin Next?Gold began a parabolic run after breaking through the Fibonacci 1.382 – 1.414 zone.
Now Bitcoin is gathering strength at the same threshold...
Historical similarity in setup
Gold broke through and became parabolic.
Next up Bitcoin
History often maps out the future.
Bitcoin, the “digital gold,” is preparing for its own run.
CRYPTOCAP:BTC Vs. TVC:GOLD 🔃

$BTC is heading towards a parabolic expansion phase.Bitcoin once again formed a “higher low” (HL) in its long-term uptrend, showing a strong reaction from the demand zone.
It tested the last supply zone at $124,5k and was rejected. Sustained movement above this zone will trigger the start of a parabolic expansion phase.
The trend's direction is clear higher lows, higher highs.

Elliott Wave + Gartley Harmonic: Why Bitcoin May Correct Soon!?Bitcoin( BINANCE:BTCUSDT ) has shown strong bullish momentum over the past week, climbing nearly +10% and testing key resistance zones . Several fundamental and technical factors fueled this rally.
Key Drivers of the Rise:
ETF inflows – Significant net inflows into spot Bitcoin ETFs boosted demand.
Macro uncertainty – U.S. government shutdown risk and weaker job data supported risk assets.
Monetary policy – Expectations of softer Fed policy improved market sentiment.
Derivatives impact – Options expiry, high OI, and short squeezes added upward pressure.
Exchange outflows – Lower BTC supply on exchanges signaled accumulation.
Positive sentiment – “Uptober” narrative and bullish analyst targets lifted confidence.
-------------------------------------------
Now, if we look at the Bitcoin chart in the above timeframes from a technical analysis perspective , we can see the following:
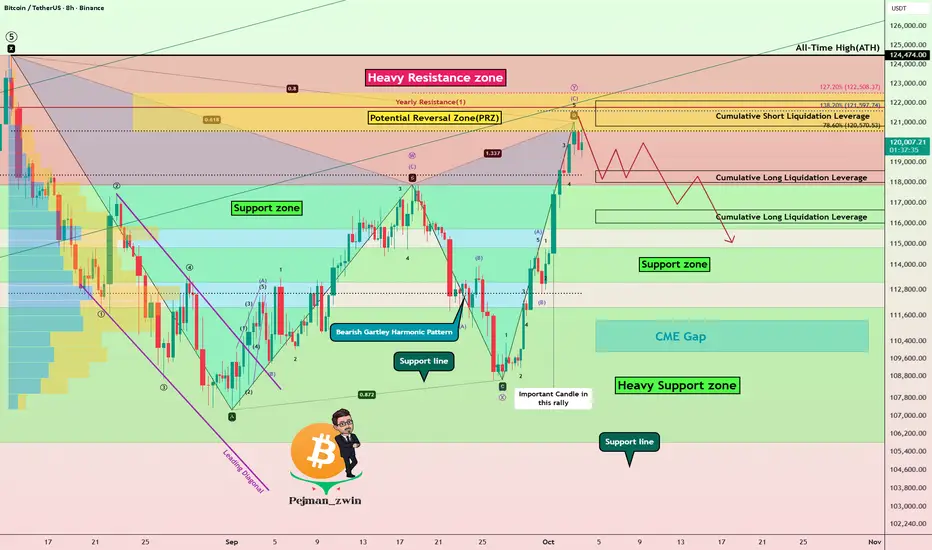
First of all, let me say that the rally that Bitcoin has had over the past 7 days has NOT been accompanied by high volume, and this is not good news for Bitcoin to create a new All-Time High(ATH) .
Bitcoin is entering a Heavy Resistance zone($124,474(ATH)-$117,900) and is moving near the Potential Reversal Zone (PRZ) and Cumulative Short Liquidation Leverage($122,120-$120,823) .
In terms of Elliott Wave theory , Bitcoin appears to be completing a microwave C of the main wave Y . One of the reasons I saw the waves as corrective , other than the microwaves, was the low volume of Bitcoin in the past 7-day rally .
If we look at the Bitcoin chart from a pattern perspective , the important Bearish Gartley Harmonic Pattern is also well and standardly defined on the chart, such that point D in the PRZ can be completed. The Gartley Harmonic Pattern is the most important pattern among the harmonic patterns .
I DO NOT expect a new ATH formation for Bitcoin in this rally due to the above reasons, and I expect it to at least decline to the Support zone($114,820-$113,180) .
Note: Important prices to watch for if Bitcoin reverses (in order of importance of volume): $118,400-$112,700
Note: You should note that these days, Bitcoin has a higher correlation with the SPX500( SP:SPX ) index than before, so if there is a sudden movement in Bitcoin, one of the reasons could be a sudden movement in the SPX500.
Educational Tip : The volume of each candle is considered to be the identity and credibility of that candle, and you can find these candles with the help of volume candle charts.
Cumulative Long Liquidation Leverage: $118,583-$118,000
Cumulative Long Liquidation Leverage: $116,652-$116,000
CME Gap: $111,355-$109,915
Stop Loss(SL): $125,00(Worst)
Please respect each other's ideas and express them politely if you agree or disagree.
Bitcoin Analysis (BTCUSDT), 8-hour time frame.
Be sure to follow the updated ideas.
Do not forget to put a Stop loss for your positions (For every position you want to open).
Please follow your strategy and updates; this is just my Idea, and I will gladly see your ideas in this post.
Please do not forget the ✅' like '✅ button 🙏😊 & Share it with your friends; thanks, and Trade safe.
Bitcoin has only just begun its new run.CRYPTOCAP:BTC is repeating its upward cycle once again on the weekly chart.
The structure that brings rises exceeding 90% at every major momentum shift is becoming active again.
The current +17% level is only the first step of similar phases in the past.
The rhythm is the same, the energy is reawakening.

BTC – Eyeing a Retest of the $118K Structure!CRYPTOCAP:BTC broke above the $117K–$119K structure (blue zone) with strong momentum.
I’m now watching for a pullback to this area to form a higher low and resume the uptrend.
As long as price holds above $117K–$119K, I’ll look for trend-following longs toward $125K–$128K, then the $130K handle.
If the blue zone fails, the next support sits at $106K–$110K (green zone), where bulls may regroup.
⚠️ Disclaimer: This is not financial advice. Always do your own research and manage risk properly.
📚 Stick to your trading plan regarding entries, risk, and management.
Good luck! 🍀
All Strategies Are Good; If Managed Properly!
~Richard Nasr

Bitcoin getting rejected at all time highBTC is preparing for another BOS; however, it seems that big players want to suppress the price. Momentum remains bullish, and so does the trend, but more importantly, the sentiment is still bullish. A bearish response that fails to produce a lower low is an opportunity to accumulate.
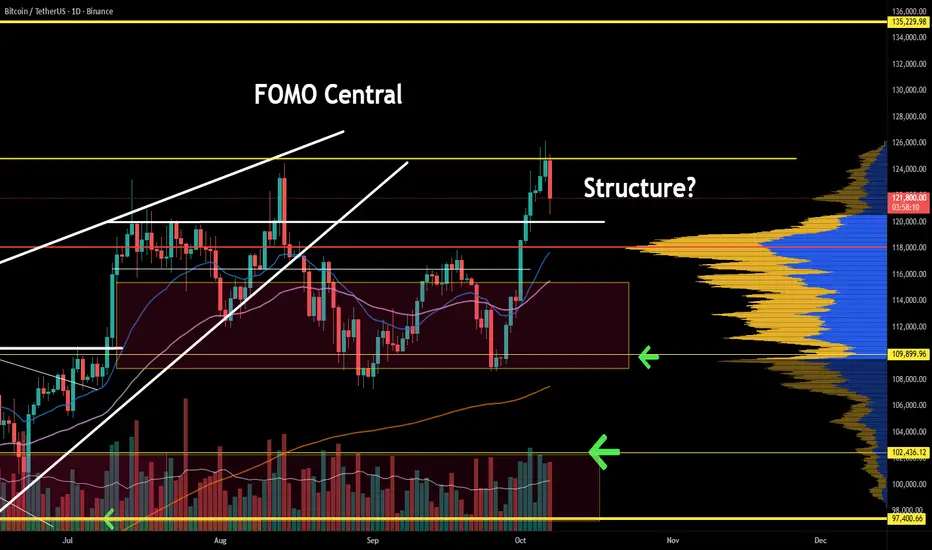
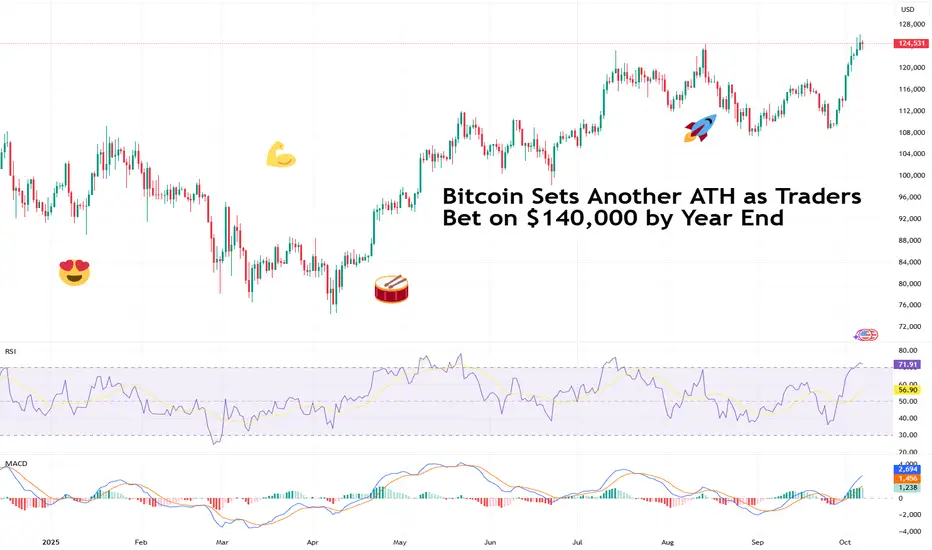
Bitcoin Sets Another ATH as Traders Bet on $140,000 by Year EndBlink and you’ll miss it. Bitcoin’s recent leg up caught lots of traders unprepared. After sinking below $110,000 few weeks back, the OG coin slingshotted to a fresh record high above $126,000 this week. Not a bad way to start October Uptober .
Now, traders are adding to bets that the price will crack $140,000 by year end. How realistic is that?
🌕 “Uptober” Strikes Again
October has a reputation in crypto lore and it’s living up to it.
Over the last 13 Octobers, Bitcoin BITSTAMP:BTCUSD has ended in the green 10 times. The pattern is set to continue as the coin rides a broader wave of optimism fueled by the Fed’s rate cuts, a messy US government shutdown, and the return of that dangerous four-letter abbreviation: FOMO.
But the real kicker? Spot Bitcoin ETFs are on fire.
US-listed Bitcoin ETFs kicked off the month with their second-best week ever, attracting $3.24 billion in net inflows — nearly matching their record of $3.38 billion set in November 2024. Are we… so back ?
💥 Options Traders Go Big: $140K or Bust
In the options market, optimism is loud and clear. Data from Deribit shows open interest piling up around the $140,000 strike for contracts expiring in December — meaning plenty of traders are betting we’ll see new highs just in time for the holiday season. (Not that easy to gift a BTC now, is it?)
At the same time, a few cautious traders are hedging with puts, just in case this turns into another one of those “too-fast, too-furious” rallies.
📈 You Get a Record and You Get a Record
It’s not just Bitcoin exploring new horizons. The S&P 500 SP:SPX and the Nasdaq Composite NASDAQ:IXIC both logged their 30-something record closes of 2025, powered by relentless AI strength ( some huge OpenAI deal ) and investors betting that rate cuts will stretch the bull run.
But also, gold bugs are turning into the Scrooge McDucks of the market, backstroking through piles of gold in impenetrable fortresses.
The shiny stuff OANDA:XAUUSD is up 55% year to date and hovering just under $4,000 per ounce, a milestone that would make even die-hard crypto bulls nod in respect.
Apparently, the market’s hot across the board.
🧠 Why Bitcoin’s Rally Makes Sense (Kind Of)
Underneath the euphoria, there’s some logic to this madness:
• Lower rates = cheaper money. When the Fed cuts, non-yielding assets like Bitcoin suddenly look more attractive.
• Inflation’s still sticky. Investors want something that can’t be printed at will. The US government shutdown only strengthened that flow of cash.
• Institutional influx is real. ETFs, family offices, and even corporate treasuries are allocating to Bitcoin BITSTAMP:BTCUSD , Ethereum BITSTAMP:ETHUSD , and Solana PURPLETRADING:SOLUSD.
At its current market cap of $2.5 trillion, Bitcoin is now bigger than Amazon NASDAQ:AMZN ($2.4 trillion), the world’s fifth-largest company .
🧭 The “Uptober” Mindset
Here’s where psychology comes in. After weeks of choppy sideways trading, boredom gave way to disbelief — then disbelief turned to excitement. Now? We’re entering the danger zone where conviction and euphoria start to blur.
Some veterans call this the “emotional compression” phase — when every dip feels like an entry and every green candle feels eternal. But cycles never die; they just rotate. Those who chase late often learn that momentum cuts both ways.
Still, momentum traders have history on their side. Every October since 2012 (barring 2018, 2014, and 2012), Bitcoin has delivered solid gains. It’s hard to argue with a pattern that reliable — until it breaks.
🤔 What Could Trip Up the Bulls
Even the most euphoric chart has risk baked in:
• Profit-taking. After a 100% gain over the past twelve months, short-term traders can decide to lock in profits fast.
• Macro shocks. One bad inflation print ECONOMICS:USCPI or a hawkish Fed comment could cool the mood.
• Overheated sentiment. When everyone in your barbershop agrees it’s going up, it usually doesn’t — at least not immediately.
The chart’s near-term support sits between $120,000–$122,000. Lose that, and a retest of $110,000 is possible. Hold it, and $140,000 becomes more than just a meme.
📢 $140K by Year-End: Dream or Data?
Statistically speaking, Bitcoin would need roughly a 4% monthly gain from here to hit $140,000 by December. Considering it’s already up over 100% year-to-date, that’s not outrageous.
To get there, the stars must stay aligned:
• ETF inflows keep building momentum.
• The Fed sticks to its dovish script.
• Stocks stay buoyant, giving traders room to take risk.
• No black swans, no rug pulls, no sudden panic tweets.
If all that holds, a single Bitcoin closing the year north of $140,000 isn’t fantasy. It’s just crypto doing what crypto does — defying logic, gravity, and your risk management plan.
👉 Off to you : Where do you see Bitcoin by end of year? Cast your predictions in the comment section!
BTC HOLDS LEVELS FOR MORE..BTC/USDT — Main Trend Holds Strong at $112K, Confirmation Near
Bitcoin is currently trading just below the low time frame zone around $124.5K, showing slight resistance before a potential confirmation breakout. Despite this minor pullback, the main trend remains firmly intact around $112K, which continues to act as the key structural support.
⚙️ Main trend updated to $112K: This level defines Bitcoin’s long-term bullish structure — as long as BTC stays above it, momentum remains positive.
📉 Below low time frame: BTC is temporarily consolidating under local resistance, but proximity to this level suggests a potential re-test and confirmation soon.
🚀 Upside target: Once the low time frame confirms, Bitcoin could aim for the next resistance zone near $132K.
Technical Outlook:
🟢 Main Trend (Support): $112K
🟡 Low Time Frame Resistance: $124.5K
🎯 Next Target: $132K (upon confirmation)
Summary:
BTC remains structurally bullish above the $112K main trend. While still slightly below the short-term confirmation zone, it’s positioned well for a potential continuation — provided support holds and price regains momentum above $124.5K.
📊 Bias: Cautiously Bullish
📈 Key Levels: Support $112K | Resistance $124.5K | Target $132K

BITCOIN SIGNAL: PRICE DISCOVERY TARGET + When Altseason ? Yello Paradisers! Enjoy the video!
And Paradisers! Keep in mind to trade only with a proper professional trading strategy. Wait for confirmations. Play with tactics. This is the only way you can be long-term profitable.
Remember, don’t trade without confirmations. Wait for them before creating a trade. Be disciplined, patient, and emotionally controlled. Only trade the highest probability setups with the greatest risk to reward ratio. This will ensure that you become a long-term profitable professional trader.
Don't be a gambler. Don't try to get rich quick. Make sure that your trading is professionally based on proper strategies and trade tactics.

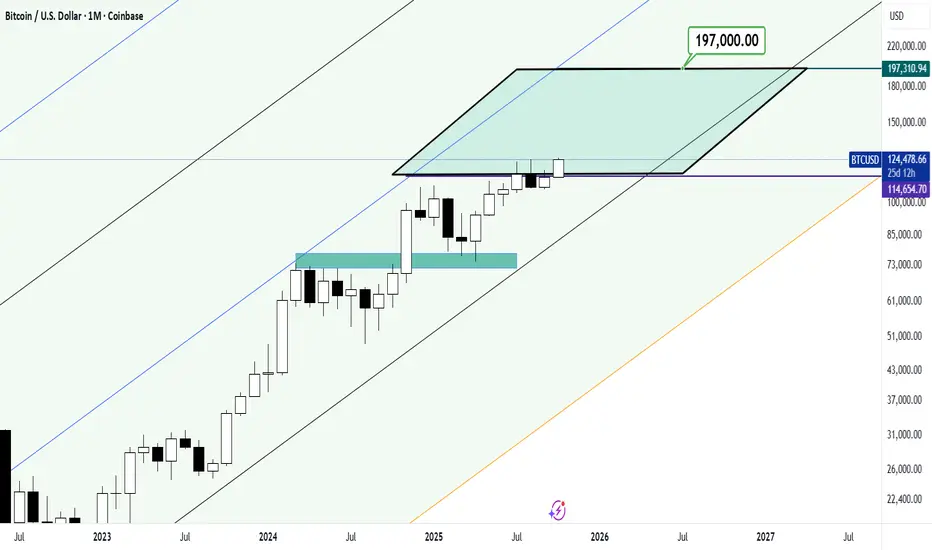
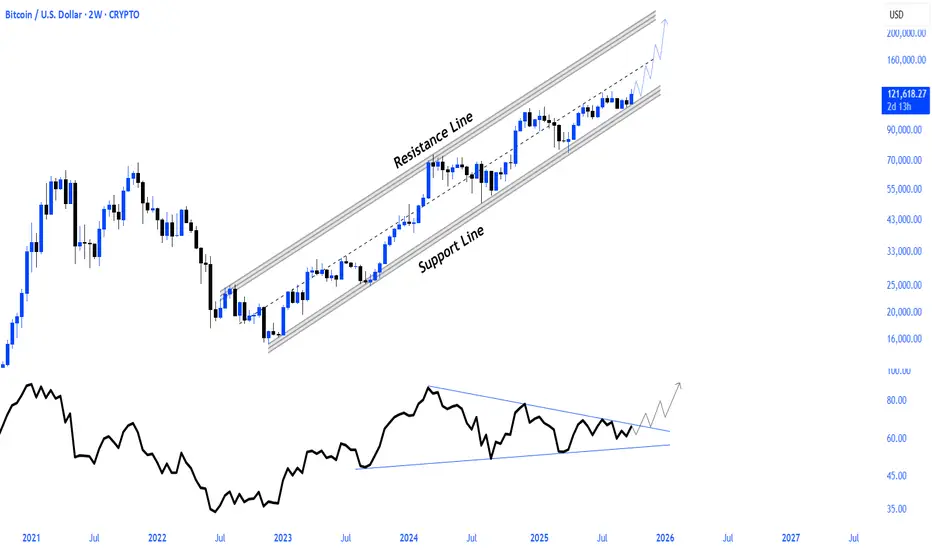
How long will the price stroking continue on the Bitcoin chart?A long-term analysis of Bitcoin’s trend suggests that we should expect a continued bullish trend in the coming months!
A price range of $197,000 per Bitcoin may seem far-fetched, but it would be very desirable and appealing to holders of this asset!!
Good luck!