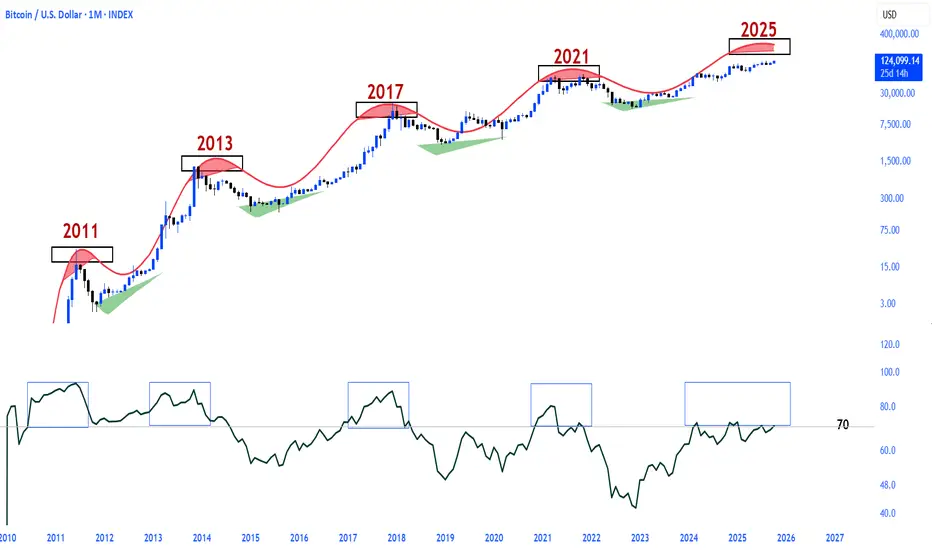
Bitcoin top not is in...The monthly RSI is back above 70 and hasn't even settled above the overbought level of 72.
The CRYPTOCAP:BTC rally will continue in the truest sense of the word.
Btc-bitcoin
IREN Wont Quit! Fib extension Analogue targets..NASDAQ:IREN Has ran all the weekly pivot in an astonishing wave III. RSI is extremely overbought.
The next Fibonacci extension targets (analogue scale) are the 3.618 at $59 and the 4.236 at $68 for a wave 3 termination.
Fibonacci log targets are as high as $400 but this seems unrealistic so switched to analogue in this case! Stranger things have happened still...
Safe trading

BTDR Closed above the weekly pivot!NASDAQ:BTDR Wave (3) is underway and price has overcome the weekly pivot for now and bulls want to see this hold! The trend is up, the supports have been tested and the all time High Volume Node is the next target $25.
Fibonacci extension targets are minimum if $38 at the 1.618 with possibility to overextended bringing up the next target of the R5 weekly pivot at $76
RSI is not overbought and has plenty of room to grow, reaching the next leg often kicks in serious momentum!
Safe trading

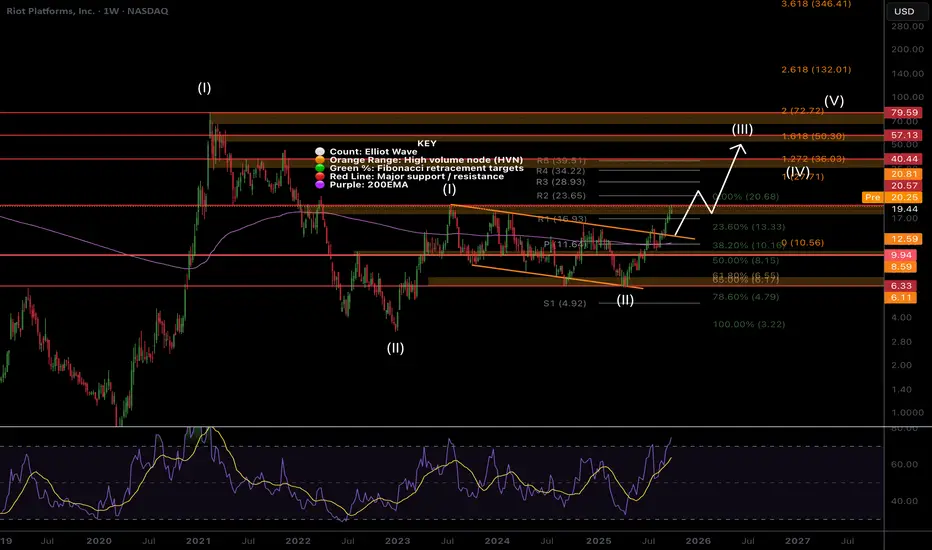
RIOT Macro, Higher for Longer!RIOT’s weekly RSI is overbought but can stay like this for many months as price continues upwards, just look at IREN!
Elliot wave (II) completed at the golden pocket. Price is finding minor consolidation at the wave (I) High Volume Node but is expected to break through with current price action and accelerate to $40, the High Volume Node and R5 weekly Pivot. Momentum is in control. Wave (III) has a minimum target of $50, per Fibonacci extension rules.
Safe trading
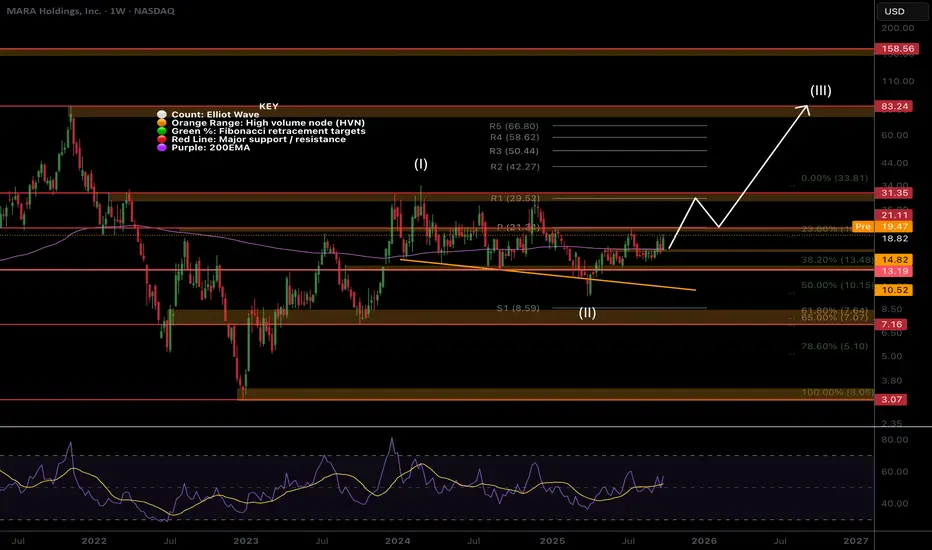
MARA Ready To Finally Move towards $30?MARA’s Elliot Wave (II) retracement front run the Fibonacci golden ratio and has now overcome the weekly 200EMA. The weekly pivot looms as strong resistance $21 just above the first target of our recent trade signal. If wave (III) is underway we should see price begin to accelerate alongside Bitcoin with an initial target of $31 followed by $80 High Volume Node.
Expect price to consolidate at the wave (I) resistance $30 for a while. Weekly RSI is crossed bullishly at the range EQ giving it room to move bullishly!
Safe trading
COIN Wave III underway into all time high!Elliot Wave (III) is still underway after wave (II) completed at the weekly 200EMA. Coinbase had a huge bullish engulfing candle this week, closing price above the High Volume Node and R1 weekly pivot - a strong bullish signal!
Price first tested the High Volume Node support and 0.382 Fibonacci retracement, $270. Characteristic of wave 3 shallow pullbacks.
Weekly RSI has reset to the channel EQ and crossing bullishly giving price room to extend upwards!
Safe trading

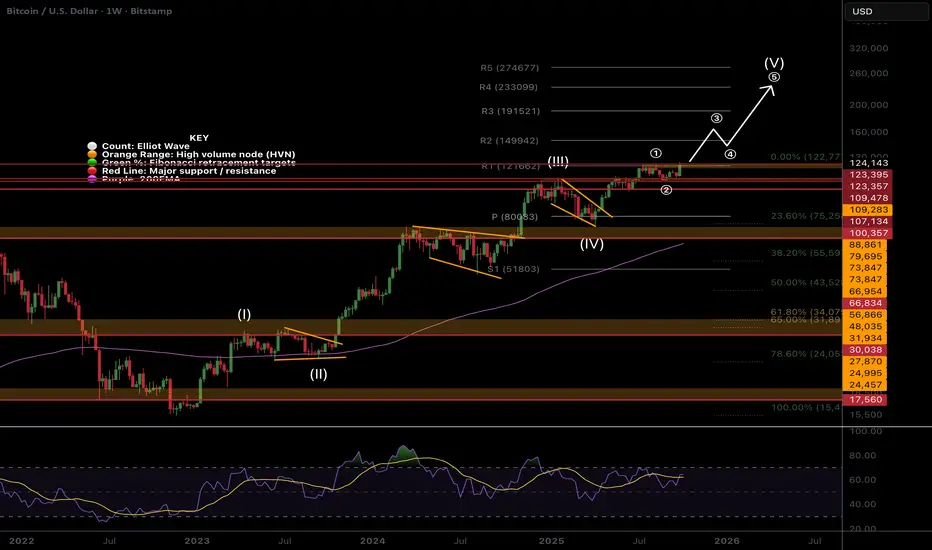
BTC Continues its shallow pullbacks to all time high pattern!This weeks candle bullishly engulfed the entire range showing supply is exhausted and price is ready for the next leg up in Elliot wave wave (3), the powerful wave, especially with a shallow wave (2)!
A word of caution, currently there is a 3 waves up into all time high that resembles a running flat correction which penetrates all time high before retuning the lower range boundaries, 1$08k in this case to complete the correction.
The R2 weekly pivot is the first target at $150k. Weekly RSI continues to print bearish divergence but has come out of overbought and tested the EQ. It is now crossing bullishly. A push into overbought will negate the bearish divergence.
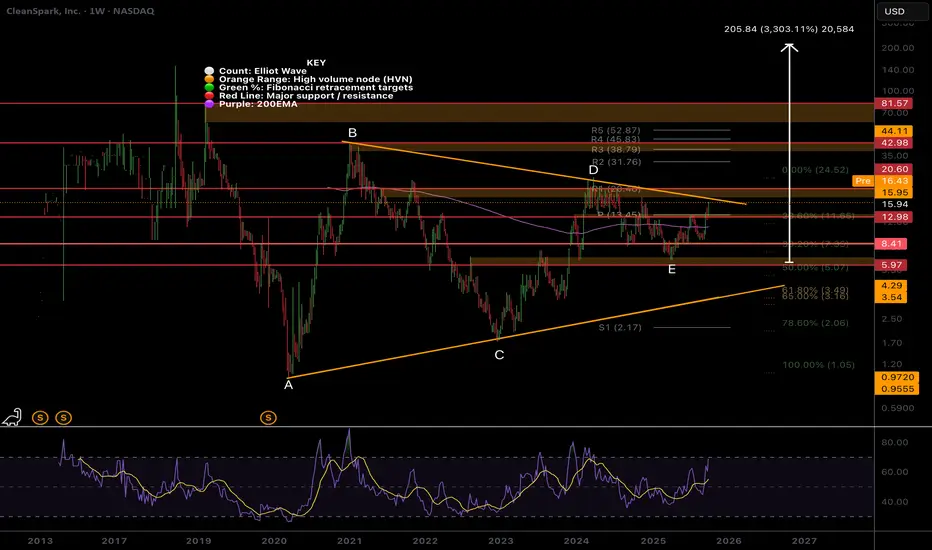
CLSK Testing Macro Triangle Upper Boundary!NASDAQ:CLSK Macro analysis shows a multi-year triangle has completed at the mid EQ, where price has the highest probability of completing wave E. CRYPTOCAP:XRP Did a x10 after this breakout and I am expecting similar move with CLSK.
Price should consolidate for a while in $16-$20 range as it works through wave D and trend-line resistance. Downside target is the weekly pivot at $13.45 which could offer a great buy!
All time high sits at $80, triangle pattern target is extremely high at $200 (triangle height measured from wave E bottom) but take this with a pinch of salt and keep your profit taking realistic! Crazier price moves have happened!
Weekly RSI is not yet oversold and price often gathers months of strong momentum when RSI gets to these levels reinforcing the analysis.
Safe trading
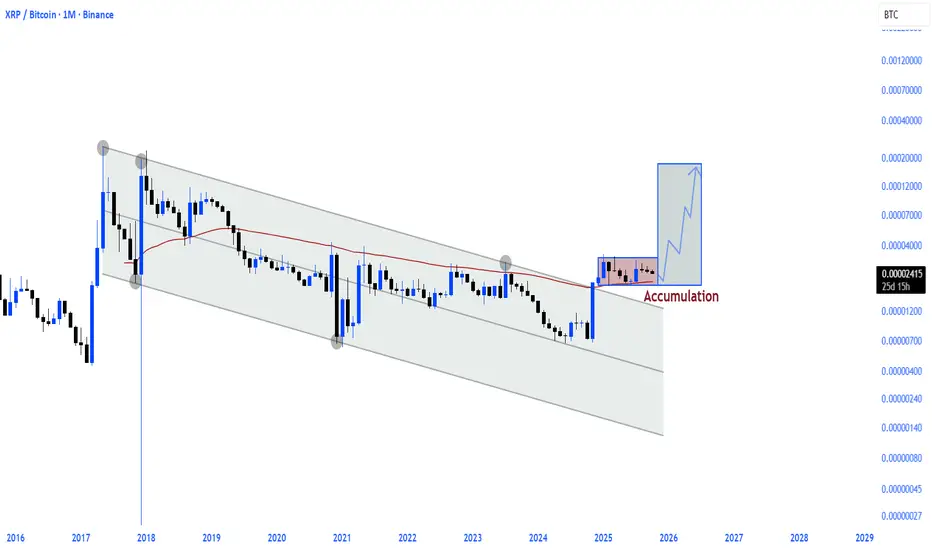
$XRP / $BTCThe 7.5-year descending channel broke in November 2024
The resistance level (50EMA), which served as a significant barrier, was broken in November 2024 after 5.5 years, and accumulation is currently occurring above this level.
The Ripple rally is definitely going to be very hot.
Bitcoin to $134kAccording to the broadening wedge (blue lines) from the bottom of that , we get a target to 134k for bitcoin

$NDX $SPX $BTC All Close at Weekly ATHPretty cool to see ₿itcoin, S&P 500 and Nasdaq all close the week at new ATH 🥳
And now we have $325B about to be dumped into the US economy in FY26Q1 along with more rate cuts on the way.
Next time you speak to a bear, reply with FU HIGHER 🚀

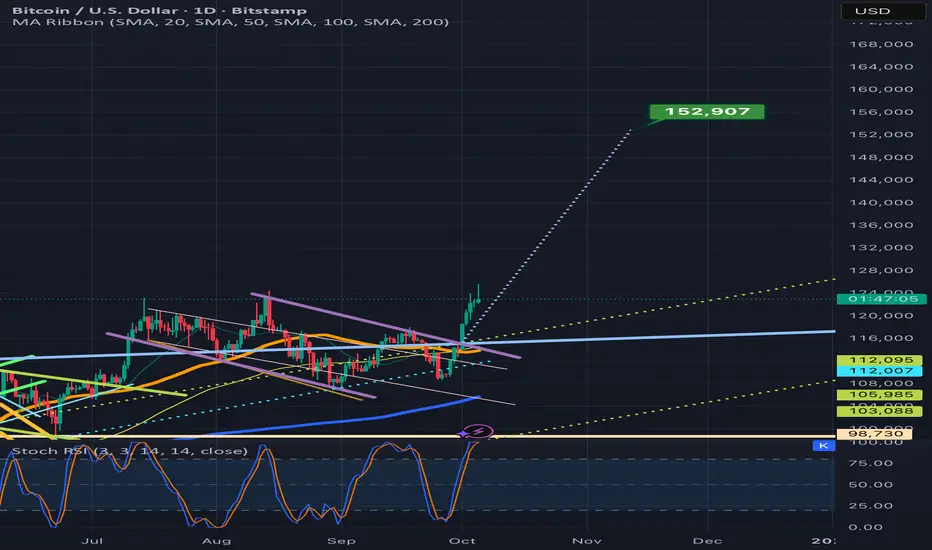
BTC just achieved a new all time high on its way to 153kFeels like it may be validating the breakout above the blue line as it also seems to be climbing up the dotted measured move line here on the last few candles. So probability is quite good that we validate the breakout on this impulse. If so the full measured move target is around 152.9k or more or less 153k. *not financial advice*
BTC WILL NOT BE THERE🪙 CRYPTOCAP:BTC October 10th 😅 Straddle breakevens:
118000 & 127000
🪙 CRYPTOCAP:BTC October 17th 😅 Straddle breakevens:
116000 & 130000
σ Sigma probabilities:
October 10th
| σ | Multiplier × 😅 | Probability
| 1σ | 117000 & 128000 | ≈68%
| 2σ | 112000 & 133000 | ≈95%
October 17th
| σ | Multiplier × 😅 | Probability
| 1σ | 114000 & 131000 | ≈68%
| 2σ | 106000 & 139000 | ≈95%

Bitcoin (BTC) Hits New Highs, Analyzing Future ScenariosBINANCE:BTCUSDT
Bitcoin (BTC) hit a new all-time high today, once again encountering resistance at a long-term slant, extending from the 2017 and April 2021 highs. Since then, a correction of approximately 2% has occurred, forming a long upper shadow on the daily chart. Notably, this trend is displaying a fractal pattern similar to the July 14th peak. If today's daily chart closes with a long upper shadow, it could lead to a short-term sideways or correction phase. Conversely, if it closes with a negative candlestick, this section could be interpreted as a trend reversal signal following the formation of a high.
8-year long-term oblique angle
Your follow and boost would mean a lot. 🚀
I am Korean and I used Google Translate.

UPTOBER 2017 \ 2025Bitcoin is entering a parabolic phase again.
The same energy,
similar structure,
the spirit of 2017.
CRYPTOCAP:BTC 🔃

$BTC / $GOLDCRYPTOCAP:BTC / TVC:GOLD 🔃
2013 | 1 Btc = 1 Gold
2017 | 1 Btc = 16 Gold
2021 | 1 Btc = 37 Gold
2025 | 1 Btc = 31 Gold \ More is coming
In December 2024, 1 Bitcoin was worth 41 gold, but there was no monthly close above the 2021 ATH level.

BTC analysis.Give me some energy !!!The price surged, breaking the triangle after 6 months, and now it can be said that Bitcoin will soon reach $150,000.
PREVIOUS ANALYSIS

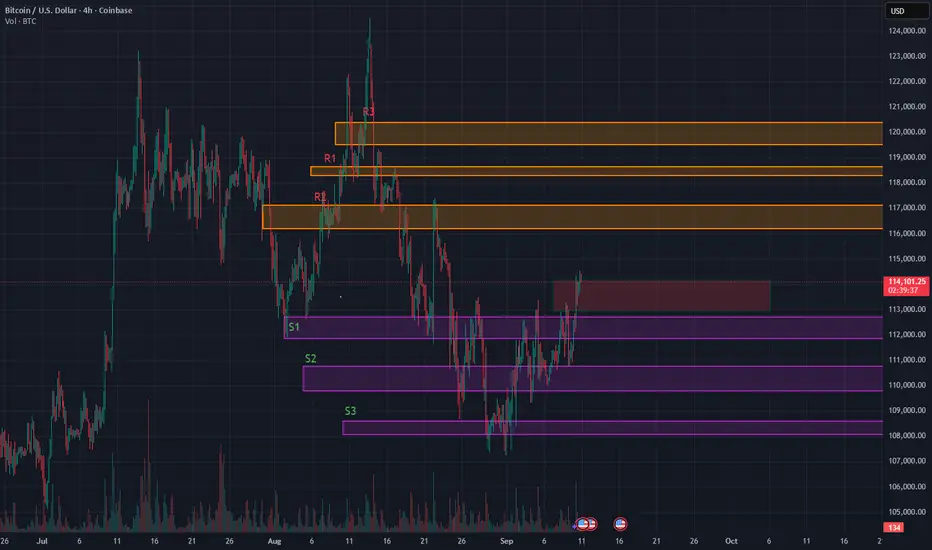
Range-Bound Rocket: BTC’s Coiled Spring Between S1 and R3-ATHRange Bound Rocket: BTC Loaded and Coiled for $120k Retest
Description:
BTC is now trading around $114,260, still inside the range I’ve flagged earlier. We reloaded at our previously posted support zones between $110k and $111k. That gives us a strong base.
I’m watching for acceptance above the $113k to $114k red box, which overlaps with the neckline of a potential reverse Head & Shoulders on the 4‑hour chart. It hasn’t triggered yet but we are in validation mode. (expecting a retest to 113k and then a break up) If we get a breakout with volume expansion and wide‑bodied candles, I’ll treat that as a valid activation. Target remains $119k and above.
This table shows how likely BTC is to stay above certain price levels over the next two weeks based on current volatility. These are not predictions, they represent statistically expected ranges based on price behavior.
2WK/Probability, Price Level, Meaning
90%, ~$96,700 BTC is very likely to stay above this level
75%, ~$103,200 BTC has a strong chance of staying above here
50%, ~$111,000 This is the midpoint, BTC has equal chance of being above or below
25%, ~$119,400 BTC has a one in four chance of closing higher than this
10%, ~$127,400 Only a small percentage of outcomes put BTC above this level
Key takeaways:
BTC is currently trading around $114,260, sitting just above our red resistance zone at $113,000 to $114,000.
Our first upside target, $118,000, lines up with the top 25 to 30 percent range of expected outcomes. This is reachable if the broader market stays supportive.
$120,000 sits closer to the top 20 percent threshold. BTC would need strong momentum and favorable macro data to push there in the next two weeks.
Downside probabilities
While the structure looks bullish, we should still consider these potential retracement levels:
Around 46 percent chance BTC dips below $110,000
Approximately 43 percent chance it drops under $109,000
Roughly 30 percent chance BTC trades below $105,000
These downside paths are consistent with our S2 and S3 support zones, which were successfully defended during the last major pullback.
What I'm doing and suggest :
Breakout confirmation:
I’m looking to add above $113k to $114k only if volume expands and candles show conviction, meaning minimal wicks and strong closes. Weak volume or upper wicks mean the breakout could fail. Main stop is back inside the range. Scalpers can use a tighter invalidation below $112.2k.
Reload zone:
A move into $110k to $109k is a statistically common retest. I’ll look for buyer defense and fading downside pressure to reload.
Volatility risk:
I'm already positioned long from our previously posted support zones around $110k to $111k, so I’m not actively adding or hedging right now. Into CPI and the Fed, I’m staying hands-off unless we get a clear breakout or strong market signal.
For those not in position:
Avoid chasing breakouts before the event
Look for confirmation or reaction post-data
If we get a volatility spike, retests of $110k to $109k are still statistically common and may offer a better entry
The goal is to avoid being overexposed heading into binary catalysts. I’m holding my current spot exposure and letting the trade breathe.
If no breakout forms:
I expect BTC to remain in a range between $111k and $118k. Support zones from prior posts maintained a bullish bias. If BTC consolidates below $114k but keeps forming higher lows, I’ll consider that ongoing accumulation.
Catalysts to monitor:
Nasdaq or NQ breakdown
• Tech strength: Nvidia up ~30% YTD on strong Blackwell Ultra demand, ADI and MX showing strength despite macro headwinds.
Jobless claims rising again
• U.S. jobless claims are rising to 237K, signaling labor market cooling. Continuing claims are easing but job additions in August were weak at just 22K. Recent wide downward revisions (~911K fewer jobs year-to-date) reinforce rate‑cut bets.
Geopolitical risk
• Geopolitical tensions remain tail‑risks.
Fed rate tone and CPI reaction
• Fed tone and CPI outputs are increasingly important as data is tilting soft and markets are pricing in easier policy.
• The USD’s trajectory matters. Further weakness helps BTC and tech space gain more cushion.
Tech remains a key driver. AI and semis continue to lead Nasdaq strength, and BTC still tracks equity moves closely. A soft dollar also reduces market drag and supports upside potential.
btc local topBitcoin top not is in.
New peaks are inevitable.
It is clear that a local top has not been seen without touching the upper band of the logarithmic cycle on a cycle basis.
nfa.

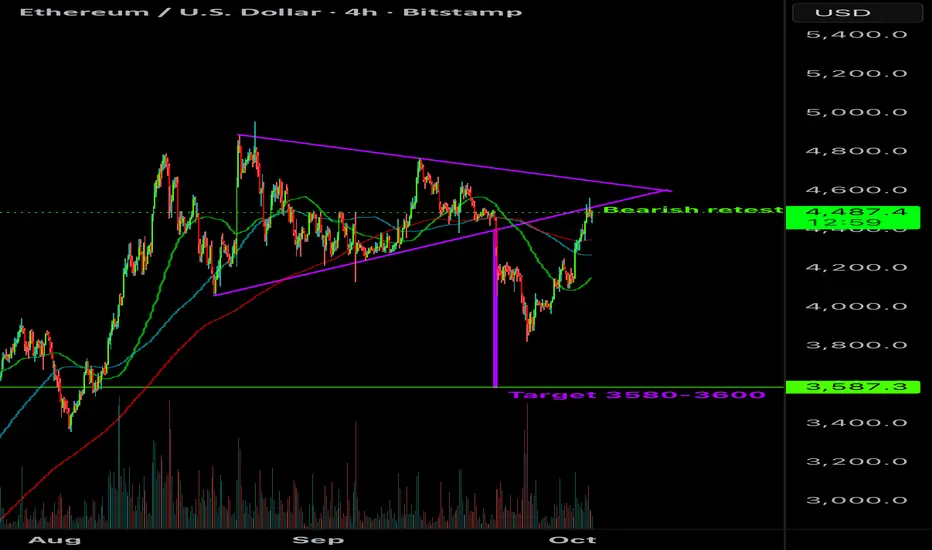
ETH Bearish Retest?Could be looking at a bearish retest of the symmetrical triangle breakdown.
Target remains around $3600. Bearish divergences also confirming potential here.
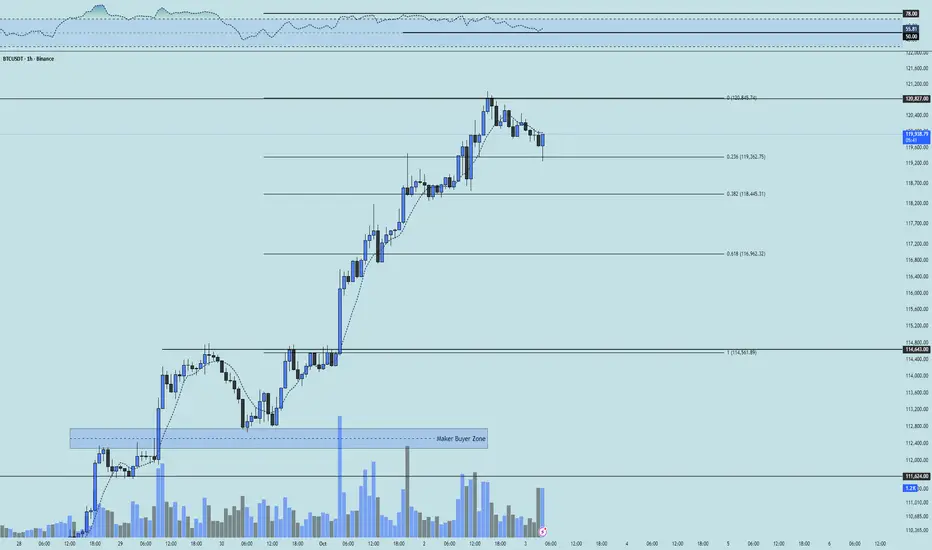
BTC 1H Analysis - Key Triggers Ahead | Day 51☃️ Welcome to the cryptos winter , I hope you’ve started your day well.
⏰ We’re analyzing BTC on the 1-Hour timeframe .
👀 On the 1-hour timeframe for Bitcoin, we can see that after this recent bullish leg, price has now reached its resistance at $120,827. If this resistance breaks — a zone packed with short orders — Bitcoin could start an extremely sharp and powerful upward leg, essentially triggering a short squeeze. At the moment, Bitcoin is entering a corrective phase; with the start of this correction, price could head down toward its Fibonacci retracement supports, bounce from one of those levels, and then form a new trading structure.
🧮 Looking at the RSI oscillator, price has been ranging around the 70 zone and briefly entered overbuy. It is now moving toward the 50 area, its oscillation mean. A break below 50 could deepen the correction, but if support holds, RSI could again head toward the resistance zone near 70 and re-test the overbought boundary.
🎮 The Fibonacci retracement drawn from the breakout at $114,562 to $120,827 highlights several strong support areas. The most important zones for Bitcoin are the 0.236 and 0.382 retracement levels. Support here, followed by a fresh structure, could set up strong trading opportunities.
🕯 The size and volume of buy candles have been exceptionally strong and increasing — something rarely seen in Bitcoin with such a one-sided move to the upside. Now, during this corrective phase, even as selling pressure appears, roughly 70% of that sell volume is being absorbed by buyers. What we must watch closely is how buyers decide to allocate capital from here. If the key Fibonacci levels are lost, we respect the market’s decision and only then consider new trades.
🧠 For a Bitcoin position If you don’t have an open position, I recommend waiting for a new structure to form at critical Fibonacci levels, and only enter after a breakout of that structure.
If you already hold a position, consider partial profit-taking, since USDT dominance has also reached an important support zone.
❤️ Disclaimer : This analysis is purely based on my personal opinion and I only trade if the stated triggers are activated .
BTC - Weekly Breakout!📈 BTC has already broken out of its correction phase and is holding strong above $118k.
As long as $118k holds, the next targets sit between $126k–$140k.
Only a drop below $114k would delay the bullish outlook.
Trend remains strongly bullish after the breakout.
⚠️ Disclaimer: Not financial advice. Manage risk properly.
All Strategies Are Good; If Managed Properly!
~Richard Nasr.

Bitcoin Faces $120K Resistance – Bull Trap or Breakout?Bitcoin ( BINANCE:BTCUSDT ) continued its uptrend of the last 2-3 days as I expected in my previous idea . Today, the announcement of the ADP Non-Farm Employment Change index worked like a catalyst for Bitcoin .
Bitcoin is currently surrounded by Resistance zones and a Potential Reversal Zone (PRZ) , and is near the important price of $118,400(Volumetric importance) and the $120,000(Round Number) .
From the perspective of Elliott Wave theory , it seems that Bitcoin could be in corrective waves and that the increase of the last few days could only serve as a Bull Trap .
I expect Bitcoin to decline at least to the Support lines .
Cumulative Long Liquidation Leverage: $113,590-$111,900
Cumulative Long Liquidation Leverage: $115,823-$115,087
Cumulative Short Liquidation Leverage: $120,000-$118,000
Note: If Bitcoin falls below the Support zone($114,820-$113,180), we should expect further declines.
CME Gap: $111,355-$109,915
Stop Loss(SL): $120,103
Please respect each other's ideas and express them politely if you agree or disagree.
Bitcoin Analysis (BTCUSDT), 1-hour time frame.
Be sure to follow the updated ideas.
Do not forget to put a Stop loss for your positions (For every position you want to open).
Please follow your strategy and updates; this is just my Idea, and I will gladly see your ideas in this post.
Please do not forget the ✅' like '✅ button 🙏😊 & Share it with your friends; thanks, and Trade safe.
