BITCOIN 2025-6 SCENARIOLet’s see if this alternative Bitcoin top plays out — after all, it’s an experimental chart
Btc-bitcoin

Bitcoin Outlook: From Support Bounce to Short Liquidation TargetBitcoin ( BINANCE:BTCUSDT ) moved as I expected in my previous idea ( Long and Short positions hit their targets ).
Bitcoin is currently moving near the Resistance zone($114,820-$113,170) , Resistance line, and the Monthly Pivot Point , and seems to have failed to break 100_EMA(Daily) .
In terms of Elliott Wave theory , Bitcoin completed wave 5 as I expected by attacking 100_EMA(Daily) and Heavy Support zone($112,000-$105,800) , and we can expect more bullish waves .
I expect Bitcoin to break the Resistance line in the coming hours and attack the Resistance zone ($114,820-$113,170) and the Cumulative Short Liquidation Leverage ($114,334-$113,400) .
Cumulative Long Liquidation Leverage: $110,950-$110,350
Note: If Bitcoin goes above $115,000, we should expect Bitcoin to rise again.
Please respect each other's ideas and express them politely if you agree or disagree.
Bitcoin Analysis (BTCUSDT), 1-hour time frame.
Be sure to follow the updated ideas.
Do not forget to put a Stop loss for your positions (For every position you want to open).
Please follow your strategy and updates; this is just my Idea, and I will gladly see your ideas in this post.
Please do not forget the ✅' like '✅ button 🙏😊 & Share it with your friends; thanks, and Trade safe.
BITCOIN SIGNAL: IS IT ABOUT TO GET WORSE??!! (scary) Yello Paradisers!
Together, we go through multiple timeframes. We are going through an ultra-long timeframe, breaking of the channel. How proper reclaims look, what the preceded price action is that is going to happen next and what preceded before that, and what the cycles are. We are taking a look at the bearish divergence, a shooting star which increased the truncation probability on lower timeframes.And that we are in the first motive mode wave of a higher-degree impulse.
On a high time frame chart, we are going through the secondary wave, the bearish divergence, resistances, and with the highest probability, the secondary wave is not yet finished. We are looking for confirmations from a high time frame perspective.
On a medium timeframe, we are deeply calculating the sub-waves. I'm sharing with you the fourth wave that, with the highest probability, is finishing, and we are about to have a fifth corrective mode wave because we are in an ending diagonal.
On a low timeframe chart, I'm sharing with you the expanding triangle and the upcoming price action with the highest probability.
Paradisers! Keep in mind to trade only with a proper professional trading strategy. Wait for confirmations. Play with tactics. This is the only way you can be long-term profitable.
Remember, don’t trade without confirmations. Wait for them before creating a trade. Be disciplined, patient, and emotionally controlled. Only trade the highest probability setups with the greatest risk to reward ratio. This will ensure that you become a long-term profitable professional trader.
Don't be a gambler. Don't try to get rich quick. Make sure that your trading is professionally based on proper strategies and trade tactics.

BITCOIN SIGNAL: ANOTHER PERFECT PREDICTION (warning) Yello Paradisers! As always, as professional traders in this video, once again, we will go through multi-timeframe analysis. We are using Elliot Wave, indicators, advanced technical tools, and price action reading. Enjoy it. I love you.
Paradisers! Keep in mind to trade only with a proper professional trading strategy. Wait for confirmations. Play with tactics. This is the only way you can be long-term profitable.
Remember, don’t trade without confirmations. Wait for them before creating a trade. Be disciplined, patient, and emotionally controlled. Only trade the highest probability setups with the greatest risk to reward ratio. This will ensure that you become a long-term profitable professional trader.
Don't be a gambler. Don't try to get rich quick. Make sure that your trading is professionally based on proper strategies and trade tactics.

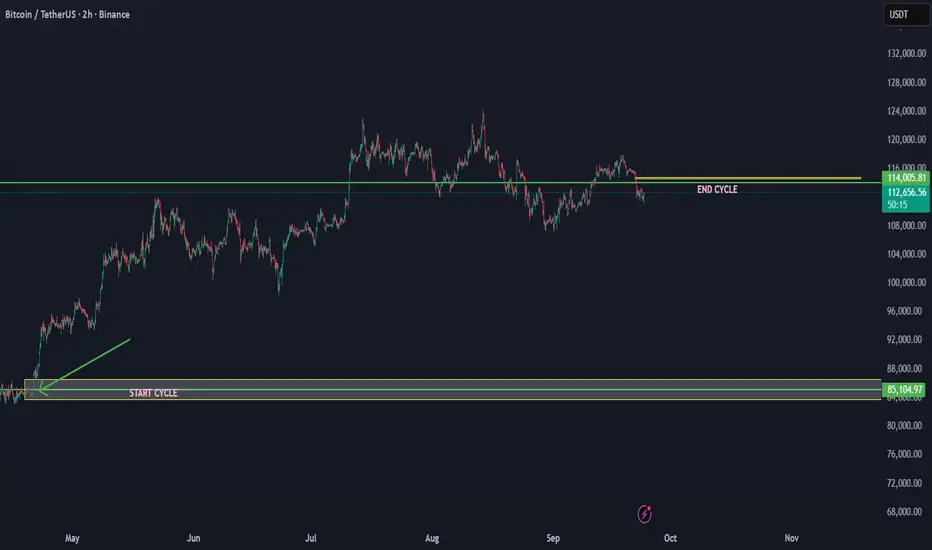
The BTC cycle that started at 84K is projected end at 114K This is a cycle update for BTC/USDT. Based on the cycle data, the cycle that started at 84K has ended at 114K. This indicates that we are now entering a new major trend breakdown in the cycle. It can take time, but when there is a new uptrend cycle, we will add.
This time frame and action made the end of the cycle that started from 84K
This could mean that btc can enter below 110K in the coming time. We have seen more times in the history of BTC that by the cycle end, the trend breaks down in steps.
BTC Bearish Structure, $109,350 Next? Bitcoin
Bearish Outlook
Structure: Trendline, Key Level and Bearish Flag
BTC’s recent price action shows strong selling pressure, with a clear bearish breakout below the hourly trendline and the key level at $114,500. Currently, price is consolidating within minor support and resistance levels. A further break below the minor support could trigger continued downside momentum, targeting the next support at $109,350.

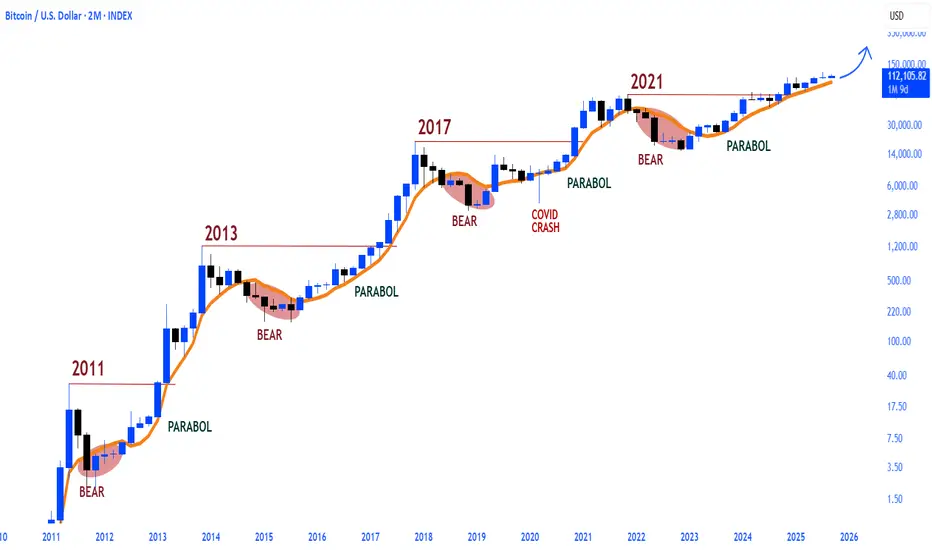
Bitcoin top not is in.Bitcoin has continued its run as long as it remained above the MA7 on a cycle basis, and it is still above it at present.
CRYPTOCAP:BTC ⤴️
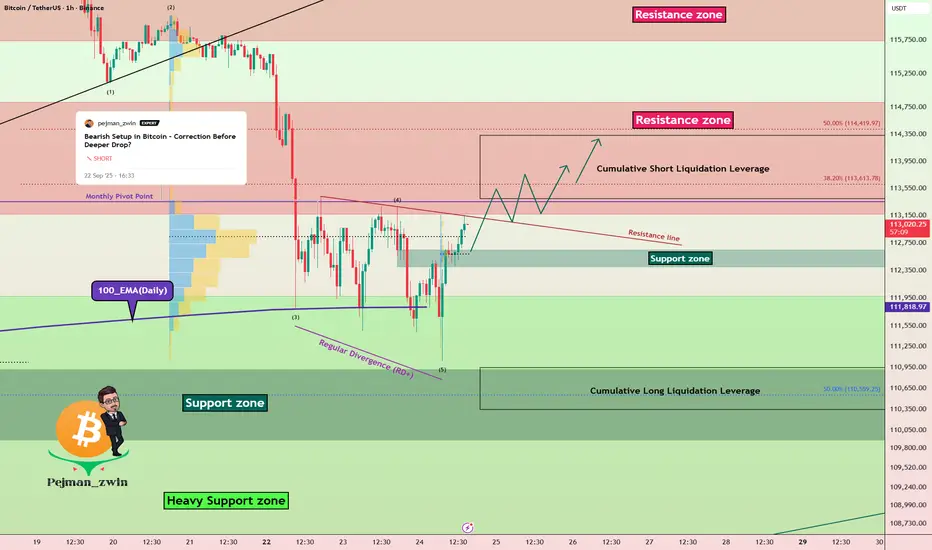
Bearish Setup in Bitcoin – Correction Before Deeper Drop?Bitcoin ( BINANCE:BTCUSDT ) started to decline and broke the ascending channel and Support zone($114,820-$113,170) with the help of the Bearish Flag Pattern , as I expected in the previous idea update .
Do you think Bitcoin can go below $105,000 !?
Bitcoin is once again approaching 100_EMA(Daily) and the Heavy Support zone($112,000-$105,800) .
From the perspective of Elliott Wave theory , Bitcoin appears to have completed the Zigzag Correction(ABC/5-3-5) in the ascending channel, and now it seems that we should expect bearish waves .
I expect Bitcoin to FAIL to break the 100_EMA(Daily) with one attack and have an upward correction to Fibonacci levels and Cumulative Short Liquidation Leverage($114,098-$113,229) , and then re-attack the Heavy Support zone($112,000-$105,800) and 100_EMA(Daily) .
Cumulative Long Liquidation Leverage: $111,850-$110,421
Note: If Bitcoin goes above $115,000, we should expect Bitcoin to rise again.
Note: There is also a possibility that the SPX500 index( SP:SPX ) will also correct and, given Bitcoin's correlation with this index, cause Bitcoin to correct further.
Please respect each other's ideas and express them politely if you agree or disagree.
Bitcoin Analysis (BTCUSDT), 4-hour time frame.
Be sure to follow the updated ideas.
Do not forget to put a Stop loss for your positions (For every position you want to open).
Please follow your strategy and updates; this is just my Idea, and I will gladly see your ideas in this post.
Please do not forget the ✅' like '✅ button 🙏😊 & Share it with your friends; thanks, and Trade safe.

BITCOIN The hidden pivot of the Bollinger Bands (140k or 100k?).Bitcoin (BTCUSD) is testing again the basis (black trend-line) of the 1W Bollinger Bands (BB), just 3 weeks after it held and initiated a rebound.
On this chart you can see that since July 2023, every time BTC closed a 1W candle below the BB basis level, the price pulled-back to its 1W MA50 (blue trend-line) and then rebounded. That is its ultimate long-term Support so far.
As a result, all eyes should be on this week's closing. Below the BB basis, we should most likely seek the 1W MA50 a little above the $100000 mark. Ideally, it should coincide with a 1W RSI Support Zone test (holding since September 2023).
If the BB basis holds though, we should extend the BB top within the $130-140k Zone.
What do you think will come first? Feel free to let us know in the comments section below!
-------------------------------------------------------------------------------
** Please LIKE 👍, FOLLOW ✅, SHARE 🙌 and COMMENT ✍ if you enjoy this idea! Also share your ideas and charts in the comments section below! This is best way to keep it relevant, support us, keep the content here free and allow the idea to reach as many people as possible. **
-------------------------------------------------------------------------------
💸💸💸💸💸💸
👇 👇 👇 👇 👇 👇

CLSK Moving Fast!Local Analysis / Targets / Elliot Wave
CLSK sentiment was awful as I explained a few weeks ago, it appeared to be in a macro triangle similar to XRP before the x10 breakout. That breakout is now underway with a huge move last week characteristic of wave 3 and reinforcing my analysis. Minimum wave 3 targets are well above $20 and price should move quickly once it over comes the triangle resistance it is now approaching at $15.
Price was front run above High Volume Node support and the golden pocket leaving limit orders behind forcing them to buy higher if they want to participate pushing the price up further.
Daily RSI is overbought but so was NASDAQ:IREN and that continued upwards for weeks, as has $WULF.
Standard Deviation Band Analysis
Standard deviation bands remain negatively sloped but I am expecting that to change and price continues upwards. That said, investors should be weary of a reversal in this area where price spends <5% of the time. Bulls are looking for a sustained move into the zone and a breakout above the SD+3 threshold offering a target of $50.
Safe trading

$BTC Battle of the Bulls and Bears is ON! Pretty wild day in the crypto market.
CRYPTOCAP:BTC Bears closed below the 100MA, but thankfully right above the .236 Fib and avoided the DANGER ZONE ⚠️
Bulls need a big next couple of days.
Can't hang out here for too long.
RSI is looking healthy after this reset tho.
How you feeling?
Bullish or Bearish?

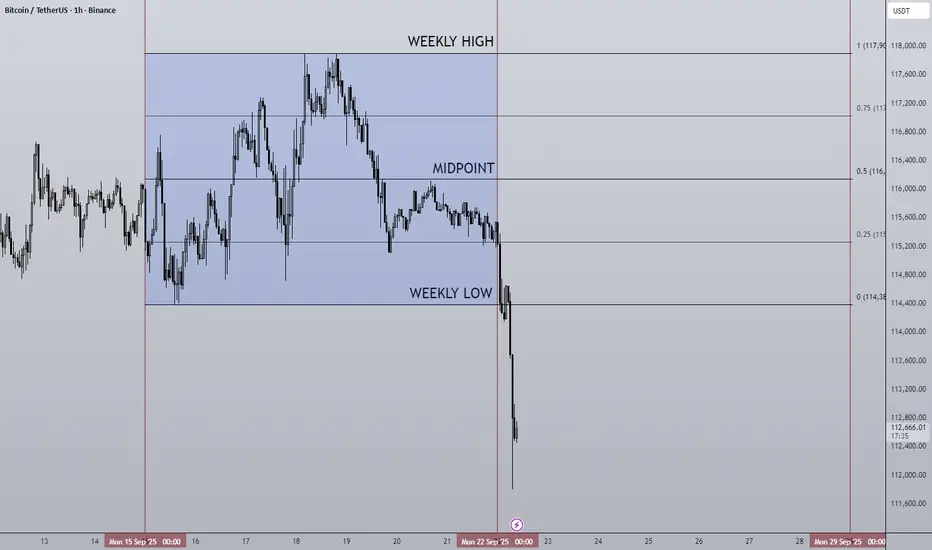
22/09/25 Weekly OutlookLast weeks high: $117,904.04
Last weeks low: $114,383.99
Midpoint: $116,144.01
A very interesting start to the week to say the least! In the opening hours of this week BTC has plunged 3% to tag $112,000, this comes off the rejection of $117,500 key level post FOMC.
The FED cut interest rates by 25bps as was expected by most, the resulting rally failed to break $117,500 resistance and rejected back to the origin of the rally at the 0.25 line. The dip from the opening hours of this week is in my opinion continuation of this rejection level. It is clear the bulls still don't have the firepower to break the range and push on, the question this week is where will BTC find support?
For me there are some key levels, 1D 200 EMA is still an option at $106,000, the daily local how at $107,500 could provide double bottom support. The Monday close will provide more context to this move, should the reaction be minimal and the daily candle closes as it is now the September curse could continue.
This week I'll be closely monitoring how altcoins react to this move, I believe the general consensus is that altcoins will outperform BTC in Q4. Historically the final quarter of the year has provided some great returns over the years, however that does not necessarily mean that will be the case this time around. If it does happen this dip may provide some good entries.
Good luck this week everybody!
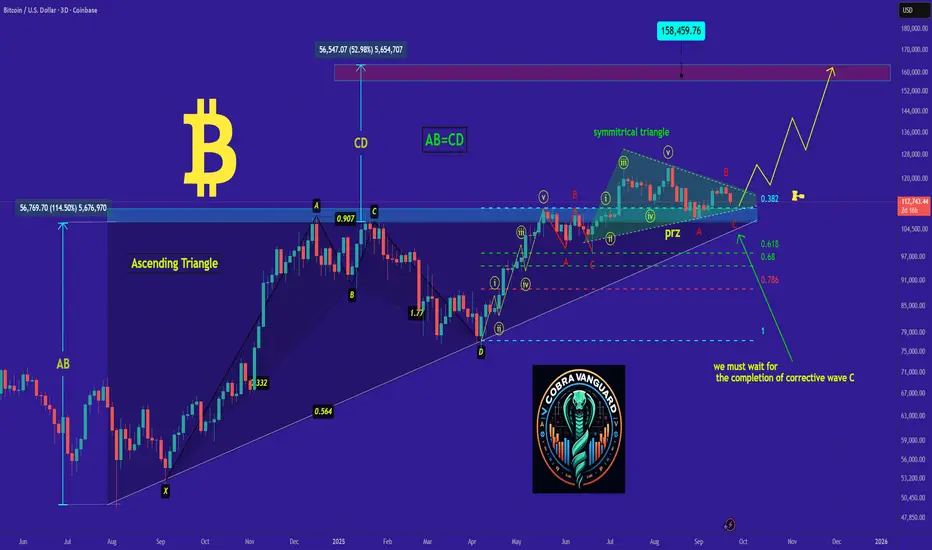
bitcoin's Situation, A Comprehensive Analysis !As you can see, the price has formed a triangle over the past 4 months, whose bullish or bearish nature will be determined after its breakout. The corrective Elliott waves(abc) are currently completing the final wave, which indicates that a potential price increase is on the way. Now, we must wait for the completion of corrective wave C .
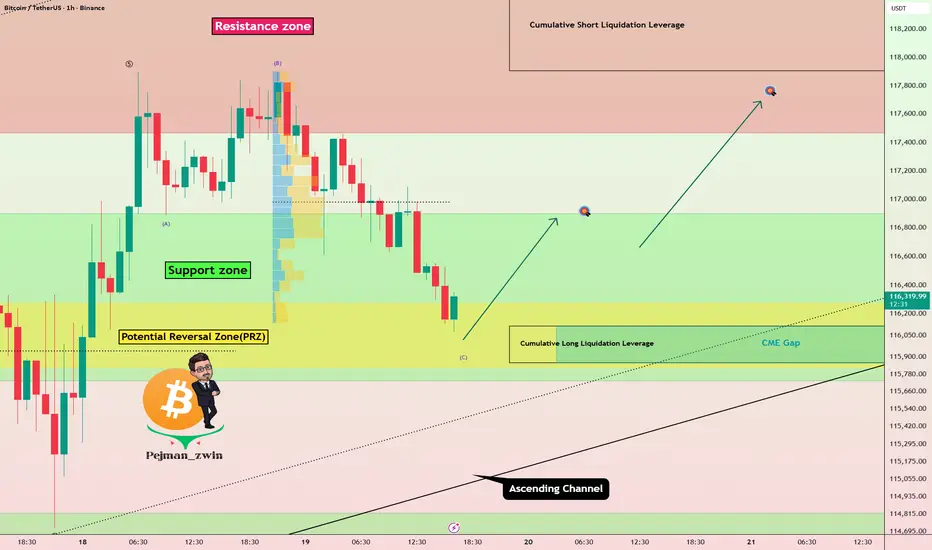
Key PRZ Ahead for Bitcoin – Bounce or Breakdown?Bitcoin ( BINANCE:BTCUSDT ) moved as I expected in my previous idea and rose to the Resistance zone($118,580-$117,460) .
First of all, let me say that this is a short-term Bitcoin analysis .
Bitcoin is filling the CME Gap($116,115-$115,860) and is moving near the Support zone($116,900-$115,730) [, Cumulative Long Liquidation Leverage($115,555-$114,424) , Potential Reversal Zone(PRZ) , and the lower line of the ascending channel .
In terms of Elliott Wave theory , Bitcoin appears to be completing a wave C of the Expanding Flat(ABC/3-3-5) .
I expect Bitcoin to rise to at least $116,910 if it even manages to break the ascending channel.
Second Target: $117,760
Stop Loss(SL): $$115,300
Cumulative Short Liquidation Leverage: $118,965-$117,906
Please respect each other's ideas and express them politely if you agree or disagree.
Bitcoin Analysis (BTCUSDT), 1-hour time frame.
Be sure to follow the updated ideas.
Do not forget to put a Stop loss for your positions (For every position you want to open).
Please follow your strategy and updates; this is just my Idea, and I will gladly see your ideas in this post.
Please do not forget the ✅' like '✅ button 🙏😊 & Share it with your friends; thanks, and Trade safe.
Bitcoin & Bullish DivergenceBitcoin is retracing to 61% of the Fibonacci level from 107k to 118k, forming a bullish divergence on the 4-hour RSI, which should push the price to higher levels.

BTCUSDTCRYPTOCAP:BTC is important on key level because reaction to 50% latest bullish trend.
Wait for breaked trendline for buy.

A descending channel/bullflag reveals itself on btcusdThe pole looks more obvious on longer timeframe charts but the flag/ channel itself is best illustrated on the 1day time frame. In fact there is a much longer pole than the one shown here on the monthly chart, but I didn’t go with that one because the flag on the monthly is more of a horizontal channel than the descending channel shown here on the 1day chart. *not financial advice*

BTC 4H Analysis - Key Triggers Ahead | Day 43😃 Hey , how's it going ? Come over here — Winter got something for you!
⏰ We’re analyzing BTC on the 4-Hour timeframe.
👀 On the 4H timeframe of Bitcoin, we see that after the recent interest rate cut news, price started moving down. It seems that the potential upside from the news was already priced in by traders. Right now, BTC is trading in a range between resistance at $117,573 and support at $114,828. A breakout of either side could send the price toward the next support or resistance. For now, the market will likely move into a range condition, where the win rate of most setups drops, so it’s better to trade with lower risk.
🧮 Looking at the RSI oscillator, it is near a support zone below the 50 level. The two key levels to watch are 40 and 70. If RSI breaks above or below these zones, Bitcoin could start a new move.
🕯 Currently, the size, volume, and number of red candles are increasing. As BTC approaches support, some buy orders have been triggered. The key question is whether this support zone is strong enough to hold the price until the new week begins. Since the ATH, every correction has faced strong selling pressure from major sellers (maker sellers).
🧠 At this stage, Bitcoin itself may not provide the best setups for positions. However, altcoins that are showing bullish divergence or relative strength against BTC could present better opportunities. We can track these coins on platforms like TradingView or CoinMarketCap, identify their triggers, and look for long entries if the setups are valid.
❤️ Disclaimer : This analysis is purely based on my personal opinion and I only trade if the stated triggers are activated .

AXS: Coiling Up for a Shakeout?AXS is stuck between floors and ceilings, grinding inside a tight rising wedge. While the macro picture looks juicy with the Fed turning on the liquidity taps, the on-chain data for AXS is telling a different story. We're seeing a classic setup where the chart looks bullish from afar, but the internals are weak.
Our game plan is to watch for a breakdown. The bulls' line of defense is the wedge support around $33.50. A clean break below that level opens the door to our primary target zone, a liquidity magnet around $31.90-$30.50. This area is a major support cluster and a logical place for a healthy reset before the next leg. Heavy resistance sits at the recent high of $35.76.
Patience is key here; we're waiting for the market to show its hand while the crowd gets chopped up. Don't be the exit liquidity for underwater holders looking to break even on this bounce. Smart money waits for confirmation.
BTC 1H Aanalysis - Key Triggers Ahead | Day 42😃 Hey , how's it going ? Come over here — Winter got something for you!
⏰ We’re analyzing BTC on the 1-Hour timeframe.
👀 On the 1-hour timeframe for Bitcoin, we can see that after reaching the seller trigger zone around $117,825, price was rejected to the downside. Currently, it is losing an important support level on this timeframe, and if we get a candle close below this zone, Bitcoin will likely move toward the buyer trigger area. After that, the market will enter a decision-making phase, where we will have to wait and see what happens in the coming week.
🧮 Looking at the RSI oscillator, there is a key level around 34. If momentum breaks below this level, we could see a deeper correction in Bitcoin’s price.
🕯 The size and volume of red candles are increasing, showing that many traders are selling Bitcoin and closing their long contracts. We need to watch how far this selling pressure continues. This correction, along with the selling momentum, is not unusual — it’s a natural part of Bitcoin’s price movement. Once this correction is complete, we’ll need to see what structure Bitcoin forms next.
🧠 For Bitcoin to make a real bullish reversal without entering an accumulation phase, the support level currently being lost could turn into a strong resistance trigger for future long positions. However, the main trigger remains at $117,825. If Bitcoin breaks above and holds that level, it could even set a new all-time high (ATH).
❤️ Disclaimer : This analysis is purely based on my personal opinion and I only trade if the stated triggers are activated .

BITCOIN PREDICTION: THIS IS THE NEXT TARGET (scary) Yello Paradisers! Enjoy the video!
And Paradisers! Keep in mind to trade only with a proper professional trading strategy. Wait for confirmations. Play with tactics. This is the only way you can be long-term profitable.
Remember, don’t trade without confirmations. Wait for them before creating a trade. Be disciplined, patient, and emotionally controlled. Only trade the highest probability setups with the greatest risk to reward ratio. This will ensure that you become a long-term profitable professional trader.
Don't be a gambler. Don't try to get rich quick. Make sure that your trading is professionally based on proper strategies and trade tactics.

$BTC Bullish Daily Close - HIGHERCRYPTOCAP:BTC closed just where it needed to close today, grabbing upside liquidity.
Need to hold this $117k mark and keep momentum above the 9EMA.
Still on for ATH Sept 23-30th.

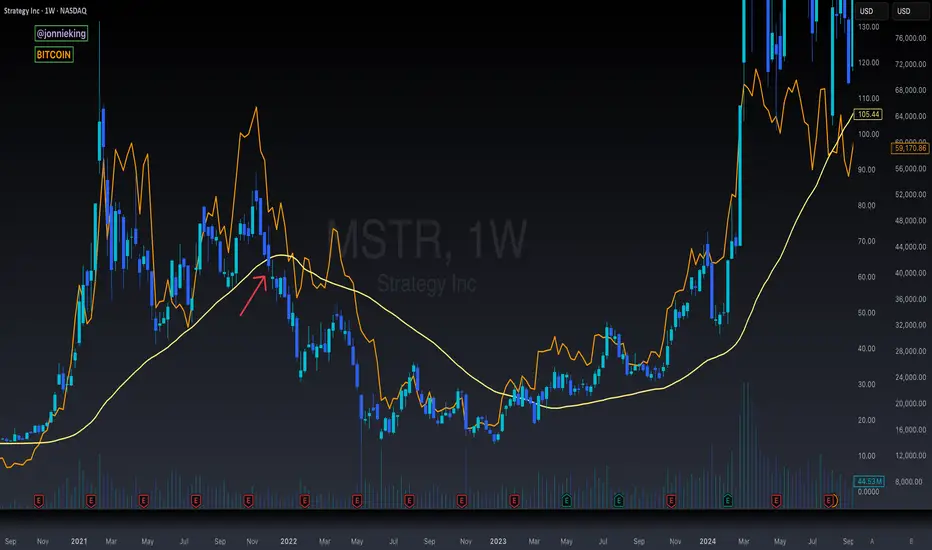
$MSTR Falling Below the 50WMA in 2021 Bull Market Here's a look at last cycle where NASDAQ:MSTR trading under the 50WMA for several weeks led to the CRYPTOCAP:BTC bear market.
The reason why this was so significant last cycle is because they were responsible for such a large share of BTC buy pressure.
This cycle we have lots of other treasury companies, with many more to come, as well as ETFs of course, so I'm not as concerned with this PA.