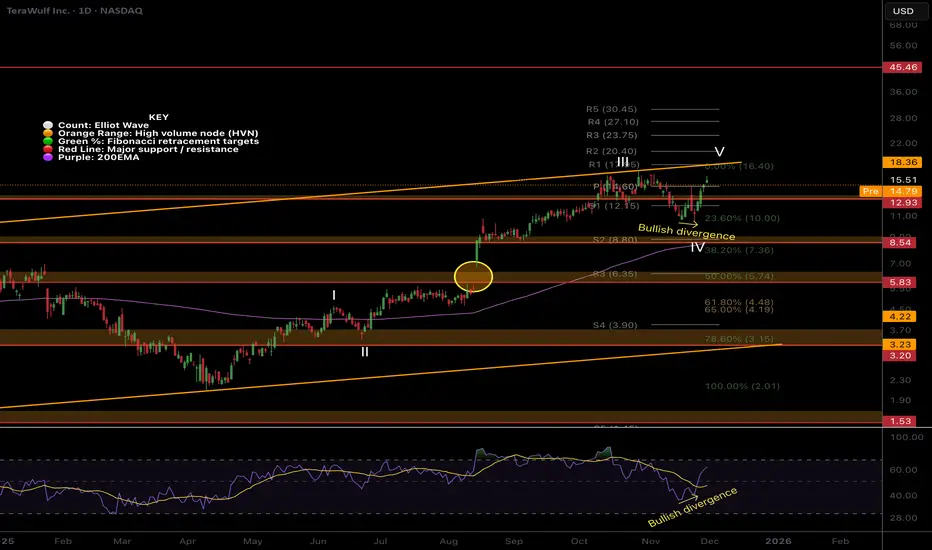
WULF LocalPrice caught a bid above the daily 200EMA on bullish divergence. It’s possible a triangle is forming for wave IV.
Price is stuck between the breakout upper-boundary and mean support, its hard to decipher the next direction as it stands. A breakout above the line could see it rally to $25 while back below wave IV would test the 200EMA.
📈 Daily RSI had confirmed bullish divergence but not from oversold
👉 Continued upside will invalidate this analysis.
Safe trading
Btc-bitcoin
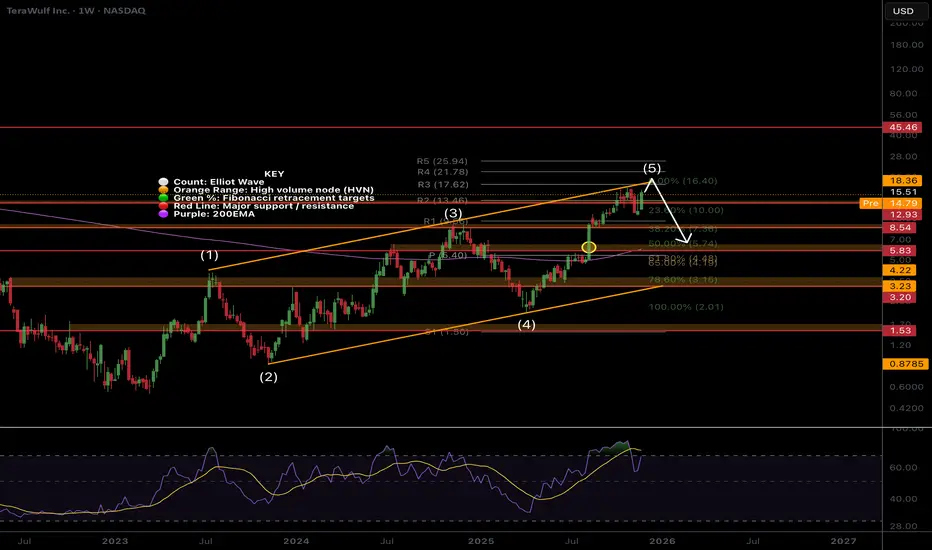
WULF Macro looks exhausted... pullback before higherNASDAQ:WULF Price appears exhausted at the upper channel boundary, and I have exited completely for now. The Elliot wave pattern completes a leading diagonal, which hints at higher to go after a deep wave 2 pullback, which could end at the 0.382 Fibonacci retracement, $8, but a more likely target is the 0.5 Fib at $5.84 with downside momentum. Also the weekly 200EMA.
Breaking out above the channel would change the count and structure and be very bullish. RSI has been overbought for a while. For now, I watch and wait.
🎯 Terminal target for the business cycle could see prices as high as $25 based on weekly pivots
📈 Weekly RSI is oversold with no divergence and can remain here for months as price keeps increasing.
👉 Analysis is invalidated if we close back above $20
Fair value sits at $11.
Safe trading
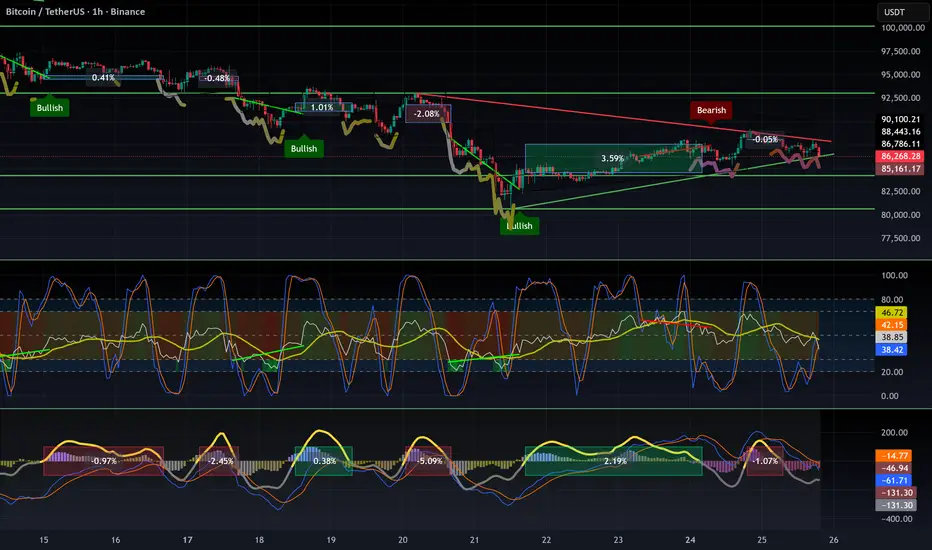
BTC: The Bitcoin bounce is not a trend reversal🚫 The Bitcoin bounce is not a trend reversal
Here’s why the current move looks more like a liquidity trap than a real bullish reversal:
- Momentum is lagging — the rebound isn’t supported by strength.
- Liquidity spikes look engineered to squeeze short positions rather than coming from genuine buyers.
- ETFs are selling while BTC is pumping → classic exit liquidity behaviour.
- We remain in a bearish trend, and the current flag pattern is on the verge of breaking. Statistically, these patterns break down, with targets equal to the size of the previous leg.
- Price is rising while volume is falling → this is a hidden bearish divergence on volume.
🎯 What I’m seeing
It looks like many institutions were caught off guard by the depth of this downtrend, and now they’re trying to reduce exposure.
They appear to be engineering a bounce to attract retail FOMO, allowing them to exit with smaller losses — a classic liquidity extraction move.
As I’ve mentioned several times already:
👉 The primary trend remains bearish until Q2 2026, though we should expect bounces and manipulative moves along the way.
⚠️ My advice
Don’t deploy all your capital into a fake FOMO rally and become the institutions’ exit liquidity.
Wait for a proper bottom confirmation, such as:
A W pattern, followed by a successful retest with a higher low.
❌ Invalidation
This analysis becomes invalid only if the current pattern breaks upward with strong volume.
DYOR
BITCOIN → Retest of the 94,000 zone of interest...BINANCE:BTCUSDT.P is rebounding from its interim low of 80,000. However, it is still too early to talk about a bull market, as a countertrend correction is forming under the current circumstances.
Globally, Bitcoin is in a downtrend, with the zone of interest for a countertrend correction being 94,000-95,000. The market structure is bearish, and a retest of the break-even zone could trigger a downward movement within the trend.
After a strong liquidation to 80K, the market is forming a pullback, which is a basic phenomenon. There is no confirmation of a trend reversal yet, and the fundamental background is neutral, without clear support. Various analytical services suggest that the market is in a cleansing phase and has so far only liquidated short-term traders, reaching a cumulative average break-even price. A classic pullback. Technically, the zone of interest or magnet for the medium-term market is 75K (on the daily timeframe).
Resistance levels: 93,000, 94,000, 97,300
Support levels: 89,000, 86,000
In the current situation: a bearish trend, weak purchasing power, and a weak fundamental background, I consider a pullback to be the primary reaction to the 93-94K zone. However, the market is not constant, and if support appears (news or other drivers) and Bitcoin manages to stay above 95K, then growth can be expected.
Sincerely, R. Linda!

BTCUSDT.P - December 1, 2025The chart shows Bitcoin breaking down sharply from a rising wedge‑type structure after failing to sustain prices above the 91,000–91,500 resistance band, confirming short‑term bearish momentum on the 15‑minute timeframe. Immediate support sits around 86,000–85,500 where price is currently reacting, but the highlighted lower zone near 82,000–81,500 represents the next downside target if this local support gives way, aligning with the projected stop level for any counter‑trend long attempt. The higher‑probability play is to wait for either a clear bullish reversal pattern and strong candles off the 85,500–86,000 area to target a corrective bounce back toward 91,000, or a weak consolidation followed by continuation selling into the lower support box to consider fresh shorts with stops above the broken intraday resistance.

BTCUSD 1W - My Thoughts Going into Dec 1 2025 Week BTC heads into the first week of December in a clear corrective phase, with price likely to remain choppy as it digests the recent downside move. The mid-80k zone is acting as an interim equilibrium, but the broader structure still favors a deeper liquidity sweep toward the 70k-73k support band before any meaningful trend re-acceleration.
Volatility should remain elevated, and the market is positioned to shake out weak hands during this chop. Structurally, pullbacks into key supports continue to define the higher timeframe trend, while sellers are losing momentum on each leg lower.

Bitcoin 1 000 000$ ❚ Livermore cylinder📣 Hello everyone!
I bring to your attention my, I’m not afraid of this word, GLOBAL trading idea for Bitcoin for the decade ahead!
☝️ Now let me, as briefly but informatively as possible, explain to you how, step by step, Bitcoin will most likely come to $1,000,000 dollars, as well as what the two most serious risk factors are today ⚡️
In 1929, Jesse Livermore published this hypothetical chart (bottom right) showing “The Most Important Thing Happening to the Price of A Stock.” At the beginning of this pattern there is an expanding accumulation wedge, an upward “megaphone” (“horn”) formed from two sloping trend support/resistance lines. In the original, according to Livermore, it is necessary to take into account the volume when forming a pattern, but in my opinion, in relation to Bitcoin, it is better to take into account the spread; I removed this turkey from the final chart for the aesthetic reasons of the trading idea, so let’s study it on our own.
Having spent quite a lot of time on multiple technical and fundamental analysis of BTC, as well as taking into account trends in the macroeconomics of the United States and the world economy as a whole, I came to the conclusion that a very strong bullish pattern is forming on the Bitcoin chart - the EXPANDING WEDGE OF LIVERMORE ACCUMULATION!
This means that from the birth of Bitcoin until 2024, all these bullish and bearish microcycles are a period of accumulation of the asset!
🔹 Now briefly on key points according to the pattern:
1️⃣ All-time Low (ATL) - the minimum price of Bitcoin in its entire history, the birth of an asset!
2️⃣ ATH 2017 – First serious takeoff 🚀 Maximum of the bullish rally that ended in 2017 in the 19-20 k$ zone
3️⃣ Low 2018 – minimum correction after ATN 2017
4️⃣ ATH 2021 – a new absolute historical maximum in the area of 69k$, which only a few spoke about in 2019, including me with my trading idea Bitcoin $55 k$
5️⃣ Correction completed - low 15.4 k$ - Correction to growth to $69,000 completed in November 2022
6️⃣ The end of the bullish rally 2022-2025 - Bitcoin price 115-150 k$
- According to the graphical pattern I am considering, the long-term upward trend will most likely be limited in growth, taking into account the error on the monthly frame, by the zone of 115 - 150 k$ - At the moment, Bitcoin is consolidating above 60 k$.
The second inflation wave will force the Fed to return to tightening monetary policy after the US elections, probably closer to the second half of 2025 or even by the end of this year! Bitcoin will set a new ATH before this time and a long-term bearish trend will begin.
7️⃣ In 2027 - low correction ≈ 30 k$, the Fed is forced to give up, the war against inflation is lost. The start of an unprecedented QE... FED Money printer - brrrrr.....
- In 2027, the Fed will be forced to surrender, the war against inflation is lost. The United States will solve all its problems in the only possible way - launching a printing press and unprecedented QE. 2027 marks the start of the dollar's descent into hyperinflation.
The Bitcoin correction will end at 30 k$ +-10%, this will be the last opportunity to buy before the bull market of the century, the realization of an exit from almost 20 years of accumulation!
8️⃣ The most powerful and fastest bull rally in history! The first wave after exiting
accumulation. Hyperinflation in the USA...
- The most powerful and fastest increase in the price of Bitcoin in history! The first wave of the bullrun after exiting accumulation, within 1-2 years the mark of 500 k$ per coin will be reached. The United States is plunging into hyperinflation, the dollar is leaving the world stage, and the yuan is taking its place. Digital assets and commodity markets are growing.
9️⃣ ATH is coming soon... The second wave of the bull rally!
- Soon there will be ATH in pairs with the dollar... The second wave of the bullish rally! Hyperinflation is growing, the Fed can do nothing more - the phrase “dollar collapse” will sparkle with new colors among skeptics.
1️⃣0️⃣ Bitcoin $1,000,000 + "Bubble Peak"
– Bitcoin has crossed the $1,000,000 mark, the peak of the dollar bubble. In 2030-2035, the dollar may cease to exist as a currency in general; trading against the dollar may simply be stopped.
The value of BTC will already be measured, for example, against gold in the BTC/GOLD pair, or the Chinese yuan BTC/CNY.
_____________________________________
⚠️ This could have been the end, so to speak, to put an end to this trading idea. Further points make sense only if the dollar still exists, which is unlikely from my point of view. I just don't know what should happen. But I still outlined further points on the original Livermore pattern in this trading idea.
________________________________________
1️⃣1️⃣ BTC first major sale
– the first major sale of Bitcoin, since there is no such thing as eternal growth! Sooner or later there will always be people willing to sell; former bulls begin to sell short!
1️⃣2️⃣ Test 1 000 000$ before selling short!
– A round psychological level of one million dollars will be like the 10 k$ level for Bitcoin at one time; the price will interact with it more than once. 1 000 000$ test, followed by a powerful dump.
1️⃣3️⃣ Long-term correction near strong support 500 k$,1M timeframe
- Long-term correction - strong support 500 k$, timeframe 1 month.
1️⃣4️⃣ Flat correction – Another flat correction in a bear market, or any other.
1️⃣5️⃣ Strong support 100 k$ - Strong support in the area of 100 k$ - the formation of the bottom before a new growth cycle, it will probably already be >10 000 000$ (assuming the dollar exists at all!)
🔹 I note two global risk factors that could make significant adjustments to this global trading idea:
1️⃣ This is the government's fight against Bitcoin. I believe that in 2025-2027 Bitcoin will come under pressure from the US government, when it is already clear that Bitcoin poses a real threat to the dollar. Ultimately, Bitcoin will emerge victorious from this situation and there will be growth. The main trigger for the future bear market phase from my point of view!
2️⃣ The second threat is more significant. Bitcoin depends on electricity and miners in particular. Planet Earth is entering a cycle of natural disasters that will increase exponentially every year. Many areas in the world will become uninhabitable. Sooner or later, large miners will come under attack, what geolocations they will be and who will suffer first - I don’t know for sure! The network may not die completely, provided that the life of humanity and technology on Earth is preserved. But it is impossible to predict what damage will happen to the price of Bitcoin in this case.
⚠️ That's all for today, I wish you good luck in making independent trading decisions and profit. Please analyze the information received from me, always think only with your own head!
Goodbye! ✊

ETH vs BTC- Sometimes when we look at markets, we get confused by all the noise, Trump and governments news, ETFs, FED, bans, SEC, FUD, FOMO, fake stories, and more.
- As a trader, you must always step back from news, view the trend from a distance, and filter out that noise.
--------------------------------------------------------------------------------------------------------
Trading Parts (Monthly TF) :
--------------------------------------------------------------------------------------------------------
- Look at the trend and indicators, that’s what you should focus on first. ETH reached its all-time high in November 2021, and then retested that same ATH level in August 2025.
- Now look at the RSI and MACD levels at that time... In 2021, the RSI was overbought and the MACD crossed downward.
- Alright, now compare with where we are today. The RSI is only halfway to the top (even though ETH has already reached $5K again), and the MACD just crossed upward a few months earlier.
--------------------------------------------------------------------------------------------------------
In my opinion, we’re not topped yet and ETH still low. They will always try to scare you out so they can buy your bags cheaper.
Keep your attention on the opportunities others can’t see.
Happy Tr4Ding !

BTCUSDT.P - November 30, 2025The chart shows Bitcoin in a short‑term downtrend on the 15‑minute timeframe, with price consolidating in a tight range after a strong impulsive selloff, indicating corrective structure rather than a confirmed reversal yet. Resistance is clearly defined around 92,600–92,800 where prior selling pressure emerged, while immediate intraday support is clustered near 90,500–90,600, with a deeper support zone just below 90,000 acting as the invalidation area for the projected long setup. A break and 15‑minute close above the mid‑range resistance band around 91,200–91,300 would confirm bullish momentum and open the path for a trend‑continuation push toward the marked profit zone, whereas a failure there followed by a move back under 90,600 would favor another leg lower into the support block before any meaningful bounce.

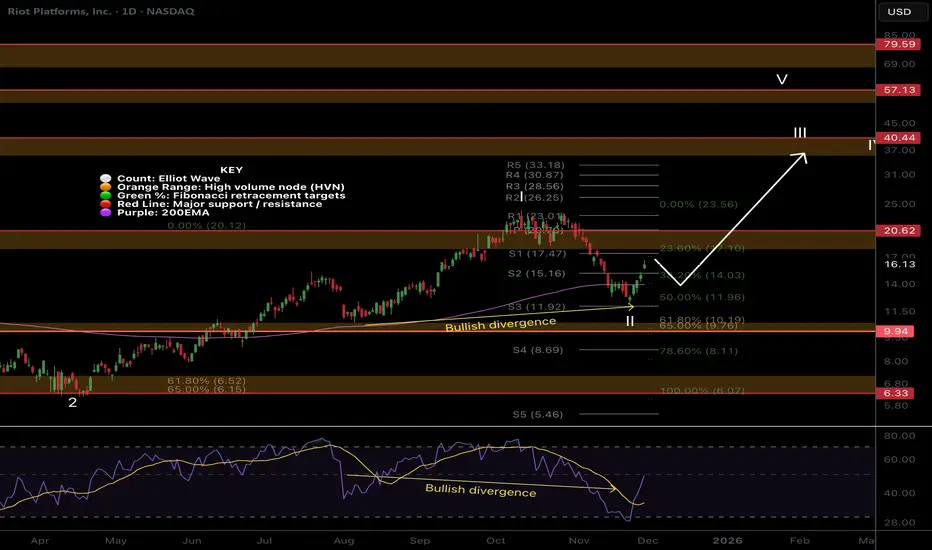
RIOT holding up stronger than the others..NASDAQ:RIOT Price remains in its uptrend and wave II of 3 appears complete with a 3 white knight bullish candle pattern.
Price recovered the daily 200EMA and looks rady for higher.
📈 Daily RSI hit oversold with bullish divergence
👉 Continued downside has a target of the High Volume Node, $10
Safe trading
MSTR nearing bottom?NASDAQ:MSTR Price dropped hard wave Y of IV, invalidating the previous analysis.
Wave Y can complete any time in this flat correction pattern, but is approaching the 0.382 Fibonacci retracement, a high probability bottom.
📈 Daily RSI went deep into oversold, negating the bullish divergence
👉 Continued downside has a target of the High Volume Node, $101
Safe trading

MARA struggling...NASDAQ:MARA Price dropped hard, changing the Elliott wave count completely, stopping at the golden pocket.
Wave (z) of B appears complete, but we need to see a structure change to add confirmation, so the probability is to the downside with a target of the $8 High Volume node.
📈 Daily RSI went deep into oversold
👉 Continued downside has a target of the High Volume Node, $8
Safe trading

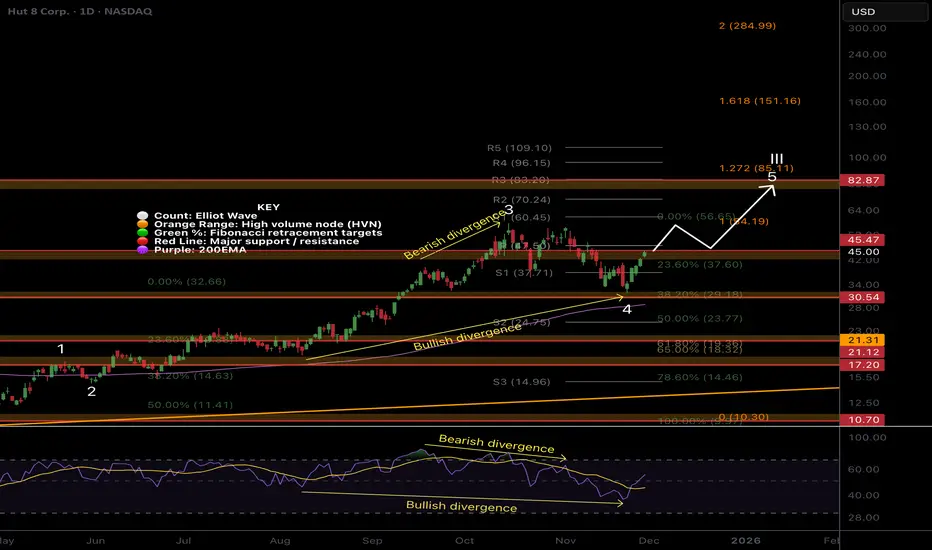
HUT ready for higher?NASDAQ:HUT Wave 4 appears complete at the 0.382 Fibonacci retracement and High Volume Node just above the daily 200EMA, proving its value by holding up better than the other assets.
Daily bearish divergence played out into bullish divergence as price caught a huge bid in the bullish, 3 white knights pattern. Resistance looms directly ahead, and a breakout above the daily pivot should see price head towards the $80 target High Volume Node.
📈 Daily RSI has printed a bullish divergence
👉 Continued downside has a target of the daily 200EMA, $28
Safe trading
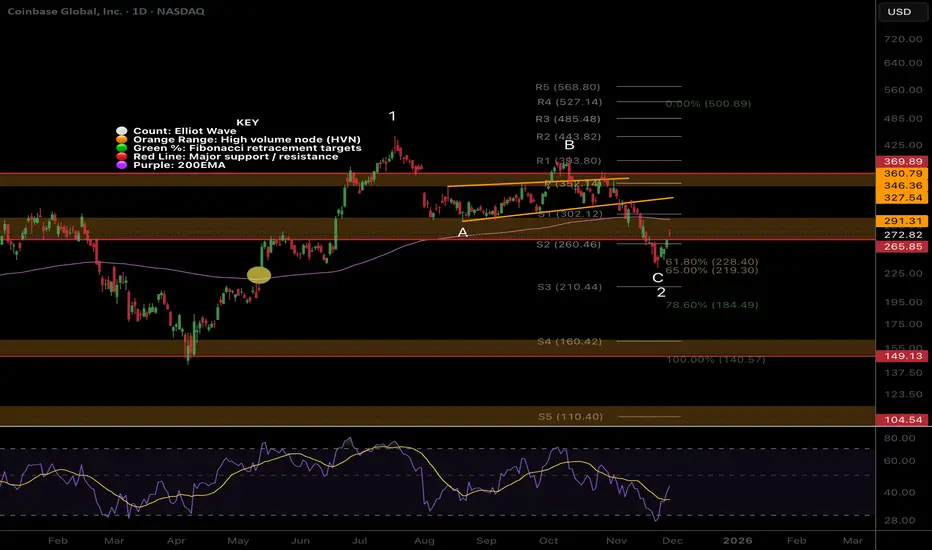
COIN bottom forming? Wave 4 changed to wave 2NASDAQ:COIN Price appears to be completing wave C of IV, a corrective pattern to the downsid,e expected to be shallow
Wave 4 was invalidated due to the retracement depth becoming wave 2 of V, which actually presents a bigger target for the wave 3 move to come. Price stopped at the golden pocket reflecting its higher cap characteristics.
📈 Daily RSI has printed a confirmed bullish divergence from oversold.
👉 Continued downside has a target of the S2 pivot at $210
Safe trading
CLSK 3 white knights, bullish divergenceNASDAQ:CLSK Price fell a dollar shy of breaking the triangle wave D target, keeping the triangle alive. The 3 green candle structure below is an extremely bullish pattern called 3 white knights.
Wave (2) of the triangle breakout move looks complete at the low-cap golden pocket 0.782 Fib. Wave (3) should be strong and powerful. Breaking out above the descending trend-line is the goal to find momentum. The target is the High Volume Node resistance, $42
📈 Daily RSI has printed a confirmed bullish divergence from oversold.
👉 Continued downside has a target of the High Volume Node at $8.41
Safe trading

BTDR savage dump, renewed opportunity?NASDAQ:BTDR Locally, the price broke into an all-time high as expected, but the depth of the crash was unexpected, losing 70% of its value in a matter of days. My trading signal took partial profit for 3.57RR at the highs, and the rest of the position was knocked out at breakeven, leaving us with an overall win.
Bullish divergence on a higher low from oversold has emerged. This was also at the 78.6 Fibonacci, where we expected low-cap assets to retrace to- usually marking a bottom. Price behaviour is a series of ABCs changing the overall dynamics. Wave B appears to have ended with wave C minimum target being $38.22 based on 1:1 Fib extensions, also the R3 pivot.
📈 Daily RSI has printed a confirmed bullish divergence from oversold.
👉 Continued downside has a target of $5.59 High Volume Node
Safe trading

Delta son goes to his mommy Just fantasies with no basis. A dream.
---
Hang Glider
High on the ridge I run and leap,
The ground falls back, the winds unfold;
My fragile wings no longer sleep,
They tense and sing in currents cold.
I carve a path through open blue,
A silent frame, a borrowed sky;
For just one glide I feel it’s true:
The earth can live without me, I.

BTCUSDT.P - November 29, 2025Bitcoin is trading in a sideways range after a sharp rejection from the 92,900 resistance area, with intraday structure showing lower highs capping price under the 91,200–91,300 band.
A key support shelf sits around 90,200–90,400; holding above this zone could fuel a range breakout back toward 92,900, while a decisive close below it would confirm a bearish rotation and expose the lower support region near 89,000.

BTCUSD - Daily Bearish View200MA can be seen on this daily timeframe to be a consistent point of support for this bullrun
This level has since been broken, suggesting bear movement coming on this timeframe.
Up arrows show the support along 200MA.

BTCUSDT.P - November 28, 2025Bitcoin is in a short‑term uptrend, riding a rising trendline after breaking out from prior consolidation and now pressing into a well‑defined resistance band around 92,100–92,600.
The chart outlines a tactical long setup with support around 90,100–90,200 as the key pivot; holding above this zone favors continuation toward the higher resistance/target region near 94,500–95,000, while a clean break back below the trendline would invalidate the bullish structure and open room for a deeper pullback.

BTC mid-term TABitcoin is having a relief rally from the continuous falling initiated by excessive selling, you may also see the MACD crossover, yes, but it's in bearish area and it's too early for the downtrend reversal, it's just a bounce or a short-lived rally, you may call it the way you like it, but the bearish downtrend is engaged and it's still very strong and it will need much more time and effort to finally bottom out. For now let's hope for X-mas rally to continue.
Watch for the resistance levels at 95k and the falling SMA50.

Bitcoin is approaching an important support level (1D)Bitcoin has entered a strong bearish structure.
It is currently near an important origin zone that has broken significant highs (BOS). It is expected to make an upward reversal from this area.
It’s natural for this momentum to require some base-building, and since the movement is on the daily timeframe, the upward reversal may take some time.
The target range is 95K to 96K.
A daily candle closing below the invalidation level will invalidate this analysis
Do not enter the position without capital management and stop setting
Comment if you have any questions
thank you

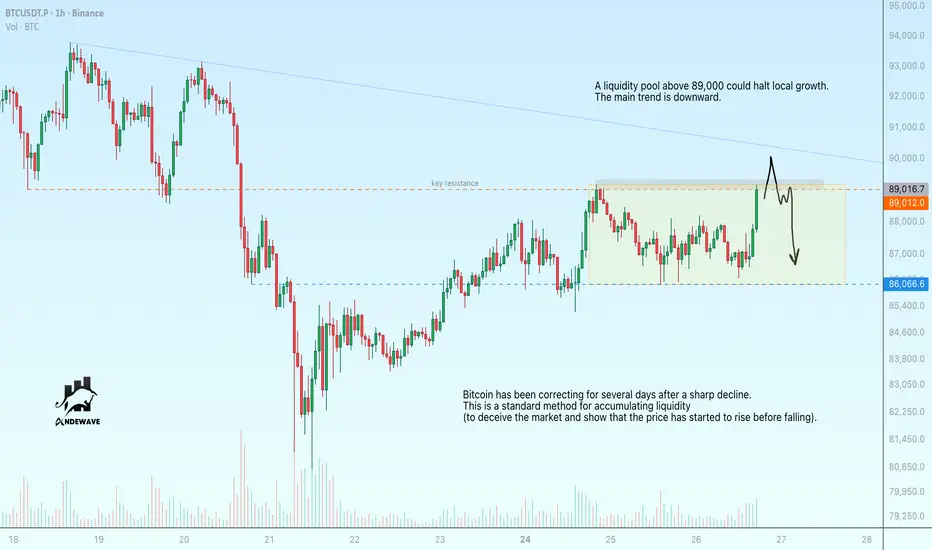
Bitcoin is testing 89,000. False breakout?Bitcoin is testing 89,000
A liquidity pool above 89,000 could halt local growth. The main trend is downward.
Bitcoin is undergoing a correction over several days after a sharp decline.
This is a standard tactic for accumulating liquidity (to deceive the market and show that the price has started to rise before falling).
A false breakout could reverse the local movement from upward to downward and send the price to 86K-83.5K