We took short on BTC at 113k We took short on BTC at 113k
why we did it?
price is in dawnward structure
rejected from vwap several times with volume spike
Btc-bitcoin

BTC Game Plan – Long OpportunityBTC Game Plan – Long Opportunity
📊 Market Sentiment
Market sentiment remains firmly bullish as the FED is expected to deliver a 0.25% rate cut, with growing speculation of a potential 0.5% cut in September. Monetary policy adjustments are being driven not only by inflation but also by weakening labor market data. The latest August and September job reports came in soft, signaling that the economy is cooling rapidly. This backdrop strengthens expectations for one of the most significant bullish runs in the weeks ahead.
📈 Technical Analysis
BTC has confirmed bullish momentum after breaking the bearish trendline.
Price action currently looks like an accumulation phase, preparing to expand liquidity higher. I see this as a range-bound delivery where price takes both sides of liquidity pools located at the extremes, rather than running directly into new all-time highs.
📌 Game Plan
1)Watch for price to retrace into the 4H demand zone around $109,400.
2)Look for liquidity sweep at the 4H swing lows.
3)Possible deeper retracement into the 0.75 discount zone near $108,700.
🎯 Setup Trigger
I will look for a confirmed 1H break of structure before entering long.
📋 Trade Management
Stoploss: Below the 1H swing low responsible for the BOS
Targets:
• TP1: $103,450
• TP2: $117,400
💬 Like, follow, and comment if you find this setup valuable!
⚠️ Disclaimer: This content is for informational and educational purposes only and does not constitute financial, investment, or trading advice. Always do your own research before making any financial decisions.

BTC – Bulls Guarding the Key Zone!Bitcoin is retesting a major support zone 🛡️ that overlaps with the previous ATH breakout level.
This area has been acting as a strong demand zone, keeping the overall structure bullish despite recent corrections.
As long as this zone holds, we will keep looking for long opportunities 📈, with the next wave of momentum likely pushing BTC higher. If the bulls manage to reclaim the minor resistance ahead, we could see them fully take over and drive price back into an upward rally.
For now, this zone remains a crucial pivot — watch closely for bullish confirmation signals.
⚠️ Disclaimer: This is not financial advice. Always do your own research and manage risk properly.
📚 Stick to your trading plan regarding entries, risk management, and trade execution.
Good luck!
All Strategies Are Good; If Managed Properly!
~Richard Nasr


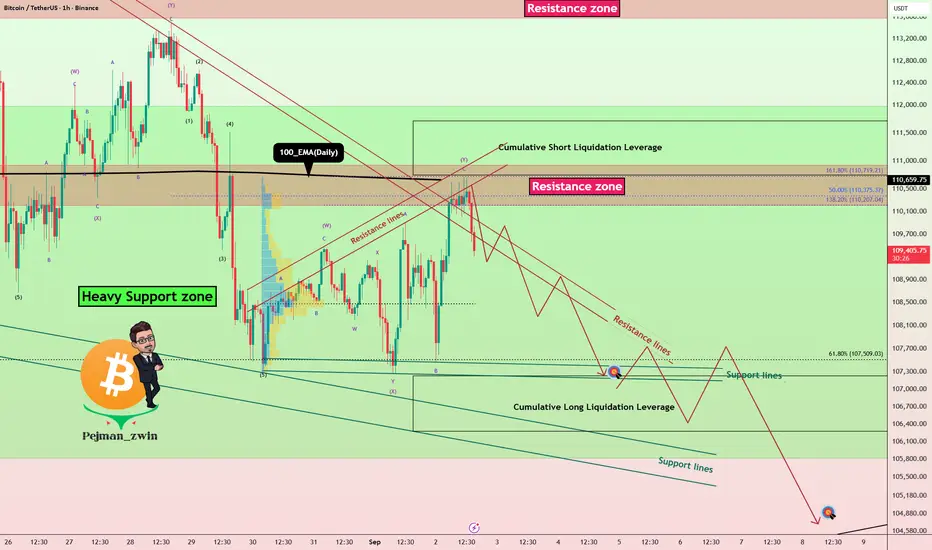
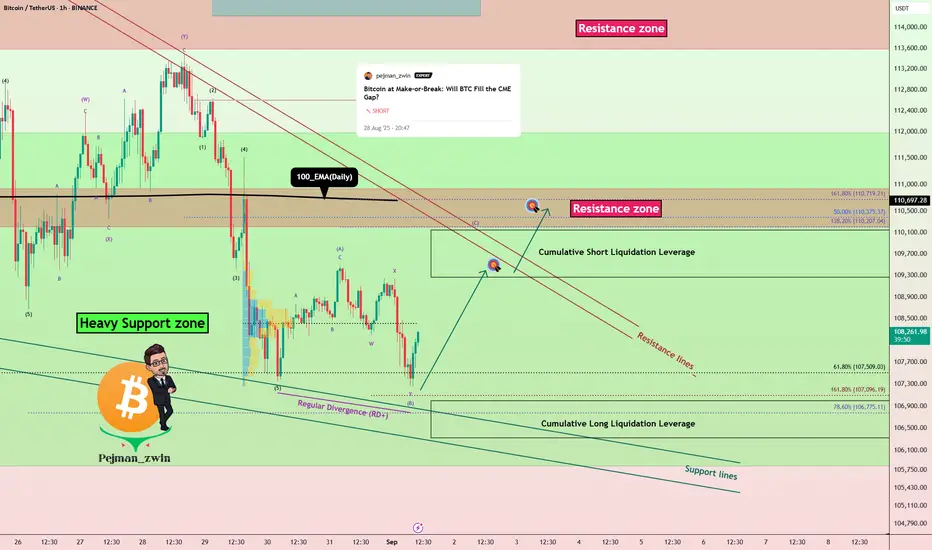
Bitcoin’s Heavy Support Zone Under Attack–Will It Finally Break?Bitcoin ( BINANCE:BTCUSDT ) currently appears to have completed its pullback to the 100_EMA(Daily) , and Bitcoin has failed to break the Resistance lines with high momentum. The Resistance zone($110,920-$110,200) , Resistance lines , and Cumulative Short Liquidation Leverage($111,711-$110,745) could prevent Bitcoin from rising.
In terms of Elliott Wave theory , Bitcoin appears to have completed the wave Y of the Double Three Correction(WXY) .
I expect Bitcoin to decline at least to the Support lines and Cumulative Long Liquidation Leverage($107,230-$106,277) . And there is a possibility that Bitcoin will eventually break the Heavy Support zone($111,980-$105,820) in this attack .
Do you think Bitcoin can finally break the Heavy Support zone($111,980-$105,820)?
CME Gap: $117,235-$113,800
Stop Loss(SL): $111,880(Worst)
Please respect each other's ideas and express them politely if you agree or disagree.
Bitcoin Analyze (BTCUSDT), 1-hour time frame.
Be sure to follow the updated ideas.
Do not forget to put a Stop loss for your positions (For every position you want to open).
Please follow your strategy and updates; this is just my Idea, and I will gladly see your ideas in this post.
Please do not forget the ✅' like '✅ button 🙏😊 & Share it with your friends; thanks, and Trade safe.
BITCOIN PREDICTION: SECRET PATTERN FORMING!!! (scary) Yello Paradisers! In this video, I have been analyzing Bitcoin for you on multiple time frames because we are doing professional trading analysis. On the ultra-high timeframe chart, I have been showing you the ABC corrective mode wave formation that we are doing right now and the next targets from an ultra-high timeframe perspective. Thanks to this, we can better understand the context of the overall market and make better trading ideas on lower timeframes.
On the high timeframe chart, I'm sharing with you that the zigzag of that ultra high timeframe degree B wave was, with the highest probability, finished. We are right now working on the first wave from a lower degree. I'm sharing with you also the bullish divergence.
On the medium timeframe chart, I'm putting your focus on the volume, which is dropping with the price rising. This is usually a sign of bulls being weak. Confluence this with being at resistance; it's usually a recipe for a reversal.We are also seeing two bearish divergences, which need to be confirmed, but the medium time frame is kind of bearish.
On the lower timeframe chart, I'm revealing to you the secret pattern formation: the ending diagonal. The Fibonacci sequence levels are sharing with you all the supports and resistances. I forgot to show you the confirmed bearish cross, but that's okay because the ending diagonal itself is revealing to us the next highest probability movement of Bitcoin.
Paradisers! Keep in mind to trade only with a proper professional trading strategy. Wait for confirmations. Play with tactics. This is the only way you can be long-term profitable.
Remember, don’t trade without confirmations. Wait for them before creating a trade. Be disciplined, patient, and emotionally controlled. Only trade the highest probability setups with the greatest risk to reward ratio. This will ensure that you become a long-term profitable professional trader.
Don't be a gambler. Don't try to get rich quick. Make sure that your trading is professionally based on proper strategies and trade tactics.

A potential path to 134kIt appears bitcoin is breaking up from a bulllish pennant who’s top trendline seems most valid on the 4hr chart, its bottom trendline most valid on the daily chart and its flag pole most valid on the weekly chart. Sometimes patterns will be cross timeline like that. If this is the pattern that is about to be validated, we should see confirmation in the form of price action using the dotted measured move line like a ladder and as support in the near future as well as also potentially resistance later on on the way to the target. When you see that type of thing occur, probability increases that this is the real breakout. *not financial advice*

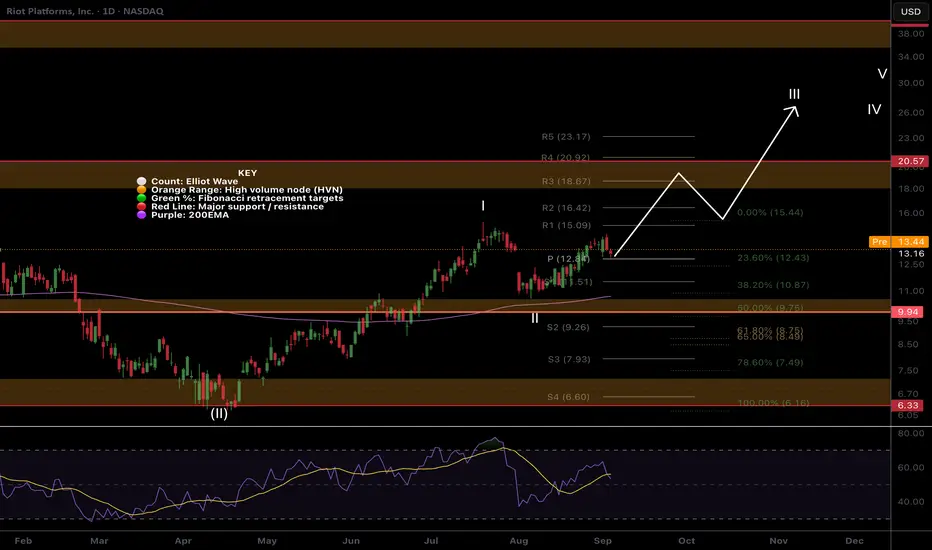
RIOT Wave 3 Begun?NASDAQ:RIOT appears to be in wave III with wave II bottoming at the High Volume Node (HVN) support and daily 200EMA.
The first target is the HVN resistance and R3 pivot at $18.67 but if the count is correct we should extend above that. RSI is sitting comfortably with room to grow.
Analysis is invalidated below wave II, $10.50.
Safe trading
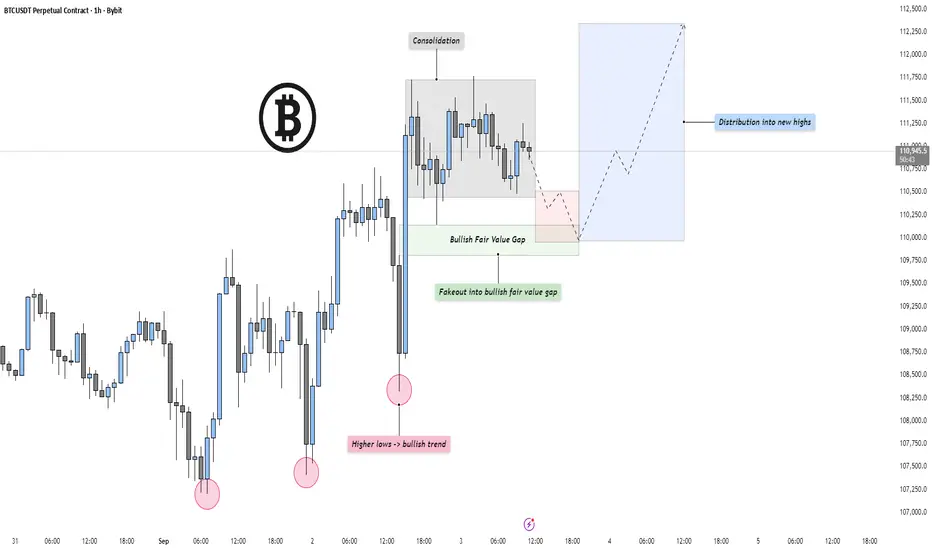
BTC - Consolidation, Manipulation & Distribution into new HighsMarket Context
BTC is currently printing a series of higher lows, which signals a bullish underlying trend despite short-term volatility. Each dip has been defended, showing that buyers are stepping in earlier with every pullback. This type of structure often builds the foundation for an eventual breakout higher.
Consolidation Phase
After the strong bounce from recent lows, price has moved into a tight consolidation range. This is a classic "cooling-off" period where liquidity builds up and traders wait for direction. Consolidations at this stage often precede expansion moves, and the side that breaks tends to dictate the next wave of momentum.
Bullish Fair Value Gap & Fakeout
Just below the consolidation lies a Bullish Fair Value Gap. Price may fake out to the downside into this zone, trapping breakout sellers and filling imbalance before reclaiming levels. This setup is particularly interesting because the higher-timeframe structure still favors the bulls, making the FVG a potential springboard for continuation.
Distribution into New Highs
If the FVG reacts as expected, the next phase would likely be distribution into new highs. That means clearing out liquidity above the consolidation and targeting the next round of upside expansion. In this scenario, the higher lows, the fakeout trap, and the FVG all align to fuel the breakout.
Final Thoughts
The higher-low structure gives this setup a bullish tilt, but the real clue will come from how price behaves around the Fair Value Gap. A clean reaction there could be the trigger for a sharp push into new highs.
If this breakdown gave you clarity on the structure, a like would be appreciated — and drop your thoughts in the comments. Do you expect the fakeout into the FVG, or are you positioned differently?
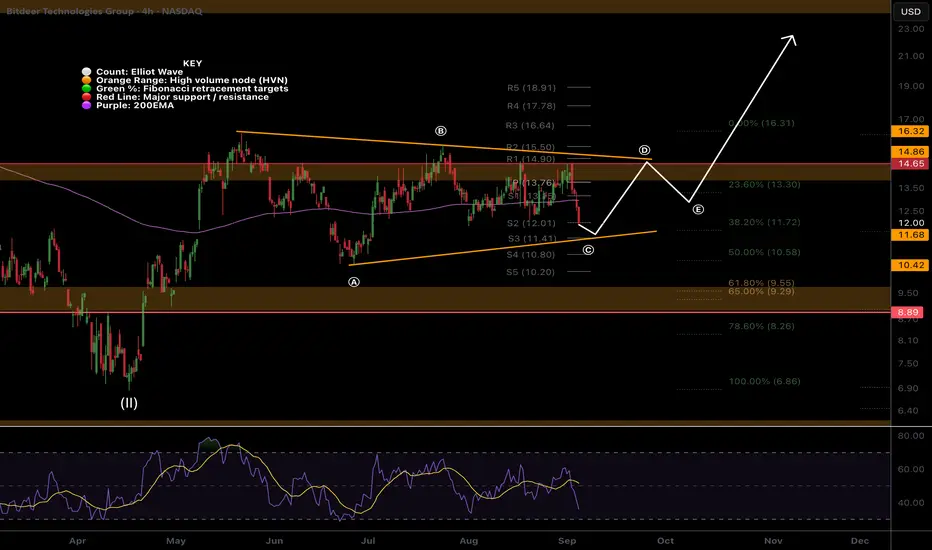
BTDR Still in a triangle, Wave c of (C) downNASDAQ:BTDR Bitdeer was rejected harshly on the 4th test of the High Volume Node (HVN) resistance, each test weakening the Node and adding probability to a breakout.
Wave c of an ABC within a triangle wave (C) appears to be underway with price closing below both the daily pivot and 200EMA. RSI has slight bullish divergence.
Until we get a break below wave (A) or a above wave (B) the analysis is good. Will readjust and update if anything changes. A breakdown below the triangle has a wave 2 target of the golden pocket Fibonacci retracement and HVN support at $9.63 and may offer a great buying opportunity.
Breakout target is the R5 daily pivot at $21.84
Safe trading
bitcoin's Situation (daily) !!!The price is at the channel's bottom, and if it follows the previous Pump from bottom of thechannel pattern, the price could reach the channel's top.
Best regards CobraVanguard.💚

BTCUSD BUY NOW 110650BTCUSD Long Setup
📈 Entry: 110700
🛡️ Stop Loss: 110400
🎯 Take Profit: 111600
Bullish momentum spotted near support zone. Targeting short-term breakout with tight risk control. Ideal for intraday scalpers and momentum traders.

Ethereum 4H Range As we approach nearly a month in the range from $4000-4800 it looks like ETH is making a move once again.
Previously once hitting $4800 price gradually sold off back towards range low creating a bearish trendline, once the price broken above that level a rapid move up to range high within two candles.
Now looking at the chart we have a similar setup, strong breakout from the bearish trendline up into midpoint. Bitcoin currently retesting a key level of $112,000, should BTC flip this level I could see alts getting the greenlight to move up and Ethereum up to the highs.
Should BTC reject from $112,000 it makes sense that ETH range midpoint would be strong resistance, rejection could lead to a range low retest. Anything else that isn't either range high, range low or midpoint is noise and for me no action required, no need to over complicate it.

BITCOIN PREDICTION: WHY IS NOBODY TALKING ABOUT THIS!!?(warning)Yello Paradisers! In this video, we are again, as professional traders, analyzing the multi-time frame context of the market. On an ultra-high time frame, we are seeing the medium moving average touch. We are also discussing the possible channel retest, plus I'm sharing with you the bearish cross and bearish divergence.
On the high time frame chart, we are having the zigzag finished, probably with the highest probability. The first ultra-high time frame wave is starting, that is the question of this video, which we are answering, and we are seeing the bullish divergence.
On the medium timeframe, we are seeing that as we are touching the resistance, the volume is dropping, which is a bearish sign. We are seeing two bearish divergences on RSI and MACD histogram, and with the highest probability, we are finishing the first wave.
On the low timeframe chart, I'm discussing the ending diagonal with you, and I forgot to tell you about this, but we are also having a bearish cross there.
Paradisers! Keep in mind to trade only with a proper professional trading strategy. Wait for confirmations. Play with tactics. This is the only way you can be long-term profitable.
Remember, don’t trade without confirmations. Wait for them before creating a trade. Be disciplined, patient, and emotionally controlled. Only trade the highest probability setups with the greatest risk to reward ratio. This will ensure that you become a long-term profitable professional trader.
Don't be a gambler. Don't try to get rich quick. Make sure that your trading is professionally based on proper strategies and trade tactics.

BTC - Perfect Bullish SetupPrice Action Breakdown
After running the lows with a clear Sell Side Liquidity Sweep, BTC quickly reversed and printed a Market Structure Shift (MSS). This marked the first real sign that the market might be ready to transition from weakness into strength.
Retracement Zone
Price is now retracing into a very interesting area — the overlap of a Bullish Fair Value Gap, an IFVG, and the Golden Pocket. When multiple imbalances and Fibonacci levels line up like this, it often builds a high-probability zone where institutions look to re-accumulate positions before the next move higher.
Upside Target
If this area holds and buyers step in, the next logical draw on liquidity sits above Buy Side Liquidity. That pool of stops acts like a magnet, and with the prior lows already cleaned, the path of least resistance could be higher.
Invalidation
On the other hand, a failure to hold inside the Golden Pocket would weaken this bullish narrative. A clean break below the sweep low would suggest that this rebound was only temporary relief before further downside.
Final Thoughts
This setup is all about how price reacts inside the retracement zone. If we see strength here, the run toward Buy Side Liquidity is very much in play. If not, patience will pay, as deeper levels will likely come into focus.
What’s your take — do you see this zone holding, or are you expecting another flush?

BTC has formed an inverted Head & Shoulders pattern 🚨 CRYPTOCAP:BTC Bullish Pattern Alert! 🚨
CRYPTOCAP:BTC has formed an inverted Head & Shoulders pattern 🔄
👉 If price breaks out above the neckline, it would confirm a bullish trend 📈
⚠️ Key point: Breakout confirmation above the neckline is crucial — watch for retests to avoid fakeouts.
👉 A confirmed breakout would signal strong bullish continuation with buyers in control ✅

BTC Breakdown Alert: Bears Eye $106K Next!
🔥 **BTC Bears Ready to Attack? 🚨 Target \$106K Incoming!** 🔥
📊 **Market Bias**
⏳ **Intraday → 4H**: 🟥 Bearish (⬇️ below EMA9/21/20SMA, 📉 MACD negative, 💥 sell volume)
📅 **Daily → Weekly**: ✅ Mixed-to-Bullish (📈 above 200 SMA ≈ 101.3k)
⚖️ → Tactical short only, ⚠️ size carefully.
🎯 **Trade Plan**
💰 Entry: **109,200**
🛑 Stop Loss: **110,800**
🎯 Take Profit: **102,400** (⚡ 50% at 105,900 / 50% at 102,400)
📏 Size: **1 BTC** (risk \~1%)
💪 Confidence: **60%**
⏰ Timing: **Market Open**
🧠 **Why Short?**
* 📉 EMAs/SMA bearish stack
* 🔻 Expanding negative MACD
* 🧊 Heavier sell volume
* 🎯 BB extension aligns w/ \~102.4k
⚠️ **Risks**
* ❓ Missing OI/liquidity data = squeeze risk
* 📈 Long-term bullish structure > 200 SMA
* 🌍 Macro shocks (ETF/reg headlines, DXY swings)
---
📊 **TRADE JSON (automation/record):**
```json
{
"instrument": "BTC",
"direction": "short",
"entry_price": 109200.00,
"stop_loss": 110800.00,
"take_profit": 106000.00,
"size": 1.0,
"confidence": 0.60,
"entry_timing": "market_open",
"signal_publish_time": "2025-09-01 17:02:46"
}
```
---
🏷️ **Hashtags:**
\#BTC 🚀 #Bitcoin 💎 #CryptoTrading 📊 #TradeSetup 🐻 #ShortTrade ⚡ #DayTrading ⏳ #RiskManagement 🛡️ #SwingTrade 🎯

BTC/USDT – Bullish Momentum Brewing! Are You In?🚀 Trade Setup Details:
🕯 #BTC/USDT 🔼 Buy | Long 🔼
⌛️ TimeFrame: 1D
--------------------
🛡 Risk Management (Example):
🛡 Based on $10,000 Balance
🛡 Loss-Limit: 1% (Conservative)
🛡 The Signal Margin: $1256.28
--------------------
☄️ En1: 110559.25 (Amount: $125.63)
☄️ En2: 107509.03 (Amount: $439.7)
☄️ En3: 105389.1 (Amount: $565.33)
☄️ En4: 103310.97 (Amount: $125.63)
--------------------
☄️ If All Entries Are Activated, Then:
☄️ Average.En: 106440.29 ($1256.28)
--------------------
☑️ TP1: 118316.05 (+11.16%) (RR:1.4)
☑️ TP2: 124474 (+16.94%) (RR:2.13)
☑️ TP3: 132765.65 (+24.73%) (RR:3.11)
☑️ TP4: 144116.05 (+35.4%) (RR:4.45)
☑️ TP5: 157777.77 (+48.23%) (RR:6.06)
☑️ TP6: Open 🔝
--------------------
❌ SL: 97967.45 (-7.96%) (-$100)
--------------------
💯 Maximum.Lev: 7X
⌛️ Trading Type: Swing Trading
‼️ Signal Risk: 🙂 Low-Risk! 🙂
🔎 Technical Analysis Breakdown:
This technical analysis is based on Price Action, Elliott waves, SMC (Smart Money Concepts), and ICT (Inner Circle Trader) concepts. All entry points, Target Points, and Stop Losses are calculated using professional mathematical formulas. As a result, you can have an optimal trade setup based on great risk management.
📊 Sentiment & Market Context:
Bitcoin (BTC) is showing strong bullish momentum as it consolidates above key support zones, signaling a potential breakout after recent healthy corrections. The broader crypto market is stabilizing, and BTC continues to maintain its dominance, attracting institutional interest and retail confidence alike.
🌍 Fundamentals Remain Strong:
ETF inflows, continued network activity growth, and increasing adoption by global institutions are fueling BTC’s long-term outlook.
With the next halving cycle already on the horizon, historical trends suggest bullish continuation over the medium to long term.
Macro sentiment is also leaning risk-on, with fiat liquidity gradually increasing and global inflation concerns subsiding.
⚠️ Disclaimer:
Trading involves significant risk, and past performance does not guarantee future results. This analysis is for informational purposes only and should not be considered financial advice. Always conduct your research and trade responsibly.
💡 Stay Updated:
Like this technical analysis? Follow me for more in-depth insights, technical setups, and market updates. Let's trade smarter together!

Bitcoin 2017 vs. 2025Bitcoin top not is in.
CRYPTOCAP:BTC as seen in 2017, in the stage before its parabolic rise.

$GOLD ATH $BTC Following By 10 WeeksFor all those celebrating TVC:GOLD 's historic 1% move back to ATH, remember it generally leads CRYPTOCAP:BTC by 10-12 Weeks, just like global liquidity and DXY (inverted).
And remember who shared this with you first 🤓

Bitcoin at Heavy Support – Will Bulls Defend or Break Below?Bitcoin ( BINANCE:BTCUSDT ) fell as I expected in my previous idea .
The question is, can Bitcoin break the Heavy Support zone($111,980-$105,820) ?
Bitcoin is currently trading in the lower areas of the Heavy Support zone($111,980-$105,820) and near the Support lines and Cumulative Long Liquidation Leverage($107,000-$106,330) .
In terms of Elliott Wave theory , it seems that Bitcoin has completed 5 downwaves at the support lines, and we should expect upward corrective waves . The corrective waves could follow the Expanding Flat(ABC/3-3-5) .
Also, we can see the Regular Divergence(RD+) between Consecutive Valleys.
I expect that if Bitcoin is going to break the Heavy Support zone($111,980-$105,820) , it will attack the Resistance zone($110,920-$110,200) and the Resistance lines first. Do you agree with me!?
Cumulative Short Liquidation Leverage: $110,147-$109,266
CME Gap: $117,235-$113,800
Stop Loss(SL): $105,600(Worst)
Please respect each other's ideas and express them politely if you agree or disagree.
Bitcoin Analyze (BTCUSDT), 1-hour time frame.
Be sure to follow the updated ideas.
Do not forget to put a Stop loss for your positions (For every position you want to open).
Please follow your strategy and updates; this is just my Idea, and I will gladly see your ideas in this post.
Please do not forget the ✅' like '✅ button 🙏😊 & Share it with your friends; thanks, and Trade safe.
BITCOIN PREDICTION: WHALES PREPARING HUGE MOVE!!!? (damn)Yello Paradisers! In this video, as professional traders, we have been going through multi-time frame analysis. First, we went through an ultra-high time frame where I shared with you that we are touching an important moving average trend line. Because of that, we understand that a channel retest is possible, but we need to be careful because there is a bearish divergence, and we already got a confirmational bearish cross.
On the high timeframe chart, we have seen that the ABC zigzag is already finished. Right now, we are forming a possible first ultra-high timeframe wave, and from that, we are starting the first motive mode wave. We are seeing bullish divergence, and what I forgot to say is that if we start moving to the upside and creating the secondary high timeframe wave, we will touch the CME futures gap and close it. Which is another confluence.
After that, we have been shifting our focus to the medium timeframe. I've told you that what's important is also what you don't see in the market and we are seeing so far no bearish divergence plus what I have didn't show you but there are also two bullish hammer candlestick patterns candles I have been sharing with you the moving average trend line the Fibonacci time zone and the next resistances finally at low time frame chart we have been going through the ending diagonal.
Paradisers! Keep in mind to trade only with a proper professional trading strategy. Wait for confirmations. Play with tactics. This is the only way you can be long-term profitable.
Remember, don’t trade without confirmations. Wait for them before creating a trade. Be disciplined, patient, and emotionally controlled. Only trade the highest probability setups with the greatest risk to reward ratio. This will ensure that you become a long-term profitable professional trader.
Don't be a gambler. Don't try to get rich quick. Make sure that your trading is professionally based on proper strategies and trade tactics.
I apologize; I accidentally turned off the video in the middle. Unfortunately, TradingView doesn't allow me to continue, so the next video will be here on TradingView on Wednesday. Stay tuned.

BITCOIN vs GOLD - Massive Fall in 2025?My prediction: TVC:XAU (Gold) will OUTPERFORM CRYPTOCAP:BTC (Bitcoin) until December of 2025
Here is why:
1. Technical side. The price failed to break through the 33.5 resistance and is now heading downwards. The right shoulder of the H&S pattern has formed clearly. The TVC:XAU chart is very bullish, breaking resistance one by one. In contrast, the CRYPTOCAP:BTC failed to hold above the $117,000 resistance, resulting in a hard dump that seems to be far from over.
2. Fundamental side. People buy gold during uncertain times, and we are currently on the verge of experiencing such a period. Rate cuts are already priced in, and each FOMC meeting is a "sell the news" event. If only Powell refuses to cut rates or cut it just one - markets, especially SP:SPX , will be heavily affected. When crypto and stocks are falling, people buy gold—it's a simple rule.
I'm not calling for a massive correction in the stock and crypto markets, but holding some gold in your portfolio during the fall of 2025 seems like the right thing to do.
