GOLD - Ascending Triangle into new All Time HighMarket Context
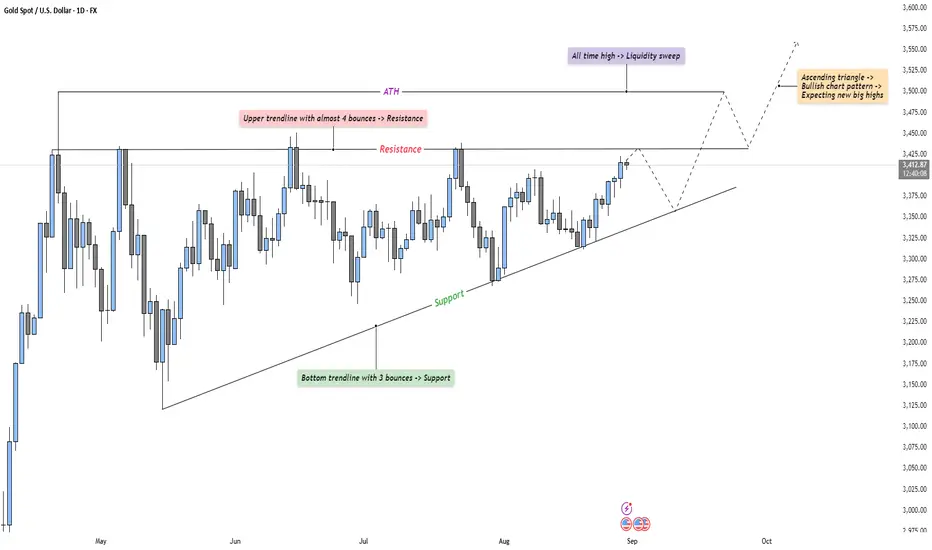
Gold has been steadily climbing, forming an ascending triangle pattern over the past few months. Buyers continue to defend higher lows, while sellers repeatedly reject price near resistance. This type of structure often signals building pressure, with volatility likely to expand once a breakout occurs.
Consolidation Phase
The range between the ascending support trendline and the horizontal resistance has created a textbook consolidation. Each bounce off support shows accumulation, while the repeated touches of resistance highlight where liquidity is building. The longer price compresses within this pattern, the more explosive the eventual breakout is expected to be.
Bullish Breakout Scenario
If price manages to break above resistance and sweep the all-time high, it would likely trigger a wave of liquidity from trapped shorts and breakout buyers entering. This move could fuel momentum into fresh price discovery, validating the ascending triangle as a bullish continuation pattern. The sweep of liquidity above ATH could serve as the catalyst for acceleration toward new highs.
Bearish Retest Scenario
On the other hand, if resistance holds once again, a deeper retracement back toward the ascending trendline is likely. This would test the conviction of buyers and determine whether the trendline support continues to act as the foundation for the structure. A clean break below support would weaken the bullish outlook and signal a potential shift in momentum.
Final Words
Patience here is key — ascending triangles often test traders’ resolve before making their decisive move. Let the market reveal its hand before committing to either direction.
If you found this breakdown helpful, a like would be much appreciated! Drop a comment and let me know: are you expecting the breakout to bring new highs, or do you see sellers defending this level once again?
Btc-bitcoin
MSTR Bottoming Soon?NASDAQ:MSTR continues to range while weekly RSI heads into oversold without a significant pullback, a good sign for a bullish long term outlook.
My downside target for this move remains the High Volume Node, weekly pivot and golden ratio Fibonacci retracement at $290.
The R3 weekly pivot is a solid terminal target at $1039 but could overextend in an irrational environment.
Analysis is invalidated below wave (IV)
Safe trading

BTC/USDT Bitcoin is at a historical turning pointHello to you all,
The Bitcoing is a turning point Daily, Weekly, and Monthly charts. Also, There is a double top pattern.
Thanks for watching I appreciate it.
MarketsTitan

BTC Game Plan BTC Game Plan
📊 Market Sentiment
Overall sentiment remains bullish, supported by expectations of a 0.25% rate cut in the upcoming FOMC meeting. A weakening USD and increasing global risk appetite continue to create favorable conditions for further upside in crypto assets.
📈 Technical Analysis
BTC printed a new all-time high but failed to close above it. Since then, price has been retracing inside the range, likely to collect more liquidity before another potential leg higher.
I will be focusing on discount zones and liquidity lows as potential areas for long opportunities.
📌 Game Plan
My key level is $104,750. A close above this level will confirm bullish intent.
This area aligns with 3 major confluences:
Broken trendline retest
0.75 range zone (deep discount level)
Daily swing liquidity
🎯 Setup Trigger
I will wait for a 4H market structure shift as confirmation before entering a trade.
📋 Trade Management
Stoploss: 4H swing low confirming the BOS
Targets:
• TP1: $113,300
• TP2: $117,110
• Runner: Potential push towards new ATH
💬 Like, follow, and comment if you find this setup valuable!
⚠️ Disclaimer: This content is for informational and educational purposes only and does not constitute financial, investment, or trading advice. Always do your own research before making any financial decisions.

BITCOIN PREDICTION: CRASH WILL STOP HERE!!!? (nobody watching) Yello Paradisers! In this video, I'm sharing with you the ultra-line time frame perspective. We are analyzing the channel and the Elliott Wave Theory on a high time frame chart. I'm sharing with you how the ABC correction is finished. We are going through the Bitcoin CME futures gap or medium time frame. I'm sharing with you the Fibonacci time zone, the Elliott Wave count, and the confirmations we are waiting for to start in your positions.
Paradisers! Keep in mind to trade only with a proper professional trading strategy. Wait for confirmations. Play with tactics. This is the only way you can be long-term profitable.
Remember, don’t trade without confirmations. Wait for them before creating a trade. Be disciplined, patient, and emotionally controlled. Only trade the highest probability setups with the greatest risk to reward ratio. This will ensure that you become a long-term profitable professional trader.
Don't be a gambler. Don't try to get rich quick. Make sure that your trading is professionally based on proper strategies and trade tactics.

Bitcoin is correcting ┆ HolderStatBINANCE:BTCUSDT on the 8h chart is consolidating near 109,000 support. Buyers are watching for a rebound, with resistance levels at 115,000 and 121,000. Holding the support zone is critical for a continuation to new highs.

BTC in Trouble if THIS Support Breaks !Hello BTC Watchers
The previous update on Bitcoin was on how we may expect the altcoin market to play out during the next few weeks. (Find it here):
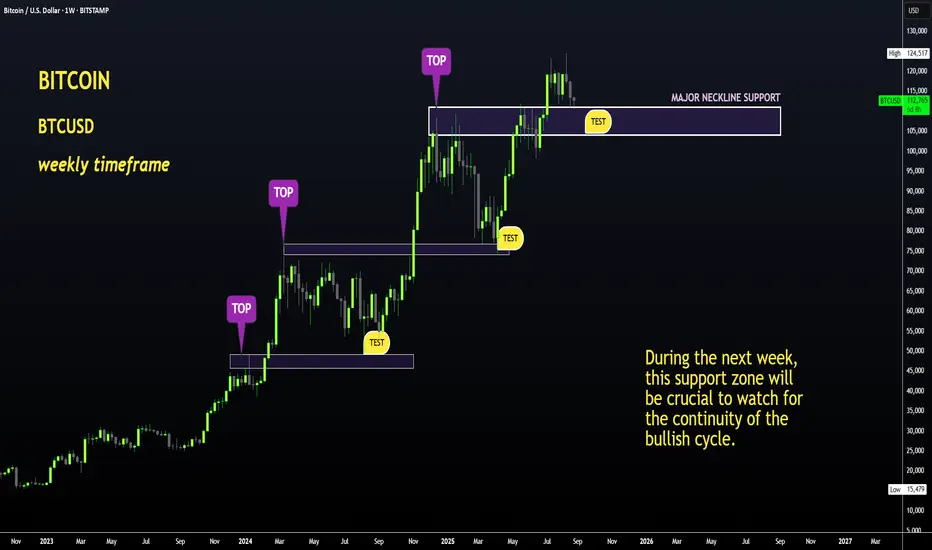
Now, if we look at Bitcoin in the weekly timeframe, the price is trading right on top of a KEY support zone. Here, we can either see a dip - marking the start of the bearish cycle OR the price can maintain this level and perhaps even push towards a higher high. This will all depend on the SUPPORT ZONE, and if the weekly candle will close ABOVE or BELOW this zone.
This would be between these zones:
Interestingly enough, we've extended to a full 2.0 on the Fibonacci retracement level. This will be very helpful in determining major bounce zones during the bearish season:
The next week will be vital! Update to follow at the end on the week on the progress of Bitcoin.
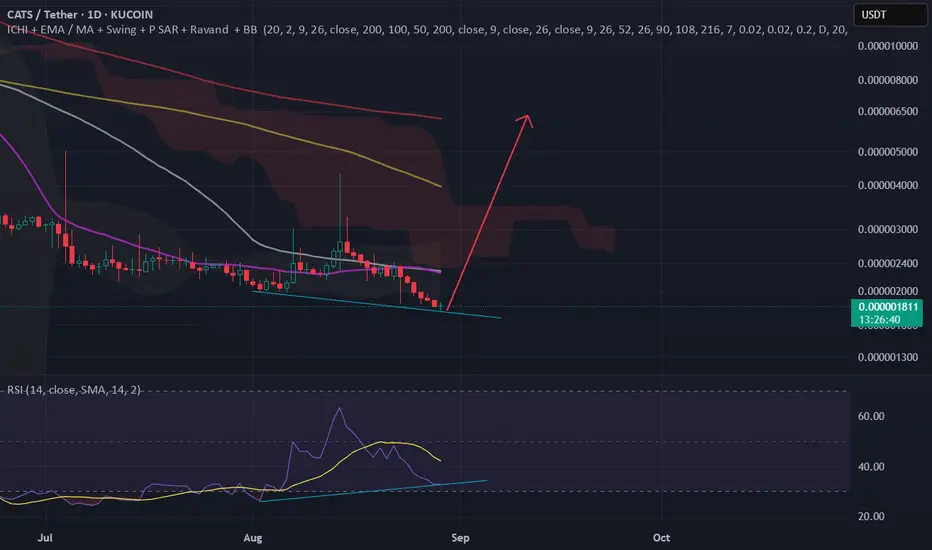
CATSUSDTat technically RSI in daily Chart has Positive Divergence , Break out Excepted , Buy before Explode About to 4x For First
BTCUSD Long: Breakout and Rally to 116500 levelHello, traders! The prior market structure for BTCUSD was a bullish ascending channel, which concluded with a pivot point high near the 118900 supply area. A subsequent breakdown from this channel shifted the market's momentum, initiating a corrective phase that took the form of a descending pennant. This bearish structure guided the price auction down to the major demand area around 112000, where a new pivot point low was established.
Currently, the price is consolidating within the final stages of this descending pennant, coiling between the supply and demand lines. The auction is approaching the apex of the pattern, but before a final resolution, one more test of the lower boundary is anticipated. The immediate expectation is for a final corrective move downwards to test the ascending demand line near the 112000 demand area.
The primary scenario anticipates a bullish resolution following this final test of support. The price is expected to reverse from the demand line, initiating a rally strong enough to break out above the descending supply line. Following the breakout, a brief retest of the broken line as new support would confirm the shift in control to buyers. This successful retest would then be the trigger for a continuation of the rally. The take-profit is therefore set at the 116500 level, targeting a key area of prior market imbalance. Manage your risk!

(BTC) bitcoin "years - boxes - overlap"Essentially, the boxes in the chart gives and easy way to see Bitcoin between years correlated by using colored boxes. Using boxes I overlapped each year based on the following year's performance, working backwards. There are two boxes for each year in different colors and only touching the highest point of each year to see the difference overlapped between years and amount of gains or losses with the price of Bitcoin chart. I do not have a bias towards Bitstamp it is the chart with the longest view of BTC at the time of adding BTC to my watchlist some years ago.

(BTC) bitcoin "balancing act"Lines drawn based on indications in an attempt to foresee the direction of bitcoin. Day chart. Yellow Lines are aligned with variable average patterns. Orange lines are more concretely focused on consistent timeframe measurements. The trading psychology right now is not at its peak. Array pressure on the price is high where May 2025 was the last time BTC was at a low array buying pressure. Similarly, Bollinger Band phase is positive with the last negative being around April to May 2025. Bear power is in control right now. Selling pressure chop chai confirms the bear power indicator. Directional momentum does appear to be being taken over by selling also indicated is the strong average gauge to confirm the strength of selling. MA quad gives an indication the price is losing with the losing line in control over the top of the winning line. Triple descending pyramids appeared last week with the last time multiples of those type appeared happened around the start of February 2025. MACD lines have crossed 0 moving in a downward direction.
The balance of the imaginary weighted scale appears to be shifting to the right as in falling until the balance is level. The price of BTC often follows no logical path or makes any sense. This image is not entirely made up and relies on indicators which are unpublished that I drew over to show what is stated in the post.

BTC 1H Analysis – Key Triggers Ahead | Day 25💀 Hey , how's it going ? Come over here — Satoshi got something for you !
⏰ We’re analyzing BTC on the 1-hour timeframe timeframe .
👀 On the 1H timeframe for Bitcoin, we can observe that BTC is ranging inside a box with a top around $113,000 and a bottom around $109,100. With a breakout from either side of the box, Bitcoin can experience a sharp and parabolic move.
⚙️ The key RSI zones are 70 and 45, and once the oscillation surpasses these levels, Bitcoin can experience a solid move with an increase in trading activity.
🕯 The size and volume of green candles are increasing, the underlying trend of the market is bullish, and we are at an important zone. With rising buying volume and larger green candles, Bitcoin could break out of the top of the box and move upward toward resistance levels.
📊 On the 1H timeframe for USDT.Dominance we can observe that Tether Dominance is slowly losing weight in the market after dropping below the 4.35% zone.
At the same time, Bitcoin.Dominance is also declining . This means that altcoins are providing more profit than Bitcoin .
🔔 The zones we have selected as alert zones are $113,200 and $109,000. By monitoring price behavior and recognizing breakouts, we can open our positions accordingly .
❤️ Disclaimer : This analysis is purely based on my personal opinion and I only trade if the stated triggers are activated .

Bitcoin is forming a higher low ┆ HolderStatBINANCE:BTCUSDT on the 16h chart is consolidating inside an expanding triangle formation. Support at 110,000–112,000 is crucial to hold the higher low structure, while resistance sits at 121,000–122,000. A breakout above resistance could accelerate the move toward 125,000+.

BTC – Fakeout Before the Big Breakout!Bitcoin has been repeating a familiar pattern:
- Fakeouts below key support zones, trapping early sellers.
- Breakouts back above structure, followed by strong impulsive moves.
We’ve already seen this sequence twice in the past months, and BTC might be setting up for it once again. Price faked out below support, reclaimed it, and is now eyeing a breakout from the falling channel.
🔁If history rhymes, the next leg could trigger a powerful impulse toward new highs. Traders should keep an eye on the $112,000–$114,000 zone — a breakout from here could be the spark for the next rally.
Is BTC about to repeat its playbook? 👀
📚 Always follow your trading plan regarding entry, risk management, and trade management.
Good luck!
All Strategies Are Good; If Managed Properly!
~Richard Nasr

bitcoin epic pump...Bitcoin is accumulating strength before an epic pump,
in the truest sense of the word.
The statement that a local peak was seen before entering the Bitcoin euphoria zone is meaningless.
CRYPTOCAP:BTC

Bitcoin | H1 Double Bottom | GTradingMethodHello Traders.
Welcome to today’s trade idea by GTradingMethod.
🧐 Market Overview:
Bitcoin is trending lower while the RSI is forming higher lows, creating positive RSI divergence — a bullish signal. I’ll be watching for the hourly candle to close within range alongside confirmation from other GTradingMethod indicators before entering.
📊 Trade Plan:
Risk/Reward: 3.1
Entry: 109,104
Stop Loss: 108,234
Take Profit 1 (50%): 111,494
Take Profit 2 (50%): 112,453
💡 GTradingMethod Tip:
RSI divergence can often signal a momentum shift before price action confirms the move.
🙏 Thanks for checking out my post!
Make sure to follow me to catch the next idea and share your thoughts — I’d love to hear them.
📌 Please note:
This is not financial advice. This content is to track my trading journey and for educational purposes only.

BITCOIN PREDICTION: ANOTHER MASSIVE LIQUIDATION INCOMING!!?(bad)Yello Paradisers! In this video, we have been going through multi-time frame analysis. Professional trading requires doing analysis on multiple time frames so you can really understand the context of what's going on. On the ultra-long timeframe, I've been sharing with you the Elliott Wave plus the bearish cross, the bearish divergence.
On the high timeframe chart, we have been going through the ABC zigzag, which seems to be finished already, and we are starting the first wave of our ultra-high timeframe impulse.
On the medium time frame, we have been going through the Fibonacci and Elliott Wave count. I have been sharing with you on the RSI, a bullish divergence. We have been going through the sub-waves and where the secondary wave might end.
We didn't have enough time to go through it, but I wanted to show you the CME Futures gap that will probably close on the creation of the secondary wave.
Paradisers! Keep in mind to trade only with a proper professional trading strategy. Wait for confirmations. Play with tactics. This is the only way you can be long-term profitable.
Remember, don’t trade without confirmations. Wait for them before creating a trade. Be disciplined, patient, and emotionally controlled. Only trade the highest probability setups with the greatest risk to reward ratio. This will ensure that you become a long-term profitable professional trader.
Don't be a gambler. Don't try to get rich quick. Make sure that your trading is professionally based on proper strategies and trade tactics.

Bitcoin the top is not in. Bitcoin is still far from its local peak, and it is inevitable that the parabolic run will repeat itself before the local peak.

Bitcoin Outlook: Short-Term Dip, Long-Term $150K TargetCurrently, Bitcoin has entered a medium-term downtrend after breaking below the green kumo on the daily timeframe, as well as losing the support that had previously led to its all-time-high. this decline could extend toward the $103K - $98K range, where a new bullish wave will begin.
When would Bitcoin turn bearish in the long term? Only if the $98K level is lost -- though this scenario is considered unlikely.
The importance of this zone comes from the fact that on the weekly timeframe the pivot low that led to the highest peak sits at $98K. In addition, Wave strength which currently giving mixed signals, would turn fully negative if this level breaks.
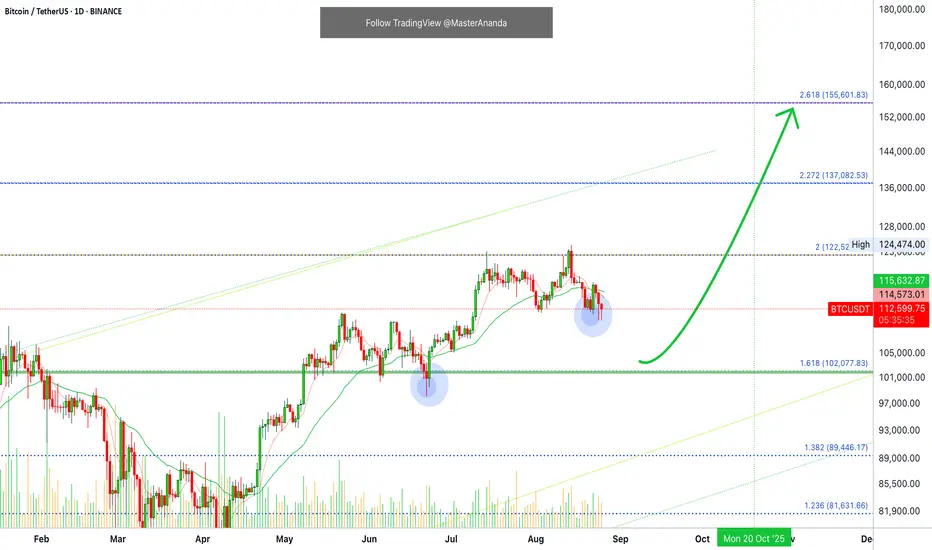
For now, the broader trend remains bullish and Bitcoin is still expected to reach a new all-time-high of $150K or even higher. (Although my colleagues believes the price wont climb beyond $130K)
This analysis is Personal opinion , not financial advice.

BTC Daily - 88KOne more squeeze up and the crypto space will scream BREAKOUT!!! That’s usually where big players sell into retail euphoria. Distribution in plain sight! A bounce fuels hopium - then comes the drop. Eyes on 88K, let's go.

$BTC Has Entered the DANGER ZONEI warned ya’ll about this ₿itcoin correction on the 15th when that big bearish engulfing candle printed.
CRYPTOCAP:BTC has now officially entered the DANGER ZONE with a break below the 100DMA, 0.236 Fib and previous local high territory.
If PA breaks even further, next stop is the 0.382 Fib ~$105k and possibly the 200DMA ~$101k

Flying Bitcoins & Confirmed SupportWould you rather SHORT or go LONG?
It is interesting, I felt the impulse to go call it short at support but I stopped myself. I was thinking, "If I didn't sell at $120,000 or higher why would I sell at $110,000?" And it results that $110,000 is the market bottom.
Instead, I said, "I prefer to go LONG." Sell at resistance, buy at support.
$110,000 is a strong support and the signals coming from the altcoins market are only building up, that is, Bitcoin is bullish because the bullish bias across the market remains intact even with a $15,000 drop on Bitcoin, which means that the demand for Crypto is just too strong.
We know this, we know... We buy and we hold. We continue buying and wait for the retrace to end to go LONG again. But, we will start to SHORT corrections and retraces based on the short-term. A more advanced game.
We continue bullish on Bitcoin because of obvious reasons. The price is what gives it away. If you look at the chart, a very obvious and strong rising trend.
I don't care what the television or the news guy is saying. I don't care how fast or far prices go. If the action is happening above $110,000, I am super bullish and calling for a reversal unless this support level fails. Since $110,000 continues to hold, I continue to say Bitcoin is going up.
If $110,000 breaks, Bitcoin continues bullish long-term above $100,000.
We are going up. We have three days red and still no drop. Low bearish volume and Ethereum looking strong.
Bitcoin is not going down, this is called consolidation before additional growth. Going down is a move or trend, lower highs and lower lows. The only thing low is the size of the drop. Bitcoin is not dropping anywhere near to what it used to do in the past and that's ok. The market continues to evolve, Bitcoin becomes stronger, it becomes more stable; it drops less but also grows slower but it also leans toward growing long-term.
Bitcoin will continue to grow. The bull market is not over. The best is yet to come.
Namaste.
Bitcoin is correcting ┆ HolderStatBINANCE:BTCUSDT on the 4h chart is retracing into the $110,700 support after hitting new ATH levels. Previous triangle and higher low formations show a continuation structure, where pullbacks act as accumulation. If buyers defend $110,000, the market could regain momentum toward $120,000–122,000.
