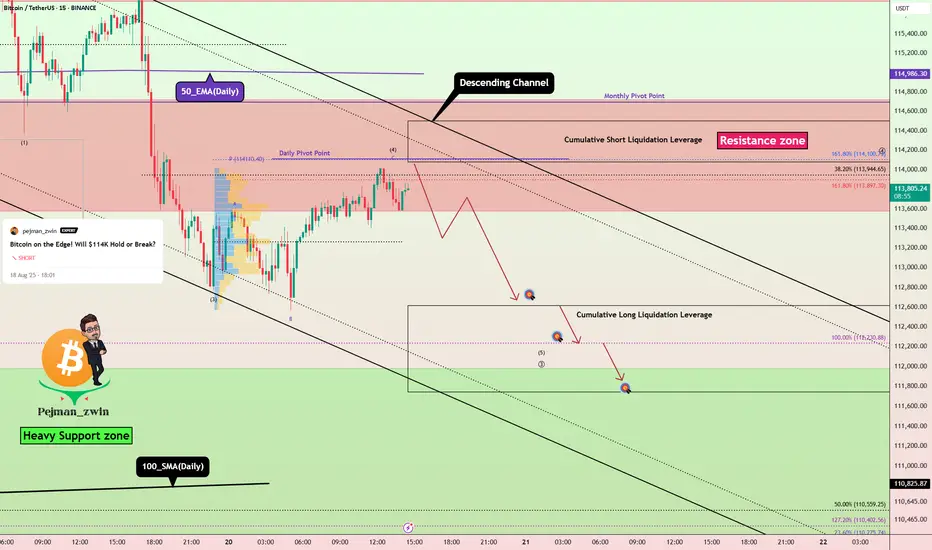
Bitcoin Short Setup _ Short-termBitcoin ( BINANCE:BTCUSDT ) has managed to break the Support zone($114,720-$113,570)/Now=Resistance zone and 50_EMA(Daily) , as I expected in the previous idea . And now it seems that Bitcoin is completing a pullback .
Also, on the 1-hour time frame , if you look closely, Bitcoin seems to be moving inside a descending channel .
In terms of Elliott wave theory , Bitcoin seems to be completing microwave 4 of the main wave 3 , so that microwave 4 could have an Expanding Flat structure(ABC/3-3-5) .
I expect Bitcoin to drop to at least $112,640 after completing the pullback ( microwave 4 of the main wave 3 ).
Second Target: $112,323
Cumulative Short Liquidation Leverage: $116,755-$115,778
Cumulative Short Liquidation Leverage: $114,500-$114,077
Cumulative Long Liquidation Leverage: $112,615-$111,743
Note: From today until Friday, important indexes will be released from the US, which can create excitement in financial markets, especially crypto, and even change the market trend when released.
Note: Most likely, after Bitcoin touches the Heavy Support zone($111,980-$105,820) and 100_SMA(Daily), we should wait for Bitcoin to bounce back (you might be able to look for a long position trigger in that zone).
Note: Stop Loss(SL): $114,823
Please respect each other's ideas and express them politely if you agree or disagree.
Bitcoin Analyze (BTCUSDT), 15-minute time frame.
Be sure to follow the updated ideas.
Do not forget to put a Stop loss for your positions (For every position you want to open).
Please follow your strategy and updates; this is just my Idea, and I will gladly see your ideas in this post.
Please do not forget the ✅' like '✅ button 🙏😊 & Share it with your friends; thanks, and Trade safe.
Btc-bitcoin
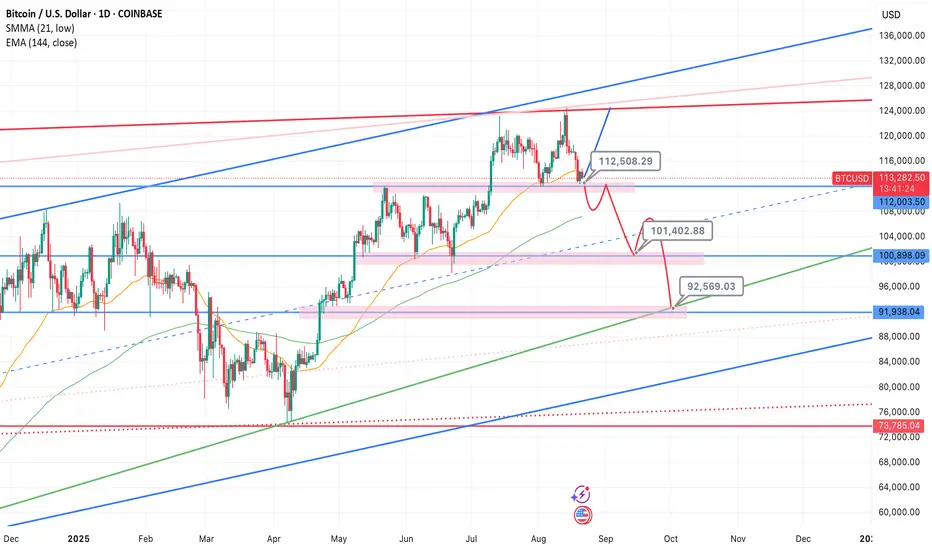
Bitcoin Holds the Line – $112.2K Is Key SupportAccording to on-chain data, BTC’s move to $125K was driven by short liquidations, not new capital inflow, therefore a rejection of highs into further consolidation was expected, after confirming by technical analysis reversal pattern. When rallies aren’t backed by real inflows, the downside tends to be ruthless. After rally printed a new all-time high, then tactical traders triggered a chain of long liquidations.
So the question now is—was this just a flush before a fresh leg up? Or is this market still unwinding?
I remain bullish from current levels. The recent drop looks more like a healthy correction than a trend reversal.
Key Risk:
The bullish scenario breaks if $112,200 support fails and we see a confirmed reversal structure (not just one wick/ short-term candle, but several days of follow-through).
Support Levels to Watch (Buy-the-Dip Zones):
$112,500
$101,400
$92,600
Macro View:
Liquidity signals continue to improve, profit-taking is largely complete, and we don’t see a cycle top yet. Long-term structure remains bullish, and this pullback should be seen as an accumulation opportunity.
Disclaimer:
Markets are subject to unpredictable events and the randomness of markets, please use appropriate risk management. DYOR
Bitcoin (BTCUSD) | Key Support Retest💎 MJTrading
📸 Viewing Tip:
🛠️ Some layout elements may shift depending on your screen size.
🔗 View the fixed high-resolution chart here:
BINANCE:BTCUSD is retesting a key support zone at 110,000 – 113,000 within its uptrend channel.
👉 As long as support holds, bias remains bullish continuation and could send price toward 117k → 120k → ATH 123,700.
Failure to hold the 112k zone could shift momentum back to sellers, invalidating the higher-low structure.
======================
📝 Trade Setup:
🟢 Entry Zone: 112,000 – 114,000 (support retest / bounce confirmation)
❌ Stop Loss (SL): Below 110,000 (structure invalidation)
🎯 Take Profit (TP) Levels
✅ TP1 → 117,000 (near-term resistance)
📈 TP2 → 120,000 (round level / next resistance)
💰 TP3 → 123,700 (all-time high retest)
======================
#BTC #Bitcoin #Crypto #PriceAction #TechnicalAnalysis #Trading #MJTrading
Psychology Always Matters:

SUI Game Plan - AltcoinSUI Game Plan - Altcoin
📊 Market Sentiment
Overall sentiment remains bullish, supported by expectations of a 0.25% rate cut in the upcoming FOMC meeting. A weakening USD and increasing global risk appetite are creating favorable conditions for further upside in crypto assets.
📈 Technical Analysis
Price was rejected from the broken HTF bullish trendline.
It retraced back to the daily swing demand zone to gather more liquidity.
Price is currently trading below the 0.5 Fibonacci equilibrium level, which I consider a discount zone.
📌 Game Plan
I expect a deeper retracement towards the 4H swing liquidity at $3.45.
Additionally, the 0.75 Fibonacci max discount level aligns with this 4H swing liquidity. Running that liquidity would likely trigger a strong bounce.
🎯 Setup Trigger
I’ll be watching for a 4H break of structure (BOS) to initiate entries.
📋 Trade Management
Stoploss: 4H–1H swing low confirming the BOS
Targets:
TP1: $3.90
TP2: $4.18
TP3: $4.44
💬 Like, follow, and comment if you find this setup valuable!
⚠️ Disclaimer: This content is for informational and educational purposes only and does not constitute financial, investment, or trading advice. Always do your own research before making any financial decisions.

BTCUSDT 1H🔎 Chart Context
• Pair: BTC/USDT
• Exchange: Binance
• Timeframe: 1H (intraday)
• Date: 20 August 2025
• Current price: ~113,578
The chart uses Fair Value Gaps (FVG), Change of Character (CH), Supply/Demand blocks, and liquidity sweeps to track short-term moves.
📊 Key Observations
1. Overall Structure
• BTC is in a clear short-term downtrend on the 1H timeframe.
• Price broke down from 116,500–117,000 supply block, confirming a bearish CH 1H.
• Since then, the structure has been forming lower highs and lower lows.
2. Fair Value Gap (FVG)
• An FVG is marked near ~115,500–115,800.
• Price is currently trading well below this zone.
• Typically, market tends to retrace into FVG zones before resuming the main direction (here: bearish).
3. Liquidity Levels
• Above: Liquidity around 115,000–115,800 (FVG) → potential pullback target.
• Below: Liquidity pools near 112,000–111,000 demand block.
• A deeper liquidity sweep could reach 110,500–111,000, marked as the downside magnet.
4. Support & Demand Zones
• 113,000–112,000: Nearest minor support.
• 111,000–110,500: Major demand block, strong liquidity resting here.
5. Resistance & Supply Zones
• 115,000–115,800 FVG zone: Key intraday supply area.
• 116,500–117,000: Higher timeframe supply where the breakdown started.
📈 Bullish Scenario (Countertrend Relief Rally)
• If BTC defends 113,000 support, expect a bounce into 115,000–115,800 FVG.
• This would be a retracement move, not a trend reversal.
• Path: 113,000 → 115,000–115,800 → rejection.
• Only a clean reclaim of 117,000 CH zone would flip short-term bias bullish again.
📉 Bearish Scenario (Higher Probability)
• Trend is already bearish, so the likely path is:
1. Short retracement into 115,000–115,800 FVG.
2. Continuation lower toward 112,000.
3. Final sweep into 111,000–110,500 demand zone (major liquidity target).
• This scenario is also drawn on your chart with the projected arrow.
⚡ Trading Plan
• Short Setup (Preferred):
• Entry: 115,000–115,800 FVG zone.
• TP1: 113,000
• TP2: 112,000
• TP3: 111,000–110,500 demand
• Stop: Above 117,000 (CH invalidation).
• Long Setup (Risky, Countertrend):
• Entry: 111,000–110,500 demand zone.
• TP1: 113,000
• TP2: 115,000 FVG
• Stop: Below 110,000

BITCOIN PREDICTION: HERE IS WHERE THE CRASH WILL STOP!!! (deep) Yello Paradisers! In this video, I'm sharing with you an Ultra High Time Frame: the double-top shooting star candlestick pattern formation plus bearish divergence, plus that we are trying to break below our channel.
On a high timeframe chart, I'm sharing with you the ABC zigzag, explaining that right now we are in the C wave, which is a motive mode wave. That means five waves to the upside, and with the highest probability, right now we are in the secondary wave that on its primary waves is creating a zigzag formation.
The 0.786 Fibonacci retracement level needs to hold, and the channel can't be reclaimed. I'm sharing with you the kind of confirmations for both short and long positions we are waiting for with the ParadiseTeam.
On a medium timeframe, we are seeing the first bullish signs and a bullish divergence, where we need to wait for confirmations before taking action. We are also looking at the Fibonacci support that is supporting the finishing of Wave 2.
On the low timeframe chart, we are analyzing the higher degree secondary wave, which is a zigzag. A and C waves are motive mode waves, so we are waiting for the completion of the five-moonstone downside inside of the C wave. This might perfectly confluence with the 0.618 Fibonacci's extension of Wave A, which is usually where the C Wave ends.
Paradisers! Keep in mind to trade only with a proper professional trading strategy. Wait for confirmations. Play with tactics. This is the only way you can be long-term profitable.
Remember, don’t trade without confirmations. Wait for them before creating a trade. Be disciplined, patient, and emotionally controlled. Only trade the highest probability setups with the greatest risk to reward ratio. This will ensure that you become a long-term profitable professional trader.
Don't be a gambler. Don't try to get rich quick. Make sure that your trading is professionally based on proper strategies and trade tactics.

BITCOIN PREDICTION: BIGGER CRASH INCOMING!?? (warning) Yello Paradisers! In today's video, I'm revealing the truth to you. I'm sharing the Ultrahigh timeframe chart, which includes the shooting star double top formation, plus bearish divergence and the channel. And I'm revealing the Elliot wave theory on the Ultrahigh timeframe.
On the high timeframe chart, I'm revealing to you the ABC zigzag and the possibility that we have already concluded the five moves to the upside. I'm sharing with you the bearish divergence and the confirmation that is needed, and what needs to happen for us to go down to $108,000.
On a medium timeframe, we are seeing the triangle reclaim on low volume, but we are also checking the bullish divergence where we are waiting for confirmation. If the Elliott Wave breaks below $112,000, we will go lower toward $108,000. Then, the structure from an Elliott Wave perspective is going to turn bearish, and we will be treating the market as bearish and looking for short opportunities. But if you are able to reclaim it, we are looking for buying opportunities if you are able to defend the low. I'm sharing with you what kind of confirmations I'm waiting for so you can tactically also approach the market.
On the low timeframe chart, we are concluding the wave structure and waiting for its next move.
Paradisers! Keep in mind to trade only with a proper professional trading strategy. Wait for confirmations. Play with tactics. This is the only way you can be long-term profitable.
Remember, don’t trade without confirmations. Wait for them before creating a trade. Be disciplined, patient, and emotionally controlled. Only trade the highest probability setups with the greatest risk to reward ratio. This will ensure that you become a long-term profitable professional trader.
Don't be a gambler. Don't try to get rich quick. Make sure that your trading is professionally based on proper strategies and trade tactics.

Bitcoin reached the support line ┆ HolderStatBINANCE:BTCUSDT reached a new ATH and is now consolidating with a retest of $112,500 support. As long as this level holds, a rebound toward $121,600 and higher remains likely. Breakdown risks correction to $108,000.
NASDAQ (CASH100) – Buy the Dip or Trend ReversalThe Cash100 has been trending in an upward channel since May 2025.
Today, price has broken through diagonal support.
For confirmation that the upward channel is over, I will be looking for these signals:
✅ First signal: a 4H close below diagonal support.
✅ Second signal: a retest of the diagonal. If price fails to reclaim,
I’ll start looking for short setups if both signals above confirm.
What do you think — is the uptrend finally breaking, or will buyers step back in? 👀
Thanks for checking out my post! Make sure to follow me to catch the next update. If you found this helpful, give it a like 👍 and share your thoughts 💬 — I’d love to hear what you think!
Please note: This is not financial advice. This content is to track my trading journey and for educational purposes only.

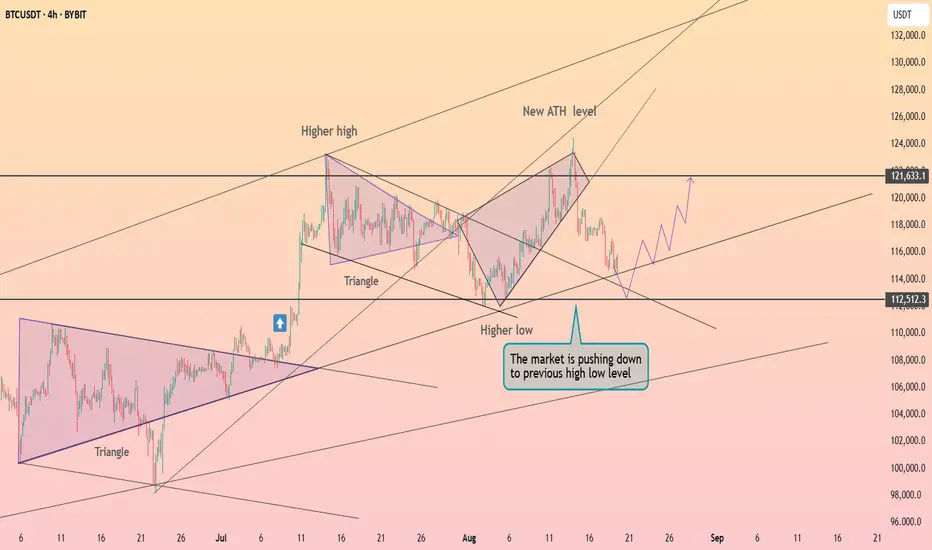
Bitcoin will bounce up from wedge to 117K pointsHello traders, I want share with you my opinion about Bitcoin. The recent price action for Bitcoin has been complex, marked by a significant breakout from a prior downward channel that failed to produce a sustained trend, leading instead to the current corrective structure. This new market phase has taken the form of a large downward wedge, a pattern of contracting volatility that often resolves to the upside. The price has been making a series of lower highs and lower lows within this wedge, with the major buyer zone around the 113000 support level acting as a foundational floor. Currently, the price is in the final stages of this consolidation, making another descent towards the apex of the wedge. The primary working hypothesis is a long scenario, based on a potential 'fake breakdown' or liquidity grab below the established support. It is anticipated that the price may briefly dip below the 113000 support level to trap sellers before staging a sharp reversal. A swift reclaim of this level would be the ultimate confirmation of the bullish thesis, validating the wedge as an accumulation pattern and likely triggering a powerful breakout to the upside. Therefore, the TP for this reversal scenario is logically set at 117000 points. Please share this idea with your friends and click Boost 🚀
Disclaimer: As part of ThinkMarkets’ Influencer Program, I am sponsored to share and publish their charts in my analysis.

Bitcoin Short Setup & Long-Term Buy ZonesMy next BTC trade: short from 114,910 with a target of 111,375.8 and stop at 115,902.6.
Setup comes from the 4H order block above FVG in NY session. Expect a pullback here, then a possible next leg up toward 140K.
Also a great SPOT buy level after the short.
Key supports to watch:
110,000–109,000 (critical to hold)
Below that: 99,000–103,000
Final long-term support: 88,000–89,000.
⚠️ This is not financial advice — only my next BTC trade plan.

Bitcoin has not yet reached its local peakBitcoin has not yet reached its local peak and still has considerable room for growth.
CRYPTOCAP:BTC
BITCOIN 2020 fractal gives huge buy signal now.Bitcoin (BTCUSD) broke below its 1D MA50 (blue trend-line) emphatically for the first time in 2 months, sounding short-term fear alarms ahead of the key macroeconomic news of this week. The 1D RSI hit 40.00 however, which has been an automatic buy on both major recent lows (August 01 and June 21).
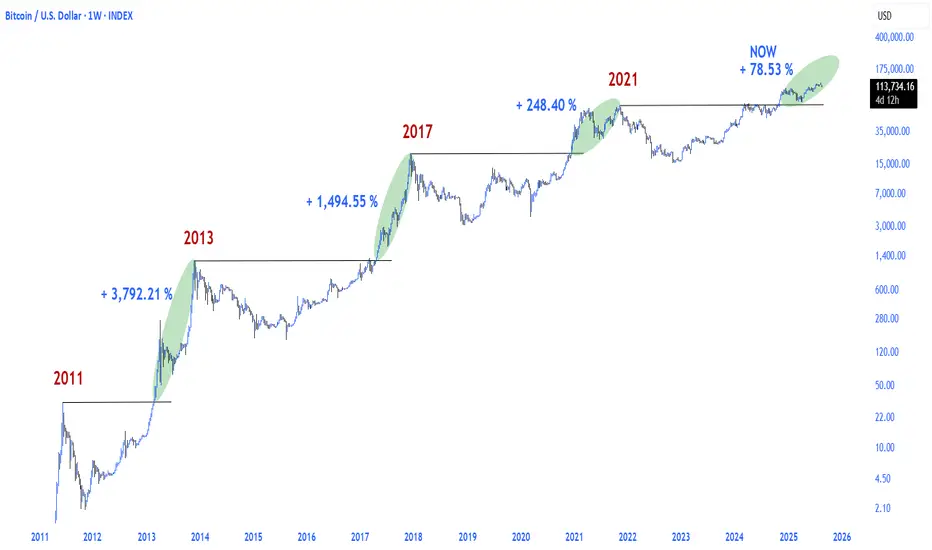
Short-term aside, it is a fractal from BTC's last Cycle in 2020 (chart on the right) that perhaps offers the most comprehensive long-term outlook, which is what has always helped us maintain an objective, stress-free perspective.
As you can see, both today and 2020 fractals display not only similar price actions but also RSI sequences. Even though naturally the 2020 rebound on the Pivot trend-line has been way more aggressive as the market was still recovering and adjusting the price from the COVID crash, today's price action display's similar phases but in a more sustainable rise.
Based on the RSI fractals, we could be in similar phase as early December 2020. This suggests that there is still upside potential that may extend to as high as 150 - 170k before this Cycle is over.
Do you think that this is a solid Profit Zone for the Cycle? Feel free to let us know in the comments section below!
-------------------------------------------------------------------------------
** Please LIKE 👍, FOLLOW ✅, SHARE 🙌 and COMMENT ✍ if you enjoy this idea! Also share your ideas and charts in the comments section below! This is best way to keep it relevant, support us, keep the content here free and allow the idea to reach as many people as possible. **
-------------------------------------------------------------------------------
💸💸💸💸💸💸
👇 👇 👇 👇 👇 👇

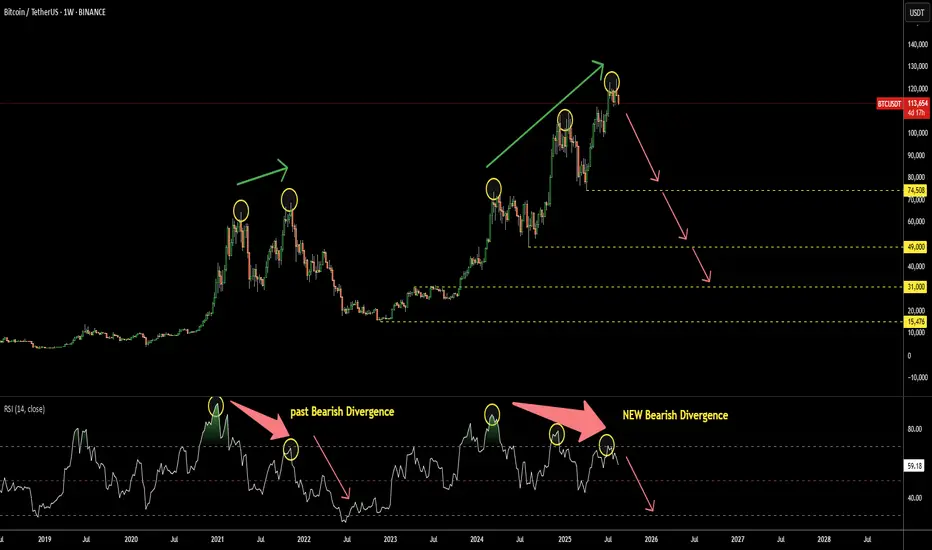
Bitcoin: This Simple Indicator Predicts Crash AheadThe Relative Strength Index (RSI) is a simple yet effective indicator, especially when it doesn't follow the market. This situation is called Divergence.
It has recently appeared on the Bitcoin chart as Bearish Divergence. This occurs when the market price makes a new peak, but the RSI, on the contrary, forms lower highs.
Looking back at the same chart, we can rewind to 2021, where a similar Bearish Divergence played out, pushing Bitcoin’s price down heavily from $69k to $15k.
This time, the Bearish Divergence on RSI is more pronounced, as it consists of 3 ascending peaks on the price chart, contrasted with 3 falling tops on the RSI sub-chart.
There are 4 key supports that could underpin the anticipated crash:
1) $74.5k - This year’s bottom
2) $49k - Consolidation low in 2024
3) $31k - Consolidation top in 2023
4) $15.5k - 2022 minimum
Where do you think the crash will stop?
BTC 4HBullish movement imminent, looking for the liquidity zone at $120,400. 🖤😎
Bullish divergence in formation

BTC 1H Analysis – Key Triggers Ahead | Day 16💀 Hey , how's it going ? Come over here — Satoshi got something for you !
⏰ We’re analyzing BTC on the 1-hour timeframe timeframe .
👀 On the 1-hour timeframe for Bitcoin, we can see that after losing the $115,000 support zone, Bitcoin is moving toward lower price levels. With increasing selling pressure, a deeper correction is likely.
⚙️ Our key RSI level is 33. If this level breaks down, short positions will gain more momentum, and the probability of entering the oversold zone will increase.
🕯 Candlestick behavior shows that bearish/red candles are larger in size and volume, initiating each corrective wave strongly. In contrast, bullish candles are smaller in size, higher in number, and have less volume, which reflects the strong dominance of sellers.
💵 USDT dominance (1-hour timeframe) has successfully broken above 4.37%. The next resistance lies at 4.50%. If this level is also broken, it will likely trigger even more selling pressure on Bitcoin.
🔔 Alarm Zone : There is no specific alarm zone right now, but by watching for pullbacks and breakouts in either direction, we can determine when to open new positions.
❤️ Disclaimer : This analysis is purely based on my personal opinion and I only trade if the stated triggers are activated .

Bitcoin road to + $200kBitcoin is rising within the channel, with the next local peak expected to be +$200k.
For the cycle peak, each individual sets a target based on their own work. Some aim for 400k, some for 175k, and some for 275k. Therefore, I always respect the ideas put forward by each individual. There should be different ideas in the financial markets so that market dynamics can find their direction. My personal goal is a local peak around 200k. I might be wrong, but my current plan is in this direction starting from 16k.

▒₿▒ BITCOIN FORECAST | 6HR ▒₿▒COINBASE:BTCUSD
[ [ ]]
In my last analysis on July 25th, I laid out a bullish forecast targeting the $150K level, based on a fractal pattern that had been tracking well. However, the market has reached a critical divergent point. The recent price action, particularly the confirmation of major weekly bearish signals, requires us to reassess and adapt. As of today, the bullish case has been invalidated, and the inverse bearish fractal is now the primary scenario.
What Changed? The Confluence of Bearish Signals
Several major warning signs have now been confirmed, forcing this change in outlook:
The Double Shooting Stars: As noted on August 14th, two powerful Shooting Star candles appeared on the weekly chart. This was the first major indicator of a potential top. We needed a strong weekly close to invalidate this pattern, and we got the opposite.
Break of Major Trend Support: The price has now broken a major ascending trendline on the daily chart, a clear signal that sellers have taken control of the short-to-medium term trend.
The Fractal Inversion: The price action began to diverge from our bullish fractal and started to perfectly mirror an inverted, bearish version of the same pattern.
The New Forecast: Following the Bearish Fractal
The image above shows the original bullish fractal (in teal) and the now-active inverted fractal (in pink). The breakdown of the daily trendline was the trigger, and this fractal now provides a potential roadmap for the correction that is underway.
This isn't just a pattern; it's a visual representation of the path of least resistance, which is now clearly to the downside.
Key Levels to Watch
This fractal path aligns perfectly with the key technical levels we must now watch. These are the battlegrounds that will define this correction:
Established Resistance: ~$124,000. This is now the confirmed peak. The bears are in full control as long as we remain below this level.
Initial Warning Sign (Triggered): A close below $111,000. We have already breached this level, confirming the initial phase of the downtrend. The likelihood of this being a simple correction, rather than the start of a bear market, drops significantly with every day we spend below it.
Full Bear Market Confirmation: A decisive weekly close below $104,000. This remains the most critical level. According to the analysis, if we break below the $104k-$100k zone, there is an
80% likelihood that we are in a Bear Market and that the ~$124k high was the final top for this bull run.
Conclusion
The bullish forecast has been invalidated by a confluence of powerful, high-timeframe bearish signals. The market is now following a bearish inverted fractal, which aligns with our key technical levels.
The primary expectation is that this correction will continue, with the $104,000 support zone being the next logical destination. Stay safe and manage your risk accordingly.
This is not financial advice (NFA). This is for educational purposes only. Always do your own research (DYOR).
DISCLAIMER
I AM NOT A FINACIAL ADVISOR, NOR AM I YOURS. THIS IS NOT FINANCIAL ADVICE. MEARLY DOODLINGS ON A MATHMATICALLY DRIVEN GRAPHICAL INTERFACE, TRACKING AN INVISIBLE 256BIT MILITARY-GRADE ENCRYPTED ASSET. . . FOR ENTERTAINMENT/AMUSEMENT PUROSES ONLY. ENJOY!

BTC levels for August 2025Simple channel on BINANCE:BTCUSDT.P
retest of equilibrium with main liquidations of 20x - 40x leverages around 113600
this weekend or if we will see some bad macro news drop by end of 12-15 august
109900
keep charts simple

BTC 1DBitcoin is at the bottom of the range at the $115,500 , keep an eye on the $113,800 and $12,000 zones.

Bitcoin is correcting ┆ HolderStatKUCOIN:BTCUSDT on the 6h chart defended the 114,000 support with a double bottom, signaling bullish momentum. Consolidation patterns remain intact, with targets set at 120,000–124,000 if support continues to hold.

BTC 1H Analysis – Key Triggers Ahead | Day 15💀 Hey , how's it going ? Come over here — Satoshi got something for you !
⏰ We’re analyzing BTC on the 4-hour timeframe timeframe .
👀 On the 4H timeframe of Bitcoin, we can see that after breaking the $117,000 zone, Bitcoin faced strong selling pressure, which aligned with the Tokyo session open.
⚙️ The key RSI level is at 26. If this level is lost, Bitcoin could face even stronger selling pressure. The current RSI is around 30, which is marking a boundary for short-trade volatility.
🕯 Both trading volume and sell orders are increasing. With stronger selling pressure, Bitcoin could see a deeper correction.
💵 USDT dominance is getting heavier and forming green candles. However, the dominance is showing weakness in its upward trend. With strong support from USDT buyers, it could trigger a deeper correction across the broader market.
🔔 It’s better not to set alert zones yet, as Bitcoin is currently in a decision-making area, building a new structure. Once this new structure forms, our alert zones will become clearer.
❤️ Disclaimer : This analysis is purely based on my personal opinion and I only trade if the stated triggers are activated .

BTC 1H Analysis – Key Triggers Ahead | Day 14💀 Hey , how's it going ? Come over here — Satoshi got something for you !
⏰ We’re analyzing BTC on the 1-hour timeframe timeframe , we can see that Bitcoin is building a range above the $117,000 support level while trading with reduced volume.
👀 After breaking through the $118,000 zone (which acted as the midline of the range), Bitcoin has formed a consolidation just above $117,000. At the moment, it is ranging with a slight upward bias in the short term.
🕯 Trading volume and the number of transactions have decreased due to the weekend/holidays.
⚙️ On the RSI, the key resistance zone is 65.63. A breakout above this level could increase the probability of moving into overbought territory. On the other hand, losing the support zone around 37.82 could trigger selling pressure and push RSI into oversold territory.
🔔 Our alarm zones are set at $119,000 and $117,000. Breaking either of these levels could provide a trading signal. Monitoring price action around these zones will give clearer entries.
💵 Looking at USDT.D , we can see a 1-hour box range structure. It recently broke down from the bottom of the box. Now, the question is whether this decline will continue or if it will return inside the range.
🖥 Summary: Bitcoin is currently consolidating in a range with a slightly upward slope. However, due to the weekend, trading volume has dropped significantly, so any breakout needs confirmation with stronger liquidity.
❤️ Disclaimer : This analysis is purely based on my personal opinion and I only trade if the stated triggers are activated .
