BTCUSDT.P - November 11, 2025BTCUSDT.P is showing potential for a short-term bearish continuation after breaking below the ascending trendline support near $105,300. The pair has lost upward momentum, indicating potential downside movement toward the $103,530 partial profit zone and the $102,039 profit level. A stop level is positioned around $107,473–$107,714, marking the invalidation area for this bearish setup.
Risk Assessment: Moderate — The breakdown from trendline support favors further downside, but a sustained recovery above $105,600–$106,000 could signal a failed breakdown and shift sentiment back toward bullish consolidation.
Btc-bitcoin

BTCUSDT.P - November 12, 2025BTCUSDT.P is showing potential for a short-term bullish reversal after rebounding from the $102,400 support zone. The pair broke above the minor descending trendline resistance, suggesting that buying momentum may be building. If sustained, price action could target the $105,464 partial profit zone and the $106,844 extension level. A stop level is positioned around $101,376–$101,200, marking the invalidation area for this bullish setup.
Risk Assessment: Moderate to High — While the breakout above local resistance supports a potential short-term recovery, the pair remains within a broader corrective structure. A rejection below $103,000 would weaken the bullish outlook and could lead to a retest of $102,400 or lower.

$BTC bounce before further selloffAs you can see from the chart, BTC formed a falling wedge and looks set to breakout to the upside from it.
I've marked off areas of resistance, but I think if we do get a breakout, the areas you'll want to take profit are $117k and $121-122k as the most likely areas for price to reject.
I think at those levels, you'll want to derisk or set stop losses, because I think it's likely that we can fall a lot further.
The trigger to go short would be losing the diagonal trend line that goes all the way back to October 2023 when the start of the bullish move happened. A move below that trend line should indicate the bullish move is finished and I think that we could potentially move down to the $60k-72k support levels.
I've marked off a lower resistance at $30k, just incase we see an extreme move in the worst case scenario.
Let's see how it pans out over the coming months.

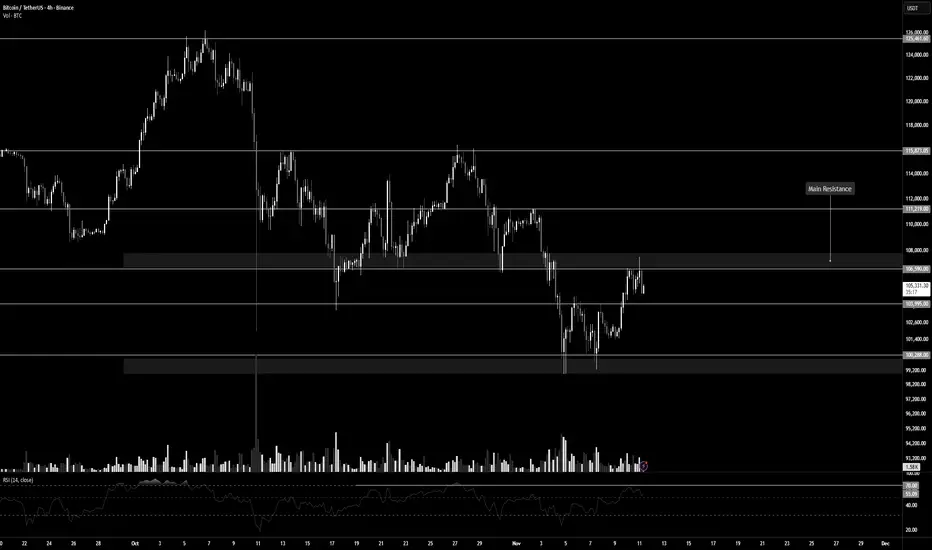
Bitcoin and a Critical Resistance for a Price Breakout | Day 3👋🏻 Hey everyone! Hope you’re doing great! Welcome to the SatoshiFrame channel.
✨ Today we’re diving into the 4-Hour Bitcoin analysis — stay tuned and follow along!
🪙 Bitcoin, in its 4-hour timeframe (as mentioned in previous analyses), is currently sitting below a major resistance level. A breakout above this area could trigger a strong bullish leg, potentially driving price toward forming a new ATH. The key resistance zone is around $106,590, and breaking it could lead to some beautiful market moves.
📊 The buying volume at this resistance is not yet sufficient. If we look closely, since the last touch of the maker-buyer zone at the lower part of the chart, volume has been declining. To break through this resistance, whale candles are needed to absorb all sell orders in the zone — this could lead to a short squeeze.
🧮 The RSI oscillator on the 4-hour timeframe has fluctuated several times below the 70 level, showing two rejections near that area. The 70 RSI level aligns with the $106,590 price resistance, and crossing above it could trigger a strong upward move.
✍️ You can read the possible scenarios for Bitcoin in the rest of the analysis, but since Bitcoin has shown reduced buying volume, it’s best to lower your risk exposure. If the breakout happens, you can reallocate remaining risk toward the next resistance levels.
✅ Long Position Scenario:
A confirmed breakout above $106,590, along with increased buying volume and the RSI surpassing 70, could form a solid long setup on the 4-hour timeframe. Make sure to gather proper confirmations before entering to ensure the best possible trade setup.
❤️ Disclaimer: This analysis is purely based on my personal opinion, and I only take trades when the stated triggers are activated.
BTCUSDT.P - November 11, 2025BTCUSDT.P is showing potential for a short-term bullish reversal after rebounding from the $100,238–$100,616 support zone. A buy limit is positioned near $100,983, targeting a move toward the $112,833 partial profit zone and the $121,599 profit level. A confirmed breakdown below the $94,111–$98,115 stop zone would invalidate this bullish setup and indicate renewed downside momentum.
Risk Assessment: Moderate — Price action suggests early bullish recovery signs, but confirmation depends on holding above $100,900 and sustaining momentum past $112,800.

10/11/25 Weekly OutlookLast weeks high: $110,732.65
Last weeks low: $98,972.09
Midpoint: $104,852.37
Bitcoins price action of last week tells an interesting story. The first trading hour of the week marked the weekly high, a sharp decline towards HTF support at $99,000 marked the weekly bottom, to finish the week a late surge recovered some of the losses to end the week at the range midpoint.
The double bottom at range low is a good sign for the bulls in a must win contested area around the $100,000 mark, not only is it a big even level but a HTF key S/R level too. Should the bulls lose this weekly low it opens the door to a $92,000 retest.
For the bulls should this rebound persist a flip of $108,000 is key but there is certainly a lack of spark in the markets at the moment.
I don't see the bulls making any significant ground until the US Government shutdown is announced to be coming to an end. This announcement could happen at any time and so this week that's what I am making plans for, how will the market react, volatility on announcement etc...
Good luck this week everybody!

BTC AnalysisAfter breaking out its uptrend line, Bitcoin is completing the pullback to its trend line, while with the formation of an increasing angle pattern in the same direction with the main trend, we are witnessing fatigue in the trend. There is a possibility that the price will drop to the range of 41 to 43 thousand dollars.

BTCUSDT.P - November 10, 2025BTCUSDT.P is currently consolidating near the $106,300 area, showing potential for a short-term bearish retracement. A rejection from this zone could trigger a move lower toward the $105,440 support and the $104,300 profit level (short). However, a decisive breakout and close above $106,660 would invalidate the short setup and open the path for a continuation higher toward the $108,280 profit level (long).

BTC to pump againif BTC can break above the resistance at 108k and the falling wedge then pump should be fast

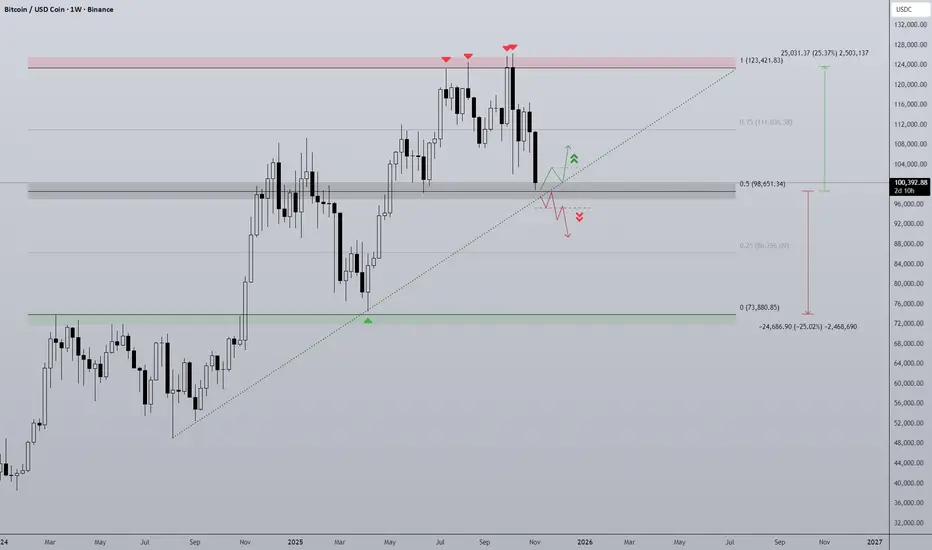
We are NOT finished.Weekly close has come in and, as expected, BTC has closed above the band once again.
Since the start of this cycle, Bitcoin has had the following pullbacks:
September 2023: 21%
August 2024: 34%
April 2025: 33%
November 2025: 21%
Tell me, people—what has changed? Has Bitcoin done anything different from what it’s been doing all cycle?
NO!
Yet 95% of sentiment is extremely bearish. The other 5% who aren’t bearish are patting themselves on the back because they “called the top”—you know, the same “top” everyone is staring at, the same top that can be calculated using basic math from the last two cycles.
Since I joined this space, I have NEVER seen sentiment this bad after only a 20% pullback. Complete madness. The only time I saw emotion this raw was during the COVID crash.
This level of bearish sentiment is what you find at the BOTTOM of rallies, not the top.
The idea that the top is in just because of “cycle length” is invalid—especially when EVERYONE is thinking the exact same thing. It’s never that easy with Bitcoin.
Mark my words: it WILL rally above 200k in 2026, and everyone who sold this year will be buying back in higher. That’s the nature of these markets.
Every cycle, you have to stay grounded, stick to the technical data, and ignore all the noise.
The technical are still holding strong—we are NOT finished!

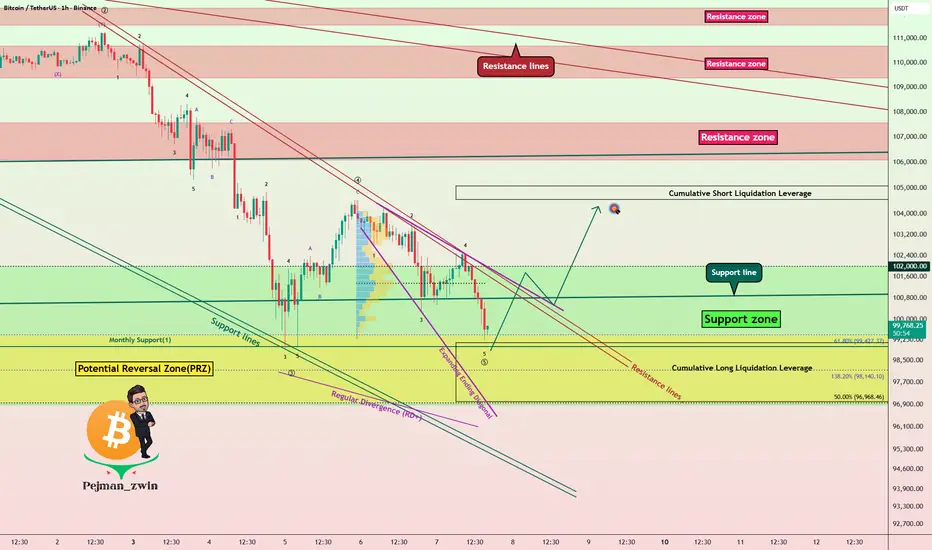
Bitcoin Bulls Defending $97K – Reversal Loading!Before diving into the Bitcoin analysis , it’s worth noting that Bitcoin has had a strong correlation with the SPX500 index ( SP:SPX ) in recent weeks. So, alongside analyzing Bitcoin, it’s a good idea to keep an eye on the SPX500 chart these days.
Currently, Bitcoin( BINANCE:BTCUSDT ) is moving in a Support zone($10200,980-$96,880) near a Potential Reversal Zone(PRZ) and a Cumulative Long Liquidation Leverage($99,145-$97,208) .
From an Elliott Wave perspective, it looks like Bitcoin is forming an Expanding Ending Diagonal to complete the microwave 5 of the main wave 5 .
Also, we can see a Regular Divergence(RD+) , which is a good sign of a potential reversal.
Given my expectation that the SPX500 Index will start to rise again, I also expect that Bitcoin will follow suit and could climb at least to around $104,200 .
Cumulative Short Liquidation Leverage: $105,074-$104,551
Stop Loss: $96,178
Please respect each other's ideas and express them politely if you agree or disagree.
Bitcoin Analysis (BTCUSDT), 1-hour time frame.
Be sure to follow the updated ideas.
Do not forget to put a Stop loss for your positions (For every position you want to open).
Please follow your strategy and updates; this is just my Idea, and I will gladly see your ideas in this post.
Bitcoin at a Decision Zone – Day 1👋🏻 Hey everyone! Hope you’re doing great! Welcome to SatoshiFrame channel.
✨ Today we’re diving into the 1-Hour BITCOIN analysis. Stay tuned and follow along!
🪙 Bitcoin on its one-hour timeframe is currently within a trading range, and due to the holidays, both volume and volatility have dropped to their lowest levels. According to the analysis, an important resistance has formed around $103,912, and a micro buyer support around $100,288. Once either of these zones is broken, Bitcoin could provide a trading opportunity.
📊 Bitcoin’s volume on the one-hour timeframe has now reached its lowest level, indicating that we are close to a potential move. This suggests possible upcoming volatility. As for the micro buyer floor, this level is crucial for buyers — when price reaches it, buying volume typically increases. To break this zone, it would require significant selling volume and large whale candles to overcome the long-biased traders.
🧮 My favorite oscillator, RSI, is also ranging between 30 and 70, which nicely overlaps with the identified support and resistance levels. A breakout from these RSI limits can confirm our risk level and validate potential trade entries.
✍️ You can read the possible scenarios for this trading range below. If needed, set your alert zones and use them accordingly. Don’t forget proper risk and capital management.
↗️ Long Position Scenario: A breakout above $103,912, accompanied by an increase in buying volume, would validate a potential long setup. This volume increase should also align with the oscillator, meaning RSI should break above 70 on the 1-hour or 15-minute multi-timeframe chart, along with increased market volatility.
📉 Short Position Scenario: A breakdown below the micro buyer floor at $100,288, with selling pressure and RSI falling below 30, could confirm a short position. However, it’s recommended to wait for a pullback after the breakout before entering the trade.
❤️ Disclaimer : This analysis is purely based on my personal opinion and I only trade if the stated triggers are activated .

BTC, Correction finished?CRYPTOCAP:BTC Price continues in a shallow range, down 22% from the all-time high, but sentiment is nearing extreme fear.
This complex correction appears complete at the trend-line boundary, where I bought, but I am giving it room for one more push lower to complete 5 waves down for Y. If wave 2 ends here, wave 3 is expected to be powerful and fast.
Price is below the daily 200EMA, which will offer some resistance at a High Volume Node. For now, the trend is down, and so further downside is the higher probability.
📈 Daily RSI has not reached oversold like all the other ranges did and is still bearish with no divergences.
👉 Continued downside brings up the next High Volume Node at $92000
Safe trading

EUR/USD - AUDNZD - GBP/USD - BTC - S&P500In this weekly video; I am analyzing the previous week and forecasting the next week.
EUR/USD - AUDNZD - GBP/USD - BTC - S&P500
Markets were quiet last week, and next week is very obvious.
Good luck to all of us.
Markets Titan

BTCUSDT.P - November 8, 2025BTCUSDT.P is showing potential for a short-term bearish reversal after approaching resistance near the $104,000 zone. A sell short limit is placed at $104,070, targeting a move down toward the $102,088 partial profit zone and the $100,475 profit level.
A sustained move above the $105,875 stop level would invalidate this short setup and indicate renewed upside momentum.
Risk Assessment: Moderate to High — structure leans bearish, but confirmation requires rejection from the $104,000 resistance zone and continuation below $102,000.

BITCOIN SIGNAL: PUMP INCOMING???? (trap alert) Yello Paradisers! Enjoy the video!
And Paradisers! Keep in mind to trade only with a proper professional trading strategy. Wait for confirmations. Play with tactics. This is the only way you can be long-term profitable.
Remember, don’t trade without confirmations. Wait for them before creating a trade. Be disciplined, patient, and emotionally controlled. Only trade the highest probability setups with the greatest risk to reward ratio. This will ensure that you become a long-term profitable professional trader.
Don't be a gambler. Don't try to get rich quick. Make sure that your trading is professionally based on proper strategies and trade tactics.

BTC Line In The Sand Bitcoin has had a turbulent Q4 so far and finds itself at ~$100,000 at the start of November.
The chart clearly defines the structure of the move since the beginning of 2024. Once breaking above last cycles ATH of ~$69,000 BTC's price has moved in relatively typical fashion for a bullrun uptrend. The tariff war marking the range low back in April and the highs have been capped at ~$125,000, on 4 separate weeks this area has rejected and remains major resistance.
As of now BTC is retesting the midpoint as support as it did back in June. Where this time is different is the momentum difference, since the first test of range highs the trend has gone into a choppy phase with lower lows being printed. This distribution pattern is vastly different and quite bearish. Another element to this is the diagonal support trendline that intersects the midpoint at roughly current price, losing this trendline would be added confluence that the bullish trend is over.
Should midpoint and diagonal support be lost the bottom half of the range comes into play, a 25% range that would open the door to a full retrace of this cycles progress back to 2021's ATH.
A strong bounce at midpoint keeps the uptrend alive at least in the short term but BTC would need to finally break range high.
Bitcoin At Make-or-Break Zone – Long Setup Ahead?Bitcoin ( BINANCE:BTCUSDT ) is currently moving near a Heavy Support zone($111,980-$105,820) , Support lines , Potential Reversal Zone(PRZ) , and Cumulative Long Liquidation Leverage($106,432-$104,513) .
From an Elliott Wave perspective , it seems that Bitcoin might be completing the microwave 5 of the main wave C .
As long as Bitcoin does not break below that Heavy Support zone($111,980-$105,820) , we can still be hopeful about long positions . There's a chance of a fake break of the support lines, and then Bitcoin might bounce back from the PRZ and start rising again.
I expect that after touching the PRZ , Bitcoin could rise back up and move toward the Resistance zone($110,700-$109,380) .
Note: If the support lines break with high momentum, please do not enter a long position.
Cumulative Short Liquidation Leverage: $113,085-$111,444
Stop Loss: $104,420
Please respect each other's ideas and express them politely if you agree or disagree.
Bitcoin Analysis (BTCUSDT), 1-hour time frame.
Be sure to follow the updated ideas.
Do not forget to put a Stop loss for your positions (For every position you want to open).
Please follow your strategy and updates; this is just my Idea, and I will gladly see your ideas in this post.
Please do not forget the ✅' like '✅ button 🙏😊 & Share it with your friends; thanks, and Trade safe.

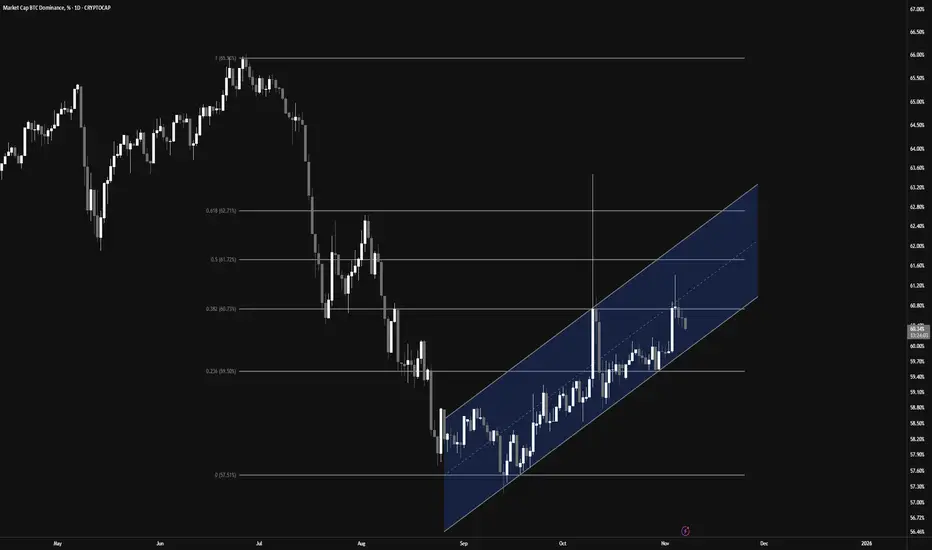
Bitcoin Dominance Rejection and Altcoin Pump👋🏻 Hey everyone! Hope you’re doing great! Welcome to SatoshiFrame channel.
✨ Today we’re diving into the 1-Day Bitcoin Dominance analysis. Stay tuned and follow along!
👀 On the daily timeframe, Bitcoin dominance has reached a key resistance zone at 60.73%. If this level breaks, we could see a deeper correction across altcoins. However, a rejection and move downward could trigger a strong rally for altcoins. As Bitcoin’s market weight decreases and capital flows into altcoins, we might be entering an early altseason, presenting potential profit opportunities.
🕯 From a technical perspective, Bitcoin dominance is moving within a well-structured ascending channel. The midline of the channel acts as a solid rejection point. A Fibonacci retracement from the previous downtrend shows a 38% overlap with this midline — a tough level to break. After a strong bearish candle rejection from that area, dominance is now heading lower. If the move continues, we could see a test of the channel’s lower boundary, and a confirmed breakdown would strengthen the altcoin bullish scenario.
💰 Typically, capital rotation in crypto follows this pattern: money flows into Bitcoin, then Ethereum, then the top 10 coins, and finally into smaller altcoins — before converting to USDT and exiting the market. With Bitcoin dominance currently at high levels after a solid Bitcoin season, this could signal the early stages of capital shifting toward altcoins. Traders should watch closely for these shifts to maximize profitability.
❤️ Disclaimer : This analysis is purely based on my personal opinion and I only trade if the stated triggers are activated .
Break of Support or Multi-Timeframe Trend Reversal ?👋🏻 Hey everyone! Hope you’re doing great! Welcome to SatoshiFrame channel.
✨ Today we’re diving into the 15-Mimutes Bitcoin analysis. Stay tuned and follow along!
👀 On the 15-minute timeframe for Bitcoin, we can see that after breaking a multi-timeframe support, Bitcoin is currently testing its support zone around $100,585.
If this zone breaks, Bitcoin could continue its downward move and experience further decline.
However, if it moves upward and breaks the resistance zone around $102,810, it could trigger a potential trend reversal.
🕯 Pay attention to Bitcoin’s volume — the volume indicator currently shows an increase in selling pressure, suggesting that we might see a short-term volume consolidation before the price continues downward again.
✍️ The current scenarios for Bitcoin include both long and short setups, which you can use to plan your trades based on how the market reacts.
🟢 Long Position Scenario : A break above the $102,810 resistance zone, accompanied by increasing buy volume and bullish momentum, could signal a good long opportunity toward higher levels.
🟥 Short Position Scenario : A break below the $100,585 support zone, along with increasing sell pressure turning into strong selling momentum, could offer a short opportunity in line with the current trend.
❤️ Disclaimer : This analysis is purely based on my personal opinion and I only trade if the stated triggers are activated .
BITCOIN daily FALLING-WEDGEBitcoin is in a falling wedge and very likely can break above that in the coming days

Bitcoin - dont guess - wait for price to show u a directionBitcoin - dont guess - wait for price to show u a direction
In a case of sqeezing with Oi rise - we`ll trade break up
in a cae fo bull trap - we take short
wait

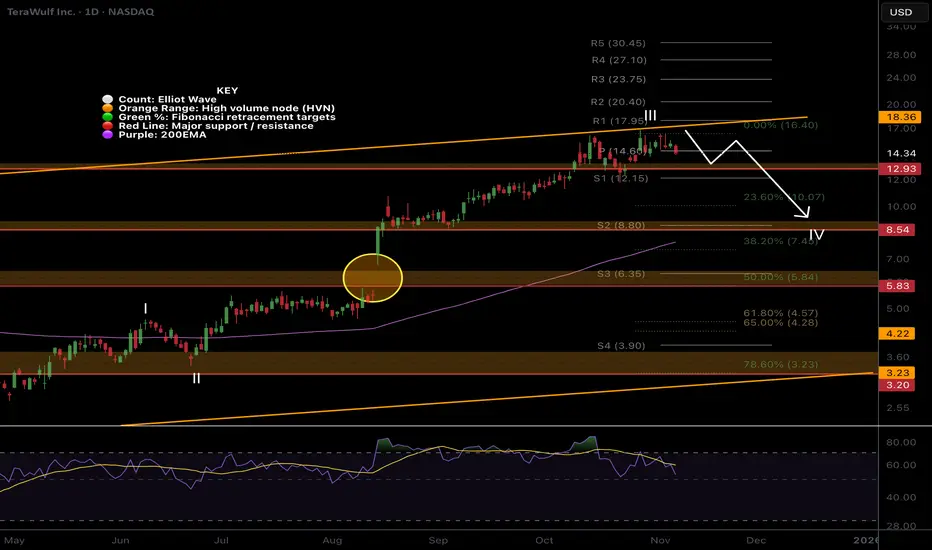
WULF pullback on the cards!Price is struggling at the trend-line boundary on bearish divergence suggesting wave III is complete and wave IV is soon underway.
Due to the size of the rally wave IV could be deep. The usual 0.382 target is down at $8 where it would meet the daily 200EMA.
Daily RSI has printed bearish divergence in overbought.
breaking out above the trend-line could be extremely bullish.