$BTC capitulation low?BTC looks like it's bottomed here. Everyone is looking for $98-100k, but I don't think we get it yet.
I think it's likely that we bounce towards the upper resistances from here, potentially even seeing a new high up at $126k, or revisiting the $122k region.
Let's see how it plays out from here.
Btc-bitcoin

Each time, they said, "Maybe it's over."It's not over this time either, but maybe CRYPTOCAP:BTC is starting again...
Each time, they said, "Maybe it's over."
But each time, Bitcoin found strength in the same demand zone, and the momentum supported this
This time, the place where everyone said "it's over" could be the beginning of a new peak.

BTCUSDT.P - November 3, 2025BTCUSDT.P is forming a potential lower-high structure within a broader corrective phase, suggesting renewed bearish momentum. The setup plans a sell short limit order at $116,380, targeting a move down toward the profit level at $100,904, with a stop level positioned at $131,811 for risk management. The structure favors a downside continuation as long as price remains below the $116,380 resistance zone. A break above the stop region would invalidate the bearish bias and shift momentum back to buyers.
Risk Assessment: Medium risk — while the market structure supports a bearish setup, the wide range and volatility around the $110,000–$120,000 zone introduce potential fluctuations before confirmation.

03/11/25 Weekly OutlookLast weeks high: $116,415.75
Last weeks low: $106,320.38
Midpoint: $111,368.06
This week will be the third week in a row where ~$116,000 is acting as weekly high and a major resistance level. Last weeks price action was clear, the bulls are incapable of flipping that level and making it new support. As a result the bulls retreated back towards strong support at weekly low ~106,000 completing the SFP. Also this pattern is a mirror image of the previous weekly outlooks price action. No clear trend bias at all here but what is obvious is bull market momentum is dying out.
Bitcoin has always been hyper sensitive to liquidity, as always month end window dressing by the banks have a negative effect on liquidity, it usually takes a few days to get over this and resume normal levels again. The Government shutdown in the US does not help this as spending from the Treasury General Account has stopped with approximately $150Bn coming out of the market in October alone as a result.
Should Bitcoin push higher it can only do so once Government operations resume IMO. FOMC resulted in a 25bps cut and QT (Quantitative tightening) is ending on 1st December, all bullish signs for the future but currently and for this week I think chop/ gradual drawdown continues.
Good luck this week everybody!

BTC Outlook after the Dip. What to expect NOW?The price is expected to drop to $102,000, followed by a bottoming phase and a renewed upward movement.

Bitcoin Beyond 2025, Path to 2029 Peak & 4 year cycleLikely bitcoin price movement for the rest of 2025 to the bear market bottom of 2026/27 and finally to the next bull peak of 2029
Check in early 2027 for accuracy

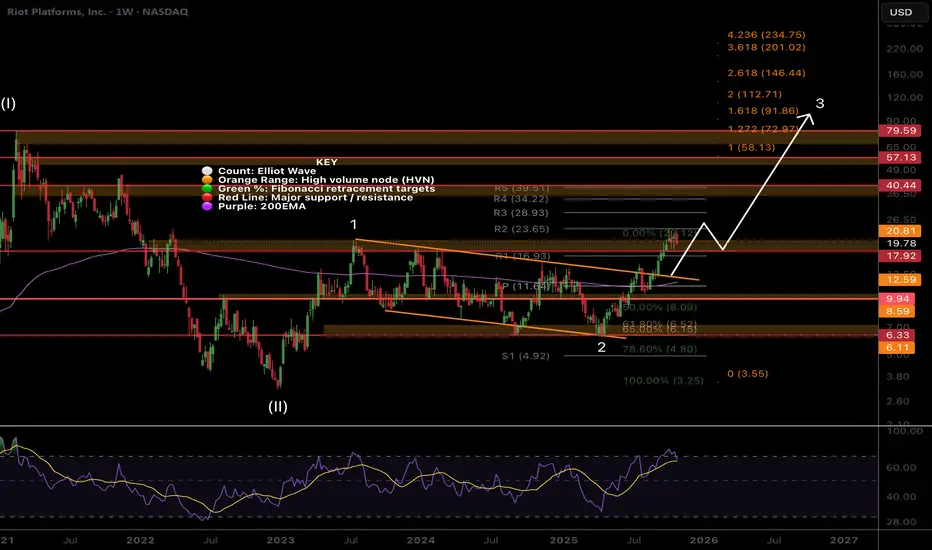
RIOT, nothing changed, Higher...Riot is another low cap volatile asset that keeps people afraid with its wild swings as I am seeing panic in my comments across platforms.
Price remains in momentum breaking out of the channel in a wave 3 with a minimum target of the 1.618 Fibonacci extension at $91, a 4x from here. Wave 2 completed at triple support- Fibonacci golden pocket, High Volume Node and channel boundary before quickly overcoming the weekly pivot and 200EMA. Breaking out above wave 1 is a show of strength.
Price should stall at the High Volume Nodes as supply comes in; $21, $40 and $57 but ultimately they should be overcome.
🎯 Terminal target for the business cycle could see prices as high as $112 based on Fibonacci extensions
📈 Weekly RSI is oversold with no divergence and can remain here for months as price keeps increasing.
👉 Analysis is invalidated if we close back below $9
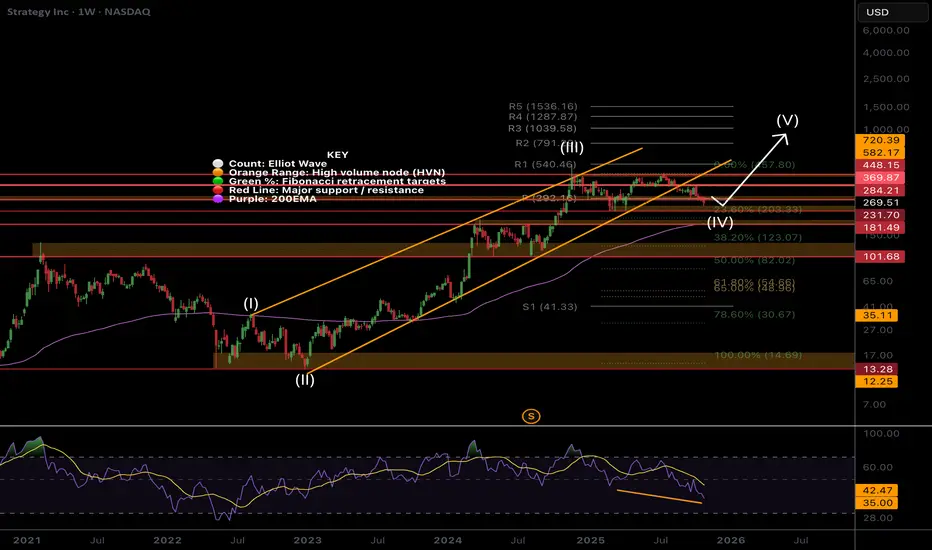
MSTR weekly bull divergence on low sentimentSentiment is low, the asset is hated and misunderstood by TradFi and retail. It’s a recipe for a bottom!
Price is still in a wave (IV) which are expected to be long and drawn out, driving investors into shallow capitulation through boredom into patient hands. I don’t expect wave (V) to kick in until Bitcoin moves. Wave (V) has an expected target of the R3 daily pivot at $1039 but will overextend if Bitcoin does.
Price has fallen out of the lower channel boundary and sitting below the weekly pivot, still above the weekly 200EMA so the outlook is bullish. Wave (4) may complete at the 0.236 Fibonacci retracement at $230. For now I am waiting to see what happens before entering. Good opportunities are setting up.
🎯 Terminal target for the business cycle could see prices as high as $1000 based on Fibonacci extensions
📈 Weekly RSI has bullish divergence
👉 Analysis is invalidated if we close back below $82
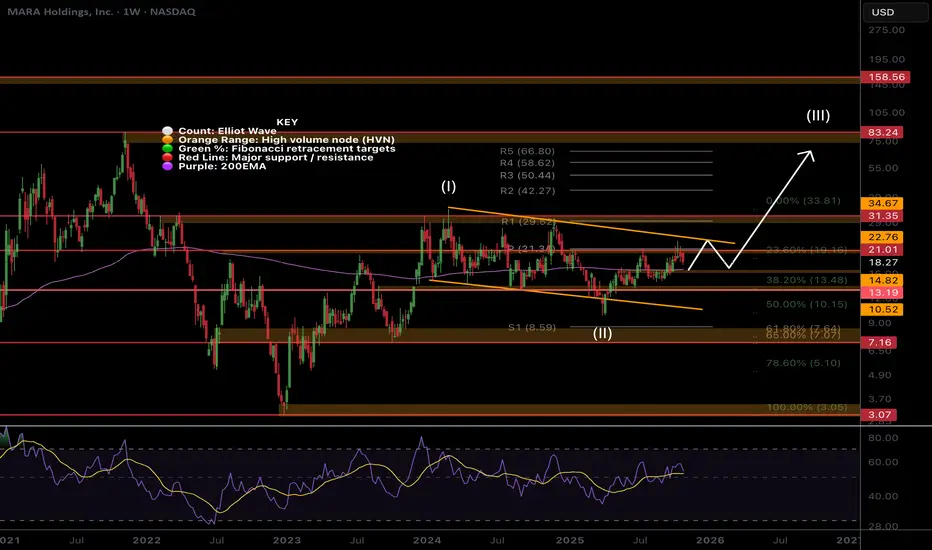
MARA boring... Investors cant waitMara has the potential for a strong move alongside Bitcoin but has ultimately been boring. Investors struggle the most with boredom and see is as negative and bearish. This is not the case and it could just be accumulating towards a strong breakout.
Price is stalling at the weekly pivot as expected but is above the 200EMA- a great buy spot. Wave (II) appears complete at the 0.5 Fibonacci retracement with a swing below the lower boundary trend-line. Wave 3 of (III) appears to be underway so I am looking for an aggressive breakout to the upside once we clear the current resistance. The R1 pivot is the first target at $30 where the last bit of major resistance is. Wave (III) has a target of $83 at the next major High Volume Node resistance, just above the R5 pivot.
🎯 Terminal target for the business cycle could see prices as high as $80 based on Fibonacci extensions and High Volume Nodes
📈 Weekly RSI is at the EQ.
👉 Analysis is invalidated if we close back below wave 2 at $9.50.
IREN ready for pullback?Price has overextended in a macro wave 3, the strongest and most powerful move described as a “wonder to behold” by Ellioticians. Novice investors are likely to get over-confident in these conditions, enter without risk management and keep chasing price upwards only to be underwater when it turns around.
Profit taking appears to be taking place, I have closed my positions waiting for re-entry. The weekly pivots have been ran.
Initial downside targets for wave (4) is the 0.236 Fib retracement at $39 followed by the 0.382, $26.43. Expect shorts to pile in adding to any downside momentum.
In the long term we have higher to go towards $100 in wave (5).
🎯 Terminal target for the business cycle could see prices as high as $100 based on Fibonacci extensions
📈 Weekly RSI is oversold with no divergence and can remain here for months as price keeps increasing.
👉 Analysis is invalidated if we close back below the weekly 200EMA

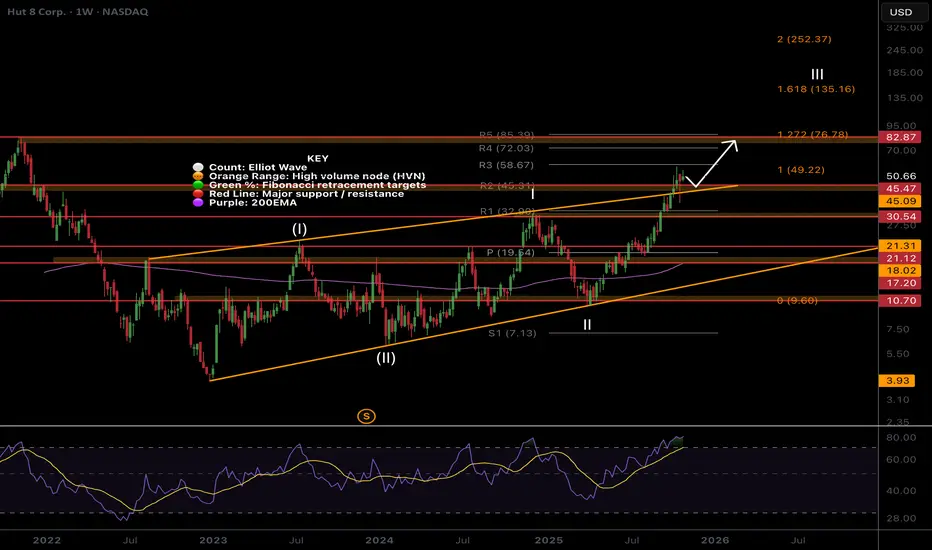
HUT, ready for more upsideHuge daily candles are perfectly normal behaviour and nothing to be afraid of, we stay zoomed out to observe the larger trend to keep our emotions check.
Price has broken out of the channel upper boundary and a test of the boundary took place as expected, quickly catching a bid. We are now looking for continuation to trigger a long.
The next target is the High Volume Node resistance at $82 just under the R5 weekly pivot. Fibonacci extension 2 has a terminal target of $252, achieved with momentum and tailwinds only.
📈 Weekly RSI is oversold with no divergence and can remain here for months as price keeps increasing.
👉 Analysis is invalidated if we close back below the weekly 200EMA
COIN Much higher to comeCoinbase had a shallow pullback in wave (II) after running 10x in wave (I). Wave (II) was expected to reach the 0.618 Fibonacci retracement but was front run above the 0.5 demonstrating long term strength.
R5 weekly pivot target is now $841 which is expected to be hit if we get tailwind momentum in wave (III). Price appears to be finding a bottom locally and preparing for the next leg up into price discovery.
RSI has plenty of room for months of overextension in price.
🎯 Terminal target for the business cycle could see prices as high as $800 based on the weekly pivots
📈 Weekly RSI is oversold with no divergence and can remain here for months as price keeps increasing.
👉 Analysis is invalidated below wave (II), $148

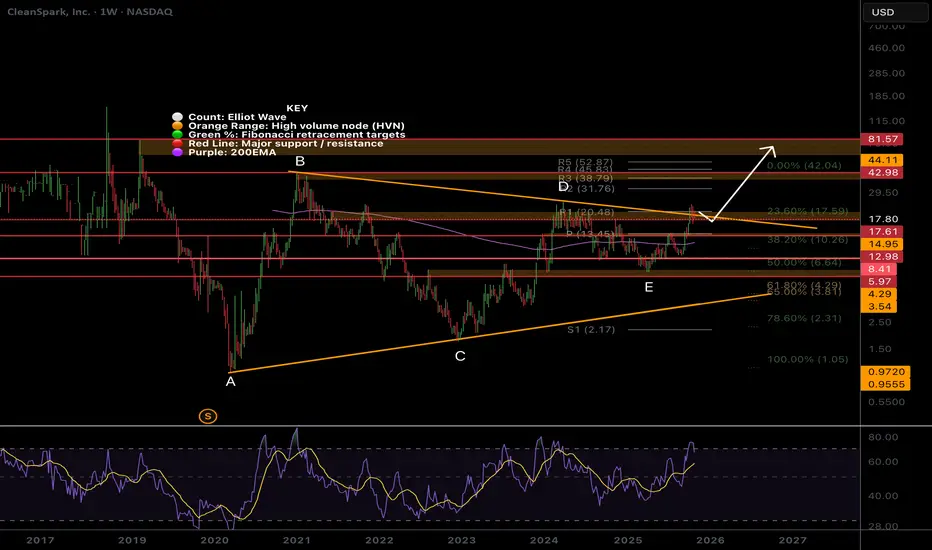
CLSK, Still much higher to goTheres a lot of fear in my comments across platforms due to the candle sizes. Participants need to understand the volatility of their holdings or face repeated mistakes and stress due to fear.
Price is attempting to breakout of the macro triangle upper boundary but was rejected. Breaking above wave D at $24 is key to trigger the next thrust I’m looking for towards $42 then $80 all time High Volume Node. Triangles are penultimate patterns found before a final strong move.
Price has momentum above the weekly pivot 200EMA but currently trapped in a High Volume Node where we expect price to stall before continuing upwards.
🎯 Terminal target for the business cycle could see prices hit $80- the all time High Volume Node
📈 Weekly RSI is oversold with no divergence and can remain here for months as price keeps increasing.
👉 Analysis is invalidated below wave E, keeping the triangle alive
BTDR Nothing changedHuge daily candles are perfectly normal behaviour and nothing to be afraid of, we stay zoomed out to observe the larger trend to keep our emotions check. It is feature of these type of assets and is why we can make so much money from them when using the right risk management strategy.
Our first profit target has been hit at $25 all time High Volume Node where price is finding a range as some exit. Price has done 10x since the 2023 bottom. Once this range has worked itself out price is expected to continue upwards into price discovery. A retracement to the weekly pivot should be expected, where I will add to my positions and look for a long.
The macro structure is bullish in an Elliot wave ABC as there are many series of 3 wave structures. Wave (3) of C of (C) is underway with a target of the 1.618 Fibonacci extension $41.17. Price can significantly overextend in volatile assets with momentum and it’s these extremities we look to take secondary profit.
🎯 Terminal target for the business cycle is still the channel upper boundary and R3 weekly pivot at $55. A break out above this would be very bullish and could see prices as high as $80+
📈 Weekly RSI has months left of upside potential.
👉 Analysis is invalidated below wave B and 200EMA, $11.

Has Bitcoin already priced in its next move ? | Day 56☃️ Welcome to the cryptos winter , I hope you’ve started your day well.
⏰ We’re analyzing BTC on the 1-Day timeframe .
👀 Bitcoin on the daily timeframe. After the flash crash it experienced, Bitcoin is almost building a box with a top at $114,559 and a bottom at $106,431, which by breaking these areas, it can get out of this trading range and give us a position.
The noteworthy point in the recent days is the Monday meeting between Trump and the President of China, which can determine the destiny of the market and give it a good direction.
🧮 The RSI oscillator, two key zones have formed for us in the areas of 54.5 and 36, and by the fluctuation limit crossing these areas, the next move of Bitcoin can begin.
🕯 Bitcoin’s volume on the daily timeframe has increased sharply after recording a new all-time high, and this has been a tendency toward increasing selling pressure. In the image, it is completely clear that you can see exactly what happened to the market after the flash crash it experienced.
📈 To take a position with this structural style that we currently have, you can refer to the multi-timeframe analysis of Bitcoin and extract the long and short position triggers, and if Bitcoin gives you an entry, enter the position around the anticipated top or bottom with low risk so that later you can add more volume to your position at higher or lower levels.
❤️ Disclaimer : This analysis is purely based on my personal opinion and I only trade if the stated triggers are activated .

Has Bitcoin entered the distribution phase yet?👋🏻 Hey everyone! Hope you’re doing great! Welcome to SatoshiFrame channel.
✨ Today we’re diving into the 4-Hour Bitcoin analysis. Stay tuned and follow along!
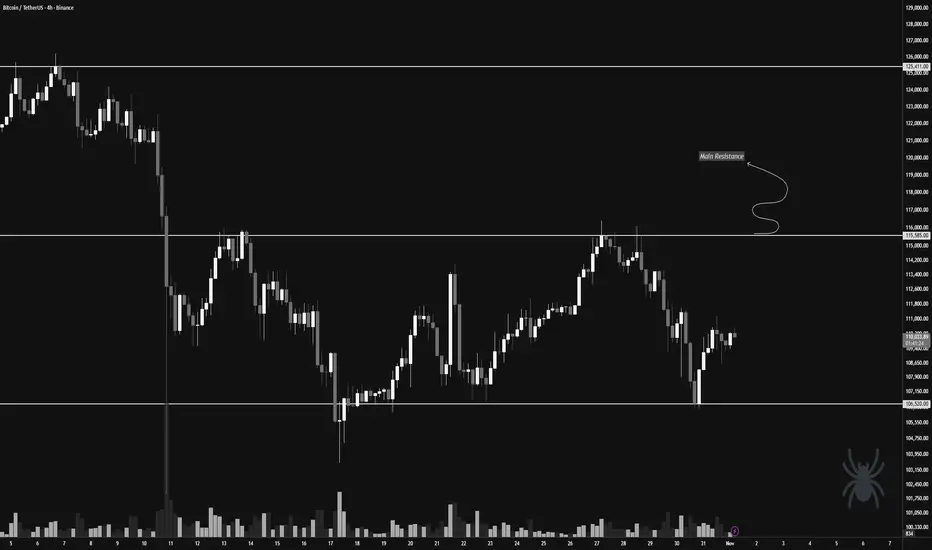
👀 On the 4-hour timeframe, we can see that Bitcoin recently dropped due to the impact of the FOMC news but then rebounded from the key support level at $106,520 and is now facing its multi-timeframe resistances. Looking at the chart more broadly, we notice equal highs and lows around the $115,585 and $106,520 zones. With a breakout of either of these levels, Bitcoin could experience a sharp and significant move.
🧲 Bitcoin’s selling volume has slightly increased, and if the supports break, this selling could turn into pressure — collectively applying downward force on the market price. Then, buyers may re-enter and start buying Bitcoin again. The hypothesis of a possible distribution phase could turn into a valid theory; however, we must be cautious — if Bitcoin decides to move upward after Monday’s session, it could confirm a new all-time high and continue its upward trend.
✍️ The main scenario for Bitcoin lies around the $115,585 price zone. If this level breaks, we could enter a long position and stay with it for a potentially extended upward move. It’s worth noting that an increase in buying volume along this path could serve as a strong confirmation for our long position.
On the other hand, the short position scenario would become valid if the price breaks below the support and selling pressure intensifies, giving us a high-momentum short setup.
❤️ Disclaimer : This analysis is purely based on my personal opinion and I only trade if the stated triggers are activated .
BITCOIN SIGNAL: HERE IS THE NEXT MOVE!!!! (damn)Yello Paradisers! Enjoy the video!
And Paradisers! Keep in mind to trade only with a proper professional trading strategy. Wait for confirmations. Play with tactics. This is the only way you can be long-term profitable.
Remember, don’t trade without confirmations. Wait for them before creating a trade. Be disciplined, patient, and emotionally controlled. Only trade the highest probability setups with the greatest risk to reward ratio. This will ensure that you become a long-term profitable professional trader.
Don't be a gambler. Don't try to get rich quick. Make sure that your trading is professionally based on proper strategies and trade tactics.

BITCOIN RALLY STARTEDI believe now after bitcoin re-tested the trendline which is a great support, the rally for November & December is on the way

Are you ready for a $BTC next leg?Bitcoin is preparing for a new upward wave towards the resistance zone, reacting to the rising wedge-on-uptrend formation.
This structure often signals a decisive moment after recent momentum.
The reaction to the resistance line will determine the next trend direction.
Staying on top of the trend is crucial during this period.

Bitcoin is at key resistanceBitcoin is at key resistance
i`ll take SHORT ONLY in a case of clear trap

BTC Building Momentum — 112K+ Zone ON WAY.Bitcoin has held strong within the recent volume area, showing solid support and renewed buying pressure.
After rebounding from the lower levels near $106K–$108K, BTC is now pushing upward and appears on track toward the first target zone around $112K–$114K.
📈 Market Outlook:
Strong recovery from the volume area confirms short-term buyer control.
Resistance lies between $111.6K and $113.3K, marking the first target zone for this upward move.
Sustained momentum above $109.8K could trigger acceleration toward $114K+ in the next sessions.
📊 Observation:
Volume has started to align with bullish movement — if this continues, BTC could retest upper resistance and possibly extend toward $116K.
However, a pullback below $108.6K would suggest consolidation before another attempt higher.
💬 Summary:
BTC is on its way toward the first target zone above $112K, showing growing strength after reclaiming key volume support. Momentum remains positive as long as price holds above the mid-range.

Alts Crushed, BTC Next: Wyckoff Says the Top Is InTracking this top formation scenario since January 2025. A classic Wyckoff topping structure started forming and we're nearing the end of Phase B, Phasce C typically marked by a peak and expected collapse around March 2026. The weekly RSI continues to trend downward.
The market has already sold off most altcoins, with remaining BTC likely to follow. RSI weakness persists.
Final long positions through to Jan then Shorts only.
Best Hard Forky

Ethereum Game Plan - TDLRKZ MODELEthereum Game Plan - TDLRKZ MODEL
📊 Market Sentiment
On 29/10, the FED lowered rates by 25BPS, as expected. However, Powell’s comments introduced uncertainty regarding another cut in December, stating that further policy moves depend on incoming data.
Interestingly, one FED member dissented, preferring no cut this cycle — a shift from September when all members supported easing.
Following the statement, rate-cut expectations dropped from 95% to 68%, prompting traders to take profits and hedge, creating a short-term bearish sentiment across markets.
Despite this, the mid-to-long term outlook remains bullish, given the broader liquidity cycle and easing policy bias.
📈 Technical Analysis
Ethereum is currently accumulating inside a well-defined range.
Price failed to sustain above the $4950 range high and has started retracing toward the HTF bullish trendline, a potential reaction zone aligning with prior liquidity pools and confluences.
If price holds around this zone, ETH could seek the range high again once momentum returns.
📘 Model in Use – Trendline Deviation with HTF LR into Key Zone (TDLRKZ Model)
This model identifies setups where price deviates from HTF trendlines while interacting with liquidity zones and key structural levels.
The goal is to align HTF context with LTF confirmation for high-probability trend continuation setups.
Model Steps:
1️⃣ Identify the HTF trend direction and only trade in that direction.
2️⃣ Mark the HTF bullish trendline supporting price.
3️⃣ Spot HTF Key Zones likely to act as reaction areas.
4️⃣ Locate nearby liquidity pools or order concentrations.
5️⃣ Wait for confluence: when all align, confirm with a 4H market structure break for entry.
📌 Game Plan
Looking for ETH to retrace into $3350 and reject from that level.
If a 4H break of structure occurs and daily candle closes above $3350, this will trigger a long-biased setup.
🎯 Setup Trigger
→ 4H structure break after tagging $3350
→ Daily close above $3350
📋 Trade Management
→ Entry: After confirmation above $3350
→ Stop Loss: Below swing low that caused 4H break of structure
→ Targets:
TP1: $4150 (EQ)
TP2: $4550
TP3: $4950 (Range high)
→ Move SL to breakeven after TP1 is reached.
💬 Check my Substack for deeper macro and sentimental breakdowns — free subscriptions are open.
⚠️ Disclaimer: This content is for educational purposes only and does not constitute financial advice. Always DYOR before trading.
