BTC 74715.11 — The Capital Sector. Price Slice. 21.11.2025BTC: Two Prices the Market Hasn’t Reached — But Already Remembers.
77664.50 & 74715.11 — The Capital Sector.
77664.50 — as of publication, the price has not been reached.
74715.11 — as of publication, the price has not been reached.
Every price has its time of execution.
Do not rush.
Study my work.
Everything has only just begun.
What is the right question to ask?
Are you coming to the market for the price…
…or for the noise of indicators?
What is the correct question?
Will the market reverse — or not — at the moment of publication?
Or, even if it reverses, will the price return to it?
On which timeframe?
Something else matters.
For capital — the price exists.
It will exist.
And it is agreed upon.
This is not merely a price. It is a point of decision.
This is not a signal. It is a fingerprint.
This is not a forecast. It is the market’s memory.
My respect — to the international community.
— The Architect
P.S. English is not my native language — I offer no apologies for stylistic imperfections. What you see here is not a post. It is a demonstration of another level of preparation: the symbiosis of human intuition and algorithmic precision. Mathematics and aggressive market analysis — against the machine of liquidations.
BTC-D

Bitcoin dropped as planned. Wait for a new range to take SHORTBitcoin dropped as planned. Wait for a new range to take SHORT
global trnedi si still down
at this moment big liqudation had happend that's why price could create a range before new down move

BTCUSD - Bear Run Began Looking at this indicator on chart price shows the red area which is normally hit during bull runs
however this time it was not hit, and price is just trending over the curve in the middle of this indicator.
I believe the bear run for bitcoin has begun and what we will see is sideways movement and downward movement.
Look to enter in the lower green zone when it hits there on this timeframe, Daily.
The price action in white is just an example of what movement downward could look like.

Bitcoin Next Move ? 108KWhy BTC Could Push Toward / Above $108K
Technical Setup
BTC is trading in a relatively tight range below the $107,500–$108,000 resistance.
Cycle & On-Chain Dynamics
Historically, Bitcoin bull cycles don’t peak immediately after a halving — this could mean room to run. Some analysts think we haven’t hit the top yet.
Some bullish chartists (e.g., “Titan of Crypto”) project a parabolic run if BTC clears $108K.
Is $108K A Realistic Next Move? Yes,

Bitcoin VS bearish crossAfter the bearish cross on the daily chart for Bitcoin, 75% of the time it has led to a bounce lasting 3–5 months, which triggers a rally in altcoins. This time we will probably see a nice altcoin rally until March 2026, IMO.

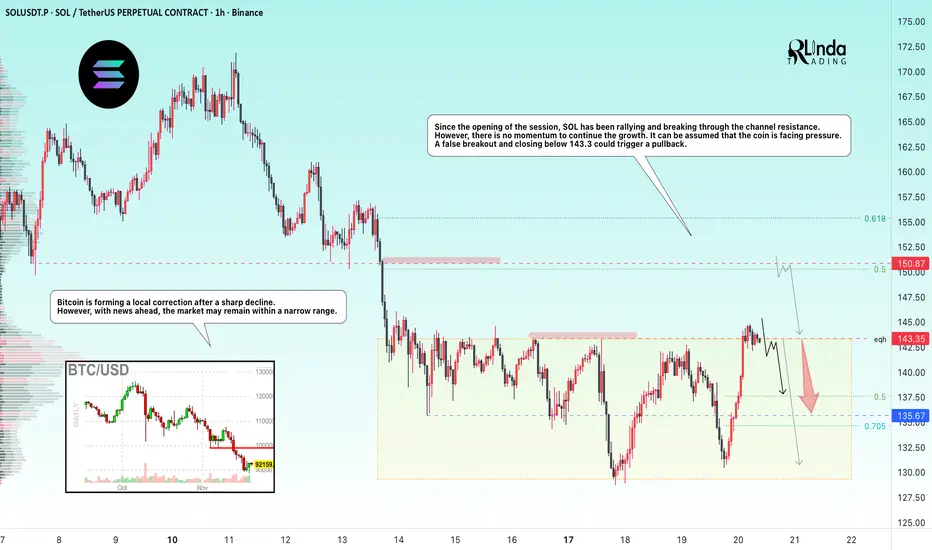
SOLANA → Manipulation - false breakout of resistance BINANCE:SOLUSDT.P flew up to resistance at 143.35 at the opening of the session and attempted to break through it, but bears may not let the price rise ahead of the news...
Bitcoin is forming a local correction after a sharp decline. However, news is ahead and the market may remain within a narrow range.
From the opening of the session, SOL rallies and breaks through the channel resistance, wasting 75% of its intraday growth potential. However, there is no momentum to continue the growth. It can be assumed that the coin is facing pressure. A false breakout and closing below 143.3 could trigger a pullback.
Resistance levels: 143.35, 150.87
Support levels: 135.67, 130.0
Two key levels for countertrend movement: 143.35 - 150.87. If the liquidity pool does not stop the price at the nearest level, then 150.87 can be considered as an additional level for trading a false breakout.
However, news on unemployment is coming soon, and the market may react quite aggressively. Therefore, if there are no trading opportunities before the news, I recommend refraining from action for an hour and waiting out the storm...
Best regards, R. Linda!
USDT-DOM- As usual, the charts tell the story very simply, watch the USDT triple top and the RSI divergence for clues.
- At times, tracking USDT trends gives clearer signals than watching BTC price alone.
- It’s an odd moment in the market, no real FUD, constant talk about crypto, yet price movements are surprisingly muted.
- Some major players are trying to shake out weak hands and buy your crypto lower. Stay focused: HODL and accumulate.
Time your entries and DCA, be a trader, not a victim of the cycle.
Happy Tr4Ding !

Is it really possible for Bitcoin to reach 1 million dollars?Is it really possible for Bitcoin to reach one million dollars?
This is the complete Bitcoin data | from when it was $0.01 up to the last all-time high of $125K. Whether we like it or not, a large-degree pattern on Bitcoin is reaching completion, and we are looking at the chart without bias, purely through wave theory.
The symmetrical pattern you see on the chart is on the monthly or 2-week timeframe.
We are currently in the final wave, wave i of W. Wave i of W itself is a diagonal or symmetrical pattern (which we discussed in THIS POST () |this post only concerns branch i of W of this pattern).
When such a large pattern completes, there are two possibilities:
A counter cycle of the same degree begins , or
An X wave forms.
First scenario: forming a new pattern is very unlikely because if it happens, the Fibonacci 0.618 target of this pattern would be reached | around $4–$10 for Bitcoin. If this happens, the entire crypto market would effectively become a scam. This scenario is highly improbable and currently illogical.
Second scenario: the formation of an X wave. It’s worth explaining X waves: X waves connect patterns of the same degree without requiring large time-price corrections relative to the previous pattern, allowing a phase | whether bullish or bearish | to extend. Here, since the first phase is bullish, the pattern after the X wave will also be bullish.
For Bitcoin, if an X wave forms, the best range for it to end is $32K–$14K, and the X wave could last until 2027–2028. The two time lines indicate where the X wave could end.
When a new cycle begins, it is of the same degree as the previous pattern. This means we will have years of bullish phases with corrections, similar to the first phase W, which is represented on the chart from wave A to I.
The target of the second pattern, Y, after the X wave, can realistically reach $1 million! The estimated time frame for reaching this target is 2031–2039, but why the 8-year tolerance? This accounts for the pattern type: if it’s a triangle, these targets could be reached faster, but if it’s another multi-branch pattern, the timing may extend.
From a technical and wave-theory perspective, this is indeed possible. This is our broad 10-year outlook on Bitcoin.
❤️ Stay with us updates will be provided in the future with support and resistance zones plotted on the chart. Do you really think Bitcoin can reach $1 million?

BTCUSDT Weekly Chart Analysis. BTCUSDT Weekly Chart Analysis
Major Structure: Bitcoin is experiencing a significant correction, now testing the most important multi-year support zone around $80,000–$82,000.
Patterns: The chart shows multiple rounded bottoms and a massive base structure, indicating repeated accumulation phases since 2021.
Support Zone: This highlighted area is not only a former breakout region but also converges with major horizontal and trendline support levels, making it highly significant for bulls.
If buyers defend this zone, a swift rebound toward $123,000–$130,000 is likely, maintaining the long-term uptrend.
Failure to hold here increases risk for deeper corrective moves, and the next support would be much lower.
Momentum Shift: The steepness and sharp drop into support reflect panic or forced selling, often associated with extreme sentiment lows.
DYOR | NFA
BTC 1W: preparing a reversal or just stretching the correction?Bitcoin trades in the 85,500–86,000 area, moving steadily toward the key weekly MA100 around 83,200 - the primary dynamic support of this cycle and the level where prior corrections have consistently formed bullish reactions. As long as price respects the lower boundary of the rising channel, BTC maintains a controlled corrective structure: liquidity is being taken below local lows, setting up the conditions for a rebound into the major 104–109K supply zone. This area remains the central mid-term target for recovery, aligning with the 0.5–0.618 Fibonacci cluster, the upper boundary of the previous distribution range and the zone of prior large-scale selling.
Fundamentally as of November 21, the market is shifting from euphoria into redistribution: ETF and institutional flows have slowed, large holders are taking profits, and a strong dollar alongside elevated real rates is pressuring risk assets. Network strength remains intact - hashrate near all-time highs and miners still expanding capacity - even though their margins are tightening. This is a typical late-stage cycle environment: short-term downside pressure with long-term trend strength preserved.
As long as BTC has not yet touched the MA100, the base scenario remains a dip into 83K followed by a rebound toward 104–109K. A breakout above 110K restores bullish continuation, while a loss of 80K accelerates the move toward 70–75K and the weekly MA200. This correction is not the end of the cycle - it’s a cooling phase after an overheated expansion.
Bitcoin does what it always does: terrifies everyone near MA100, then moves exactly when most have given up waiting.

$BTC spot planBuying Bitcoin in purple box. Think 86k area will act as a good support. This is not a leverage trade. I am buying this spot so I can adjust my stoploss later if I want to.

BTCUSD ShortAs you see in the chart, I see many reasons that we can see BTC to the level of 85,000$ by end of the year. So the reasons are:
Head&Shoulder pattern
Started the downtrend channel
The bold blue trendline is what the price is expected to touch.

Bitcoin BTC Bullish Structure Break with Key 61.8 Level in FocusBitcoin is showing early signs of strength, with a clear bullish shift in structure on the 30-minute timeframe 🚀. With that momentum coming in, the main level to watch now is the 61.8% Fibonacci retracement of the current price swing.
A potential buy setup becomes valid only if price pulls back and holds above the 61.8 level 🔥. Holding this zone would signal that buyers are stepping in and maintaining control of the move. If price respects this level and continues to break structure to the upside, the bullish continuation becomes much more probable.
If Bitcoin breaks below the 61.8 retracement, the idea is invalidated and should be abandoned. At that point, momentum would no longer support the long bias ⚠️.
Not financial advice.

BITCOIN — THE SUPPORT LINEBitcoin’s ultimate support for bulls lies between the two black lines shown above.

$DXY $BTCHope all is well and wishing you a wonderful 2025 Holiday Season.
CRYPTOCAP:BTC & TVC:DXY
In recent news, Bitcoin and the Dollar are currently priced at $86,466 & $100.26.
I believe the Dollar will increase through 2026-2027, as the economy reflects current labor markets, deflation, and "risk-off" equities, as investors seek safe harbor during troubling times.
From the historical price action, you can see the Dollar gaining strength, as CRYPTOCAP:BTC falls relative to the Dollar demand.
Vice versa, as the Dollar weakens, risk profile turns on and price action increases for CRYPTOCAP:BTC and other speculative assets.
I'm estimating TVC:DXY to reach $110-$115 (Average $112.50), which can place CRYPTOCAP:BTC around $62,000-$46,000 (Average $54,000).
God Speed,
JR

BITCOIN Is the first Bear Cycle RALLY approaching?Bitcoin (BTCUSD) has been on a brutal (but technically anticipated) correction ever since its October 06 All Time High (ATH), registering 6 red candles out of last 7. We have shown in previous analyses why the Bear Cycle has technically started, how the market lost the 1W MA50 (blue trend-line) and is now about to touch the 1W MA100 (green trend-line).
This is the time where we may see a counter-trend rally, the first within this Bear Cycle. First of all, BTC has just completed a total decline of -32.30%, exactly like the January - April 2025 correction and identical to the -33.55% March - August 2024 correction. This is why we project the 86600 - 83600 range as the first technical Support Zone of this Bear Cycle and potential rebound candidate. In the meantime, the 1W RSI is approaching the 30.00 oversold barrier, which further enhances the probabilities for a relief rally.
If materialized, it can technically rise even as high as the 0.618 Fibonacci retracement level, where it may make contact with the 1D MA100 (red trend-line), even above the 1W MA50. The 1D MA200 has been the counter-trend rally rejection trendline and Resistance of the previous two Bear Cycles. Coupled with the 0.618 Fib, it forms a formidable market Resistance Zone.
This rally may coincide with a final stock market rally, what is traditionally called 'the Santa Rally', which is the end-of-year rise on the markets. Technically that can be the perfect Bull Trap that rejects the rebound and resumes the bearish trend towards Lower Lows and eventually the 1W MA200 (orange trend-line).
So do you think we are finally about to see the first rally of this Bear Cycle? Feel free to let us know in the comments section below!
---
** Please LIKE 👍, FOLLOW ✅, SHARE 🙌 and COMMENT ✍ if you enjoy this idea! Also share your ideas and charts in the comments section below! This is best way to keep it relevant, support us, keep the content here free and allow the idea to reach as many people as possible. **
---
💸💸💸💸💸💸
👇 👇 👇 👇 👇 👇

BITCOIN CRASH! TIME TO BUY?I hope you guys enjoyed the video! If you have any questions or comments; feel free to comment down below

Bear Cycle Beginning(On the Daily Chart)
2-3 days ago, Bitcoin officially broke down and out below the upward channel it has been in for over 1050 days. It broke down from the channel, retested the bottom of it, and now is continuing downward to make a lower low today.
THAT IS BAD. Muy malo.
Sehr schlecht. Molto male.
The RSI is also confirming a break to the downside.
This time frames match with prior cycles.
Potential correlation to halving cycles is noted.
Note: The 2 year expansion and contraction cycles are exponential in growth while if you look at them is totality, the upward trend shows a logarithmic curvature when you connect the highs from the last 12 years.
IF,
This is a normal bear cycle pullback like the last few, we'll see 30k.
(Yellow Path)
We can't really know for sure, so it's silly to anticipate for this, but as an alternate case,
IF,
This is the end of the larger cycle, meaning the end of Act 1, where crypto doesn't bottom until it is announced dead in the newspapers, then just set a reminder in 5 years to check back unless you want to swing trade the thing with massive volatility.
(Red Path)

TradeCityPro | Bitcoin Daily Analysis #226👋 Welcome to TradeCity Pro!
Let’s dive into today’s Bitcoin analysis. Our new short triggers have activated, and the market is continuing its downward movement.
⏳ 1-Hour Timeframe
After Bitcoin made a fake downward move yesterday, today it formed a lower high below 93,555, and after breaking the 90,489 and 88,825 levels, it is now continuing strongly to the downside.
⭐ A very large amount of selling volume has entered the market, giving full control to the sellers. The downtrend is continuing with strong momentum.
✨ The next support levels are 85,846 and 83,333.If you already have open short positions, you can use these levels for partial profit-taking.
✔️ The RSI oscillator is currently in the oversold zone, around 21.53.Breaking this level could push the bearish move even further.However, if RSI gets supported here, momentum may weaken, and a correction could begin.
💡 If a correction happens, the resistance zones to watch are 88,825 and 90,489.Our main confirmation for a trend reversal will still come after breaking 93,555.
❌ Disclaimer ❌
Trading futures is highly risky and dangerous. If you're not an expert, these triggers may not be suitable for you. You should first learn risk and capital management. You can also use the educational content from this channel.
Finally, these triggers reflect my personal opinions on price action, and the market may move completely against this analysis. So, do your own research before opening any position.

MSTR to $676MSTR is on major support, looking to run to $676 once bitcoin lifts (currently just below it's long term trend buy area).
Good luck!

BTC 365 Day FallIn my view, Bitcoin has a realistic chance of dropping into the $35K–$40K zone around October. The first major signal that led me to this idea was the death cross that appeared on the daily chart. When the 50 SMA crosses below the 200 SMA, it usually points toward weakening momentum and potential downside pressure.
I also saw a clear break of structure on the Weekly chart to the downside, which strengthens the bearish outlook. BOS shifts like this often show that buyers are losing control and that the overall trend may be preparing to reverse or correct. For me, that was another piece of confirmation that the market might not be ready to continue upward just yet.
On a bigger scale, the current bull cycle has already lasted roughly 1,080 days, which is historically accurate for the last 12 years. Typical bear cycles tend to run closer to 365 days, so based on cycle theory alone, the timing lines up for a potential deeper correction of about 60-75% With all of these signals combining, I think a move toward the $35K–$40K range is very possible.
I am not a financial advisor, and the information in this post is for educational or discussion purposes only. Please do your own research and consult a licensed professional before making any investment or trading decisions.

Geopolitical Shock Hits Bitcoin | Traders Eye 106.20K Key Level BITCOIN (BTCUSD) | Overview
China Accuses U.S. of Seizing $13B in Bitcoin as Tensions Escalate.
A long-running Bitcoin mystery from 2020 has resurfaced — this time involving a geopolitical twist.
China has accused the United States of secretly taking control of 127,000 stolen Bitcoins, valued at roughly $13 billion, in what could become one of the most controversial crypto disputes to date.
The allegation has added fresh strain to the already tense relationship between the two largest global powers, fueling uncertainty in both crypto and broader risk markets.
Technically:
Bitcoin shows signs of bearish momentum, with price action likely to retest 102.64K.
A confirmed break below this level could extend the decline toward 98.94K and 95.50K.
However, if the price closes a daily candle above 106.20K, it would signal renewed bullish momentum, targeting 110.36K, and potentially 113.80K on further strength.
Pivot Line: 106.20K
Resistance: 110.36K · 113.80K · 116.40K
Support: 102.64K · 98.95K · 95.50K
Outlook:
Bitcoin remains bearish while below 106.20K, with downside potential toward 102.64K – 98.95K.
A confirmed daily close above 106.20K would shift momentum to bullish, opening the way toward 110.36K – 113.80K
previous idea:
BTCUSDT.P - November 21, 2025Price is in a short‑term downtrend, with a series of lower highs and lower lows after rejecting the highlighted resistance area near 92,300–92,500 and breaking back below intraday consolidation. Loss of upside momentum and a rotation from a prior minor rally confirming sellers’ control and opening the door for continuation toward the marked support area around 88,800–89,200.
