$BTC - Initial Bearish RetestCRYPTOCAP:BTC | 1D
Bitcoin failed to get back above 117k, that's our initial bearish retest after the breakdown.
If monthly low or 112k doesn’t hold, price could revisit 110–108k this week.
BTC-D

#Bitcoin Weakness Alert: $BTC is showing weakness as it struggle#Bitcoin Weakness Alert:
CRYPTOCAP:BTC is showing weakness as it struggles around the 115K (50 EMA) level.
🔸 Key Support:
If BTC loses the 115K support and resists below the 50 EMA, downside pressure increases. The next critical level is 110K.
🔸 Upside Target:
Holding above 115K with strength can trigger a move back toward 120K and possibly extend to 125K.
🔸 Risk Level :
A confirmed break below 110K will likely open the path for a dump toward 100K.🚨
🔸 Outlook:
Monitor 115K closely. If price holds above, upside continuation is possible. If broken, expect a deeper correction with 110K as the last major support before 100K.
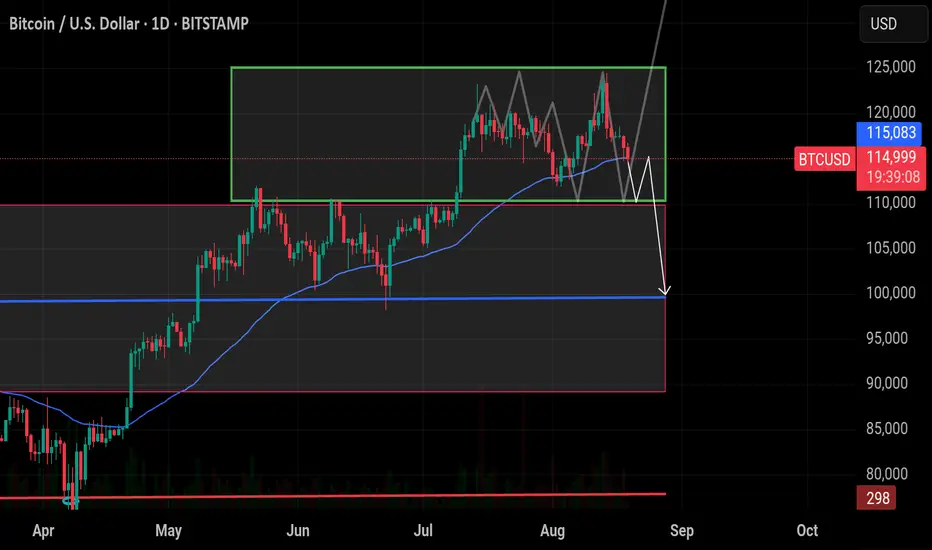
Bitcoin : Stay heavy on positions
In the short term, there's a potential for a bounce off the previous "short-term overbought" zone, which now serves as support—a textbook pattern.
From a longer-term perspective, my view remains unchanged.
Bitcoin : Stay heavy on positions (2x)
** This analysis is based solely on the quantification of crowd psychology.
It does not incorporate price action, trading volume, or macroeconomic indicators.

BTC 1DBitcoin is at the bottom of the range at the $115,500 , keep an eye on the $113,800 and $12,000 zones.

BTC short idea, Pullback might be on its way. RR 1:9Price broke the latest daily uptrend and it is testing it back. Looks like there might be a chance of some pullback on its way. Might execute short position entry if this 4HR candle gives some reversal signal. Trade carefully and cheers !

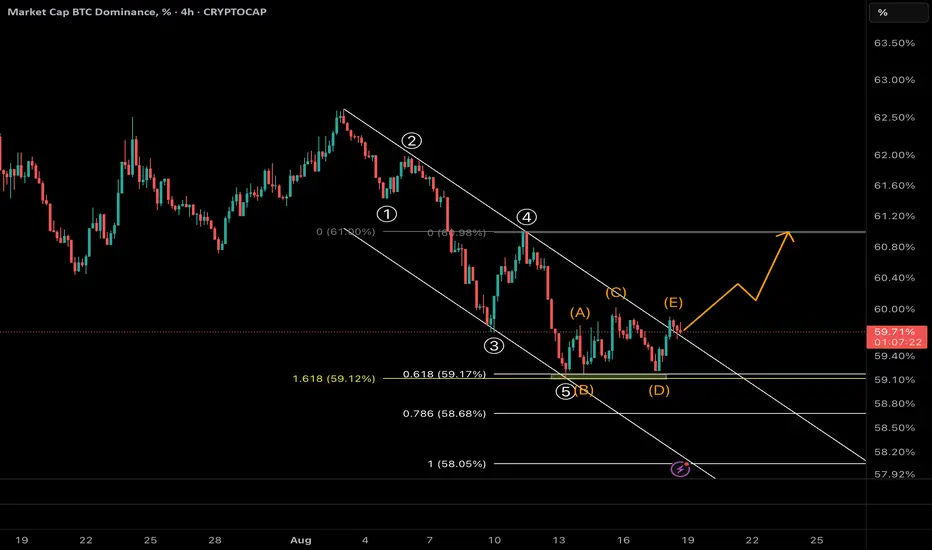
Bitcoin Dominance Breaks Out: Altcoins in Danger?🔎 BTC Dominance (BTC.D) – 4H Analysis
• The 5-wave decline has completed right at the 1.618 Fibonacci extension (59.1%), confirming a potential bottom.
• A contracting triangle (A–B–C–D–E) has formed and just broke to the upside, coinciding with the breakout of the descending channel.
⸻
📈 Main Scenario
• With this breakout, BTC dominance is entering a new bullish phase.
• Next targets:
• 60.8% – 61.0% (key Fibonacci resistance + channel top)
• If broken, possible extension to 61.4% – 62.0%
⸻
⚠️ Implications for Altcoins
• Rising BTC dominance usually means capital is rotating into Bitcoin → leading to heavy sell-offs in altcoins.
• Alt traders should be cautious: this move can trigger a broad correction across the altcoin market.
⸻
📉 Alternative Scenario
• If BTC.D falls back below 59.3%, the breakout may turn into a fakeout, and a retest of lower levels could follow.
⸻
✅ Conclusion:
The breakout above the descending channel is a strong signal of trend reversal. As long as BTC.D stays above 59.3%, the path toward 61%+ is favored. This could mark the beginning of a tough phase for altcoins.
Bitcoin dominance forming a falling wedgeIf we look closely at Bitcoin dominance, it has been sliding from 66% to around 59%, forming a textbook falling wedge. Normally, this is a bullish reversal pattern—and when it plays out, history shows it hurts altcoins the most.
Right now, there’s also a clear bullish divergence on RSI: while the dominance has been falling, momentum is actually climbing. This divergence often signals that a reversal is coming, and when Bitcoin dominance rises, it doesn’t hurt BTC much, but it usually triggers heavy selling pressure in altcoins.
At the same time, USDT dominance is showing signs of heading higher. When these two align—Bitcoin dominance moving up and USDT dominance ticking higher—it sets up a tough environment for alts. Money rotates into Bitcoin, stability is prioritized, and altcoins become the exit liquidity.
In short, the setup is hinting that Bitcoin dominance is preparing to move higher, which could trigger a rotation out of altcoins and potentially cause a sharp correction in the altcoin market. Traders should be cautious—what looks calm in the charts today may flip quickly once dominance breaks out of this structure.

Bitcoin (BTC): Physiology of Market Cycle | Belief PhaseBitcoin is about to explode and so is the whole market. We are in the "Belief" stage with our bull market, where BTC is getting more and more exposure on socials, with people being very bullish on the markets; people again started to believe.
That being said, with our multiple analyses, we have determined the last time that the current bull run will end in 2026 and seems like here is another confirmation for it.
Without saying more, be ready—markets will explode very soon. Stack your altcoins and get ready!
Swallow Academy

BTCUSDT (bitcoin) towards the $115kHello guys!
1-BTC broke the ascending channel
Bitcoin was moving inside an ascending channel, creating higher highs and higher lows.
Recently, it broke below the lower trendline of this channel, signaling weakness and a potential shift in momentum from bullish to bearish.
2-Engulfed the last low
After breaking the channel, BTC formed a strong bearish candle that engulfed the previous swing low.
This indicates that sellers are now in control, confirming bearish pressure in the market.
3-Current bias: Bearish with possible short entries
Despite the bearish sentiment, BTC may retest previous supply zones before continuing lower.
Two possible short entry scenarios are highlighted:
Scenario 1: Near 118,600 USDT
Scenario 2: Around 119,700 USDT
Both levels align with potential retracement areas where sellers could step back in.
4-Target
The downside target is around 115,800 USDT.
This zone coincides with previous demand/support, making it a logical area where price might find buyers again.

Bitcoin is correcting ┆ HolderStatKUCOIN:BTCUSDT on the 6h chart defended the 114,000 support with a double bottom, signaling bullish momentum. Consolidation patterns remain intact, with targets set at 120,000–124,000 if support continues to hold.

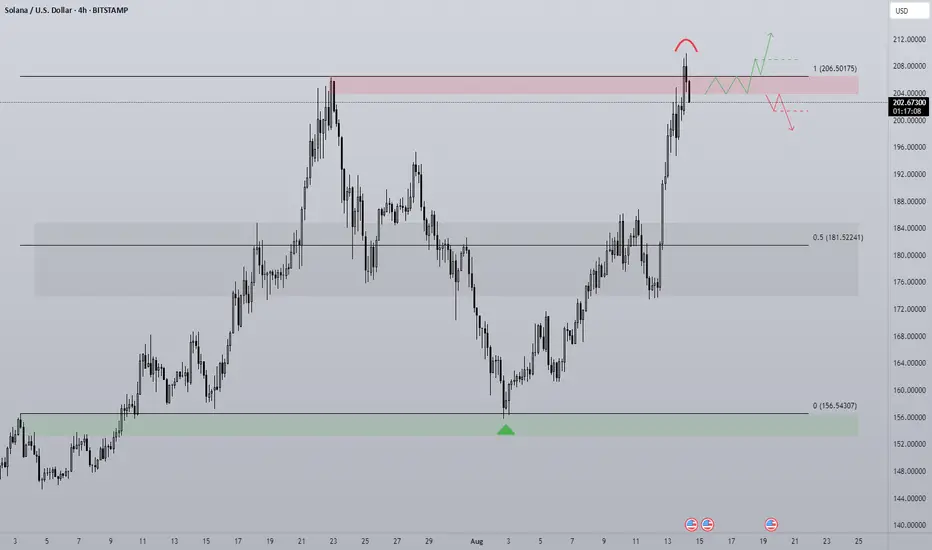
SOL - Breakout or Rangebound?For me this chart is quite simple with two options, a bullish and bearish scenario. SOL is currently rangebound but the massive momentum in the broader market has opened the door to a potential breakout of this trading environment.
To look at the context of the chart we has a clear push from the midpoint up to range high, very little in the way of pullbacks until price breaks up above the old local high. We know that generally stop losses hide behind a key high or low and so price trading into it with such momentum is something to note when entering a trade at this level.
Liquidations for SOL are currently 50:50 long and short and so this balance shows no clear liquidation event in one particular way, at least not yet.
Bullish scenario -
SOL continues the rally above the range, strong volume to confirm that price is ready to expand beyond the area that failed in the past. A retest of $206 with a strong bounce gives this move a higher probability and proof buyers are still willing to buy at the level. Idea is invalid should price accept back below the range high, signifying buyers are not ready to sustain rally continuation.
Bearish scenario -
Price accepts below range high and shows that buyers are not willing to expend beyond the range. Naturally a retreat would then follow as the bears defend the same point that they successfully defended in the past (range high). Any price action that resembles chop within the red box would be a non action area as there is an area of balance giving no clear clue of direction either way.
BTC 1H Analysis – Key Triggers Ahead | Day 15💀 Hey , how's it going ? Come over here — Satoshi got something for you !
⏰ We’re analyzing BTC on the 4-hour timeframe timeframe .
👀 On the 4H timeframe of Bitcoin, we can see that after breaking the $117,000 zone, Bitcoin faced strong selling pressure, which aligned with the Tokyo session open.
⚙️ The key RSI level is at 26. If this level is lost, Bitcoin could face even stronger selling pressure. The current RSI is around 30, which is marking a boundary for short-trade volatility.
🕯 Both trading volume and sell orders are increasing. With stronger selling pressure, Bitcoin could see a deeper correction.
💵 USDT dominance is getting heavier and forming green candles. However, the dominance is showing weakness in its upward trend. With strong support from USDT buyers, it could trigger a deeper correction across the broader market.
🔔 It’s better not to set alert zones yet, as Bitcoin is currently in a decision-making area, building a new structure. Once this new structure forms, our alert zones will become clearer.
❤️ Disclaimer : This analysis is purely based on my personal opinion and I only trade if the stated triggers are activated .

BTC 1H Analysis – Key Triggers Ahead | Day 14💀 Hey , how's it going ? Come over here — Satoshi got something for you !
⏰ We’re analyzing BTC on the 1-hour timeframe timeframe , we can see that Bitcoin is building a range above the $117,000 support level while trading with reduced volume.
👀 After breaking through the $118,000 zone (which acted as the midline of the range), Bitcoin has formed a consolidation just above $117,000. At the moment, it is ranging with a slight upward bias in the short term.
🕯 Trading volume and the number of transactions have decreased due to the weekend/holidays.
⚙️ On the RSI, the key resistance zone is 65.63. A breakout above this level could increase the probability of moving into overbought territory. On the other hand, losing the support zone around 37.82 could trigger selling pressure and push RSI into oversold territory.
🔔 Our alarm zones are set at $119,000 and $117,000. Breaking either of these levels could provide a trading signal. Monitoring price action around these zones will give clearer entries.
💵 Looking at USDT.D , we can see a 1-hour box range structure. It recently broke down from the bottom of the box. Now, the question is whether this decline will continue or if it will return inside the range.
🖥 Summary: Bitcoin is currently consolidating in a range with a slightly upward slope. However, due to the weekend, trading volume has dropped significantly, so any breakout needs confirmation with stronger liquidity.
❤️ Disclaimer : This analysis is purely based on my personal opinion and I only trade if the stated triggers are activated .

TradeCityPro | Bitcoin Daily Analysis #156👋 Welcome to TradeCity Pro!
Let’s go for the Bitcoin analysis. The weekly candle finally closed, and the market’s first move was bearish. Let’s see what’s going on today and what positions can be opened.
⏳ 4-Hour Timeframe
Yesterday Bitcoin made a DCB move and then broke the support zone it had formed.
🔔 Currently, Bitcoin has made a bearish leg and is now around the 115,318 zone. The selling volume that entered Bitcoin has been very high, and if this volume continues to increase, the probability of a move toward 112,233 will be higher.
✔️ If you remember, in previous analyses I told you that if the new weekly candle of Bitcoin opened green, the price could continue moving upward this week and the next bullish leg could start. On the other hand, if the candle opened red, then Bitcoin would probably range the whole week and the market wouldn’t show crazy volatility.
🔽 The bearish scenario happened yesterday, and in my opinion, the market will enter a deeper correction this week. However, I still think as long as the price is above 110,000, the trend remains bullish and the probability of continuation is higher than the trend being over.
🔍 For now, I’m not opening any new positions because the market structure is not very interesting, and based on my strategy, it doesn’t provide attractive setups. That’s why I’m focusing on my other tasks like journaling and managing my previous positions, while keeping an eye on the market in case conditions improve.
❌ Disclaimer ❌
Trading futures is highly risky and dangerous. If you're not an expert, these triggers may not be suitable for you. You should first learn risk and capital management. You can also use the educational content from this channel.
Finally, these triggers reflect my personal opinions on price action, and the market may move completely against this analysis. So, do your own research before opening any position.

The final stage for BTC Just what if....hard to adjust by timing! Because macro to much affect the sp500/ gold and crypto. But just an idea
Probably global plan about 139k like a top for Bitcoin still relevant in October / November BYBIT:BTCUSDT.P

18/08/25 Weekly OutlookLast weeks high: $124,475.68
Last weeks low: $116,828.03
Midpoint: $120,651.85
Another new ATH for BTC but are there signs of weakness beginning to show?
Last week Bitcoin hit a new ATH just shy of $124,500, a remarkable achievement but the reaction from that level to me is not a good one. Using the RSI indicator it is clear that on the daily time frame both the July top and now the most recent top form a bearish divergence. Higher time frame bearish divergences are strong trend reversal indicators. On the hour timeframe both tops also formed a local bearish divergence, to me this is a double sign of an exhausted rally.
This is not to say the end of the cycle is here by no means, what it does suggest is that the bulls are tired and a correction could be round the corner. From here I think logically the $111,000 & $108,000 levels could provide support this week on any pullback continuation. From a macro perspective we still have rate cuts to come next month, An ever growing M2 Global Money Supply to feed the market and a hungry institutional investor race to acquire digital assets. All this points towards the bullaun continuing but In my opinion after a cooling off period, after all August and September are famously bad months for BTC for returns.
Ethereum on the other hand continues to impress this a record $2.85B ETF net Inflows. $3.75B net inflows for digital assets as a whole. No break of ATH as yet but the momentum is certainly there. BTC will need to stand strong for ETH to push past $4,800.
This week I'm keeping a close eye on how BTC reacts to any pullbacks, judging market order flow to see if this is a shallow pullback or maybe a prolonged one that results in a rangebound environment.
FED chair Powell does speak this week so possible volatility should he announce anything significant.
Good luck this week everybody!

BTC Deep Pullback Could Offer Strategic Long Opportunity Bitcoin📊 Bitcoin remains in a strong bullish trend on the higher timeframes 📈, which is clear on the weekly chart. However, we’ve recently seen an aggressive BTC selloff on both the daily and 4H charts 🔻. Price is now moving into key support zones, trading through a prior accumulation range visible on both the daily and 4H 🏦. This zone represents a significant liquidity pool, where Bitcoin may potentially find support. I’ll be watching closely for a bullish break of market structure on the 1H ⏰ — that would be my trigger for a potential long setup 🚀. This could present an opportunity to capitalize on a deep pullback within a bullish trend 💡 (not financial advice).

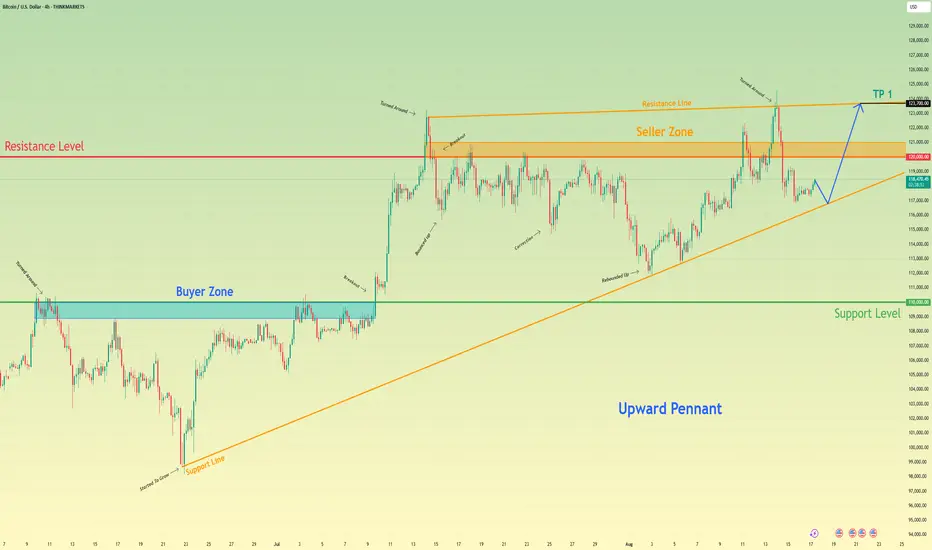
Bitcoin may bounce up of support line and break resistance levelHello traders, I want share with you my opinion about Bitcoin. Following a powerful upward trend and a significant breakout, bitcoin has established a new and higher territory for its price action, leading into the current phase of extensive consolidation. This consolidation has taken the form of a large upward pennant, a classic pattern of contracting volatility where the price is being squeezed between a descending resistance line and an ascending support line. The market has been rotating within these boundaries, with the seller zone around the 120000 resistance level capping rallies and the dynamic support line providing a floor for pullbacks. Currently, the asset is positioned at a critical juncture, testing the ascending support line of this multi-week formation after a corrective move down. The primary working hypothesis is a long scenario, based on the expectation of a successful upward rebound from this dynamic support. A confirmed bounce would validate the integrity of the pennant and suggest that another full rotation to the upside is the most probable path. This move would first challenge the horizontal resistance at 120000. Therefore, the ultimate TP for this rotational play is logically set at the 123700 level, as this precisely targets the upper resistance line of the pennant, representing the completion of the swing and a key decision point for a potential future breakout. Please share this idea with your friends and click Boost 🚀
Disclaimer: As part of ThinkMarkets’ Influencer Program, I am sponsored to share and publish their charts in my analysis.
BITCOIN Below its 1D MA50. Is there any Support?Bitcoin (BTCUSD) broke today below its 1D MA50 (blue trend-line) for the first time since July 02, having previously rebounded on it (August 02) on a perfect technical bounce that delivered a new All Time High (ATH).
Naturally, the 1D MA50 is the first medium-term line of Support and last time it broke convincingly, the price found a bottom (June 22) closer to the 1D MA100 (green trend-line). That was during BTC's previous Accumulation Phase of the 4-month Channel Up.
If that pattern is repeated, then Bitcoin's next Support could be within 112000 - 111000. On top of that, it would be useful to keep an eye on the 1D RSI, which is printing a pattern similar to he previous Accumulation Phase that bottomed on the 39.00 level.
As far as the next High is concerned, if it repeats the +22.72% rise that the previous Bullish Legs delivered from the 1D MA50 contact, then we're potentially looking at $137000 as the pattern's next Higher High.
So what's your view? Do you think the 1D MA100 will come to BTC's rescue and push it to $137k? Feel free to let us know in the comments section below!
-------------------------------------------------------------------------------
** Please LIKE 👍, FOLLOW ✅, SHARE 🙌 and COMMENT ✍ if you enjoy this idea! Also share your ideas and charts in the comments section below! This is best way to keep it relevant, support us, keep the content here free and allow the idea to reach as many people as possible. **
-------------------------------------------------------------------------------
💸💸💸💸💸💸
👇 👇 👇 👇 👇 👇

Bitcoin - Will Bitcoin Continue to Rise?!Bitcoin is below the EMA50 and EMA200 on the four-hour timeframe and is in its long-term ascending channel. If it moves upwards, we can look for a short-term position to sell Bitcoin from the specified supply zone.
It should be noted that there is a possibility of heavy fluctuations and shadows due to the movement of whales in the market and compliance with capital management in the cryptocurrency market will be more important. If the downward trend continues, we can buy within the demand range.
Momentum in the digital assets market continues to accelerate, with Ethereum leading the charge. The cryptocurrency has surged from $1,500 in April to $4,300, marking its highest level since December 2021 and standing only 12.5% below its all-time high of $4,800. Historically, Ethereum has served as a leading indicator for the broader altcoin market, and its recent strength has fueled speculative activity across other higher-risk assets.
This capital rotation is also reflected in the Bitcoin Dominance index, which measures Bitcoin’s share of the overall crypto market. Over the past two months, Bitcoin’s dominance has fallen from 65% to 59%, signaling a continued flow of capital into riskier assets.
Last week, Scott Bessent, U.S. Treasury Secretary, announced that Bitcoin seized by the federal government would form the core of the nation’s strategic Bitcoin reserves, established under President Trump’s March executive order. He further noted that the Treasury is exploring budget-neutral options to acquire additional Bitcoin, aligning with the administration’s commitment to making the United States the “world’s Bitcoin superpower.” He clarified that no new cryptocurrencies would be purchased, as the reserves will rely solely on confiscated assets.
Meanwhile, the balance held by Accumulator wallets—addresses that exclusively buy Bitcoin and never sell—has reached 308,150 BTC, the highest level ever recorded. Continued accumulation by these wallets implies a tightening supply in circulation and is often seen as the beginning of a new bullish phase in the market.
In parallel, Bit Digital, a Nasdaq-listed company, reported a net profit in Q2 of this year despite a decline in overall revenue. This shift came as the company focused on its new treasury and Ethereum-based staking strategy.
According to its quarterly report, Bit Digital generated $25.7 million in total revenue during the period, representing an 11.7% year-over-year decline. The company attributed the decrease primarily to reduced income from digital asset mining, as operations shifted toward treasury and Ethereum staking initiatives, though part of the drop was offset by growth in other business segments.
During the same quarter, Bit Digital posted $14.9 million in net profit, equal to $0.07 per share, compared to a net loss of $12 million in the same period last year. CEO Sam Tabar described the quarter as “the beginning of the company’s transformation into a specialized Ethereum treasury and staking platform.” In June, Bit Digital formally announced its Ethereum strategy and began the gradual phase-out of its Bitcoin mining operations.
According to Yahoo Finance data, Bit Digital’s stock fell 0.63% on Thursday to $3.19. However, despite the daily decline, the stock has risen 8.1% over the past five days and is up 8.9% year-to-date.

114-114.50K is Vital in short-termMorning folks,
So, potential patterns that we discussed last time even had no chances to be formed, market just collapsed. It is not a surprising moment. In our weekly reports we paid a lot of attention to the US liquidity as a main fundamental driving factor. The maths here is very simple 1+Trln borrowing in 2 months. It is yet to borrow net ~250-300 Bln, while RRP liquidity source is exhausted already. Additionally US Treasury need to accumulate 300 Bln more on its TGA account. All this liquidity will be drained from the market. BTC will be under direct impact of this stuff.
Now 114 K support area seems vital in short term. We intend to watch for patterns around it and week close price. If BTC drops lower, next area to watch is 110-111K support. I do not want to speak what will happen if it will be broken, but don't exclude retracement back to 70-80K area in this case.
To remind you we still have all-time 127K target. At least following normal technical behavior, I hope that BTC will try to reach it first, before collapse will happen. This is the reason of our special attention to 114K support.

Bullish continuation for the Bitcoin?The price is falling towards the pivot which acts as an overlap support and could bounce to the 127.2% Fibonacci resistance.
Pivot: 111,783.38
1st Support: 98,421.14
1st Resistance: 126,406.21
Risk Warning:
Trading Forex and CFDs carries a high level of risk to your capital and you should only trade with money you can afford to lose. Trading Forex and CFDs may not be suitable for all investors, so please ensure that you fully understand the risks involved and seek independent advice if necessary.
Disclaimer:
The above opinions given constitute general market commentary, and do not constitute the opinion or advice of IC Markets or any form of personal or investment advice.
Any opinions, news, research, analyses, prices, other information, or links to third-party sites contained on this website are provided on an "as-is" basis, are intended only to be informative, is not an advice nor a recommendation, nor research, or a record of our trading prices, or an offer of, or solicitation for a transaction in any financial instrument and thus should not be treated as such. The information provided does not involve any specific investment objectives, financial situation and needs of any specific person who may receive it. Please be aware, that past performance is not a reliable indicator of future performance and/or results. Past Performance or Forward-looking scenarios based upon the reasonable beliefs of the third-party provider are not a guarantee of future performance. Actual results may differ materially from those anticipated in forward-looking or past performance statements. IC Markets makes no representation or warranty and assumes no liability as to the accuracy or completeness of the information provided, nor any loss arising from any investment based on a recommendation, forecast or any information supplied by any third-party.

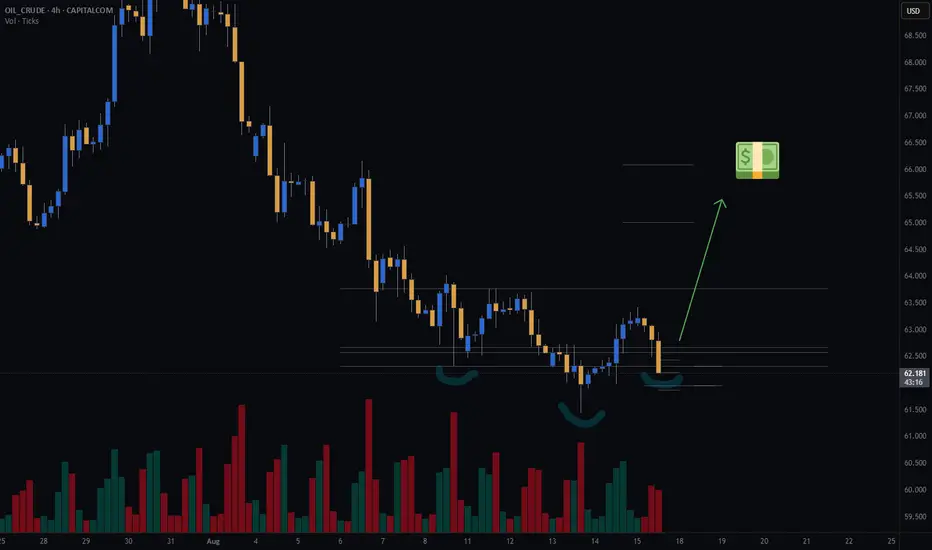
Oil - Potential long with inverse and shouldersWatching Oil for a potential long entry. There appears to be an inverse head and shoulders forming on the 4-hour chart.
If the 4-hour candle closes within the expected range and 3 of my other variables are met, I’ll consider entering a long position.
Trade Details:
📊 Risk/Reward: 3.8
🎯 Entry: 62.658
🛑 Stop Loss: 61.941
💰 Take Profit 1 (50%): 65
💰 Take Profit 2 (50%): 66.08
#GTradingMethod Tip: Predefine and accept your risk before entering a trade.
Thanks for checking out my post! Make sure to follow me to catch the next update. If you found this helpful, give it a like 👍 and share your thoughts 💬 — I’d love to hear what you think!
Please note: This is not financial advice. This content is to track my trading journey and for educational purposes only.