BTC AnalysisAfter breaking out its uptrend line, Bitcoin is completing the pullback to its trend line, while with the formation of an increasing angle pattern in the same direction with the main trend, we are witnessing fatigue in the trend. There is a possibility that the price will drop to the range of 41 to 43 thousand dollars.
BTC-D

Will Bitcoin goes for 14500? WeeklyThis is the last analysis's weekly time frame chart.
Everything is clarified in the chart you can see upgoing and downgoing cycles after every bitcoin halving.
RSI had a downward breakout the red RSI trend line named T1 and pull backed to it in the weekly timeframe where you can see a little red rectangle and arrow there. The continuation of the RSI path is probably like the blue line drawn named R1.
About the BTC price, I am expecting the price to reach 14500 - 19000 dollars until Dec 2022. of course, it can reach that target a few months earlier or late.
Note that before Halving 2024 bitcoin will not have ATH. It means before Apr 2024 bitcoins price will be under the 69000 and even maybe 50000 dollars. After that time the price will go to 120000 dollars.
Do not forget that the trend of the bitcoin and crypto market is still downward and bearish.
You can see my idea about this analysis in a monthly time frame in another published idea on my profile page.

Bitcoin Recovery Setup: BTC Price Rebound Signal & Trade IdeaHey traders.
Short update for BTC and next movement.
Basically we moving in the bullish flag and according to some signals most-likely we going to see BTC going to the top of this channel.
Few reasons:
1) RSI crossed and confirmed (red circle marked)
2) Recovery of the whole market
Points to watch:
1) Low volumes - seems like we not going to break much this flag range (be careful)
2) Money can flow to altcoins - so BTC going to flat
If you want to trade, set up TP at the price around orange line and follow RM.
Share your insights in the comments

GBPUSD Rising.GBPUSD making Higher Highs and Higher Lows and moving nicely UP in the Channel. Possible continuation in the Channel or a Spike and a BreakOut in London Session or going to NY session.

BTCUSDT.P - November 10, 2025BTCUSDT.P is currently consolidating near the $106,300 area, showing potential for a short-term bearish retracement. A rejection from this zone could trigger a move lower toward the $105,440 support and the $104,300 profit level (short). However, a decisive breakout and close above $106,660 would invalidate the short setup and open the path for a continuation higher toward the $108,280 profit level (long).

BITCOIN Did the 1W MA50 just save the day again?Bitcoin (BTCUSD) just closed last week above its 1W MA50 (blue trend-line) even though it broke below it during the day.
Since the March 13 2023 break-out above the 1W MA50, this is the 4th time that BTC breaks below it but manages to close the 1W candle above it. All of those times (including the additional one of September 11 2023), marked market bottoms, Higher Lows for the 3-year Channel Up and initiated the Bull Cycle's strong rallies.
However every rally has been weaker and since the first one topped in March 2024, we have a huger Bearish Divergence on the 1W RSI of Lower Highs against BTC's Higher Highs, showcasing loss of strength for the trend. A natural feat however, as the Bull Cycle tends to be stronger on its start as it rebounds violently from the market bottom and less strong towards the end as it matures and big positions already start to take profits.
But is this the end of the Cycle? The 4-year Cycle Theory, the DXY bottoming, the 1W RSI Bearish Divergence among others, all say 'yes'. But the Bear Cycle can only be technically confirmed when the market closes that 1W candle below its 1W MA50 and so far it hasn't. Is that enough to rely your strategy on from this point onwards?
So has the 1W MA50 just saved the day again for Bitcoin? Feel free to let us know in the comments section below!
-------------------------------------------------------------------------------
** Please LIKE 👍, FOLLOW ✅, SHARE 🙌 and COMMENT ✍ if you enjoy this idea! Also share your ideas and charts in the comments section below! This is best way to keep it relevant, support us, keep the content here free and allow the idea to reach as many people as possible. **
-------------------------------------------------------------------------------
💸💸💸💸💸💸
👇 👇 👇 👇 👇 👇

BTC to pump againif BTC can break above the resistance at 108k and the falling wedge then pump should be fast

Bitcoin Daily Outlook: Support and Resistance in FocusHey Guys,
Looking at Bitcoin on the daily chart, the 105,000 to 98,000 levels are strong support zones. This means that as long as the price does not fall below these levels, a sharp decline in Bitcoin is unlikely.
The price touches these areas, but whales prevent it from breaking lower with strong buying, pushing it back up again.
The 113,000 – 116,000 levels are strong resistance zones.
As long as Bitcoin does not fall below 98,000, my target remains 113,000.
Currently, Bitcoin is trading at 105,887. Once my target is reached, I will provide updates.
Every single like I receive from you is my greatest motivation to share these analyses. I sincerely thank everyone who supports me with their likes.🙏

Crucial level for $BTCFor CRYPTOCAP:BTC I'm watching this $108,000-109,000 level for a reaction
Very bullish if the weekly reclaims and closes above, however we are very early in the week to talk about this scenario

We are NOT finished.Weekly close has come in and, as expected, BTC has closed above the band once again.
Since the start of this cycle, Bitcoin has had the following pullbacks:
September 2023: 21%
August 2024: 34%
April 2025: 33%
November 2025: 21%
Tell me, people—what has changed? Has Bitcoin done anything different from what it’s been doing all cycle?
NO!
Yet 95% of sentiment is extremely bearish. The other 5% who aren’t bearish are patting themselves on the back because they “called the top”—you know, the same “top” everyone is staring at, the same top that can be calculated using basic math from the last two cycles.
Since I joined this space, I have NEVER seen sentiment this bad after only a 20% pullback. Complete madness. The only time I saw emotion this raw was during the COVID crash.
This level of bearish sentiment is what you find at the BOTTOM of rallies, not the top.
The idea that the top is in just because of “cycle length” is invalid—especially when EVERYONE is thinking the exact same thing. It’s never that easy with Bitcoin.
Mark my words: it WILL rally above 200k in 2026, and everyone who sold this year will be buying back in higher. That’s the nature of these markets.
Every cycle, you have to stay grounded, stick to the technical data, and ignore all the noise.
The technical are still holding strong—we are NOT finished!

BTCUSD: Bulls Eye Recovery Toward $104K Resistance ZoneHello everyone, here is my breakdown of the current Bitcoin setup.
Market Analysis
BTCUSD is currently showing signs of a potential bullish recovery after bouncing from the key $100,600–$101,200 Support Zone, which aligns with the Wedge Support Line on the chart. This area has acted as a Buyer Zone multiple times in the past, with each test triggering strong upward reactions. The recent fake breakouts below support suggest liquidity sweeps and show that sellers have been unable to sustain momentum to the downside.
Currently, price was moving within a falling wedge structure, reflecting a controlled corrective decline. Throughout this move, several fake breakouts occurred along both boundaries of the wedge, indicating seller exhaustion and possible accumulation by larger buyers. After touching the Support Zone again, BTCUSD formed a bullish reaction, signaling a shift from selling pressure to buying interest. BTCUSD is now approaching the $103,500–$105,000 Resistance Zone, which previously acted as a strong supply level where corrective upswings were rejected. This zone also aligns with the Wedge Resistance Line, making it a key decision area for the next directional move. If buyers can sustain momentum above support, the market may set up for a continued bullish recovery.
My Scenario & Strategy
As long as BTCUSD holds above the $100,600–$101,200 Support Zone, the bullish recovery outlook remains intact. I expect price to continue moving gradually higher toward the $103,500–$105,000 Resistance Zone as the next key target. A confirmed breakout above $105,000 and sustained holding would signal a shift in structure, potentially opening the path toward $110,000 in the medium term.
However, if price breaks back below the Support Zone, the bullish setup becomes invalid and BTCUSD may revisit deeper support levels before any new recovery attempt develops. For now, structure favors bullish continuation, and pullback-based long entries remain the most favorable approach while support holds.
That's the setup I'm tracking. Thank you for your attention, and always manage your risk.

WATCHING FOR CLOSE PRICE TODAYMorning folks,
So, pullback to 106K area has happened rather accurately. D. Trump once again has made a verbal intervention with promise of 2K and shutdown end, but this is too early to believe. As usual no one D. Trump promise has made a long lasted effect. All of them were reversed in a few days.
No Supreme Court decision yet on tariffs, now it is appeared that it will be not a 2K in cash but just tax adjustment, shutdown is still lasting and liquidity issues remain. So, I would say - it is too early to celebrate.
Meantime, on technical side we have clear signals. First is, if market will close today under 105.5K - we get daily bearish grabber. As you can see on 4H chart - it will appear right around strong resistance area. So, it might happen, that we will have to go short instead as market could drop again under 100K area...
Thus don't relax and don't believe in this suspicious euphoria, everything could change in a blink of an eye. Still, upward action above 108K could confirm the bullish sentiment.

#BTC Time to Buy ?!I believe We could have another downside move , and then we can have a buy position on it as Scalp . for 6-15%
Added in watchlist .

BTCUSDTBTCUSDT price is in the key support zone 100025 - 99036. If the price cannot break through the 98491 level, it is expected that the price will rebound. Consider buying the red zone.
** Very Risky Trade
🔥Trading futures, forex, CFDs and stocks carries a risk of loss.
Please consider carefully whether such trading is suitable for you.
>>GooD Luck 😊
❤️ Like and subscribe to never miss a new idea!

No soup for you, come back 1 yearif this 35 bar monthly cycle holds up like it has in the 2 previous cycles, top is in. I was expecting a better performance out of btc this cycle but my bias has changed as we have reached q4. the monthly 50 simple moving average aligns with the top of the previous cycle putting btc at a low of around 70k in the coming year.
3 years up, 1 year down, rinse and repeat.
let me know what you think will happen. is it different this time around? or is pattern about to repeat?

Altcoins are loading. BTC Dominance is in a downward retest following the recent breakout.
ETH/BTC confirmed its upward breakout.
The apparent silence is actually the sound of an impending power shift.
CRYPTOCAP:BTC.D vs. BINANCE:ETHBTC

$BTC Possible TOP / Manipulation & then Distribution?Accumulation - Manipulation - Distribution
3 phases, and the manipulation part may be coming..

$BTC Monthly ViewWe are at the very beginning of the bear market.
Even if we have a 2nd Manipulation (NEW ATH), that's not necessarily happening, as we've already grabbed the liquidity but know that new ATH will not change the analysis.

$BTC Same zone. Same faith.Bitcoin is once again holding at the VWMA and SMA13 support on the monthly chart.
From past to present, the trend has never changed unless these supports were broken.
As long as monthly closes stay up...
Everything else is just noise.

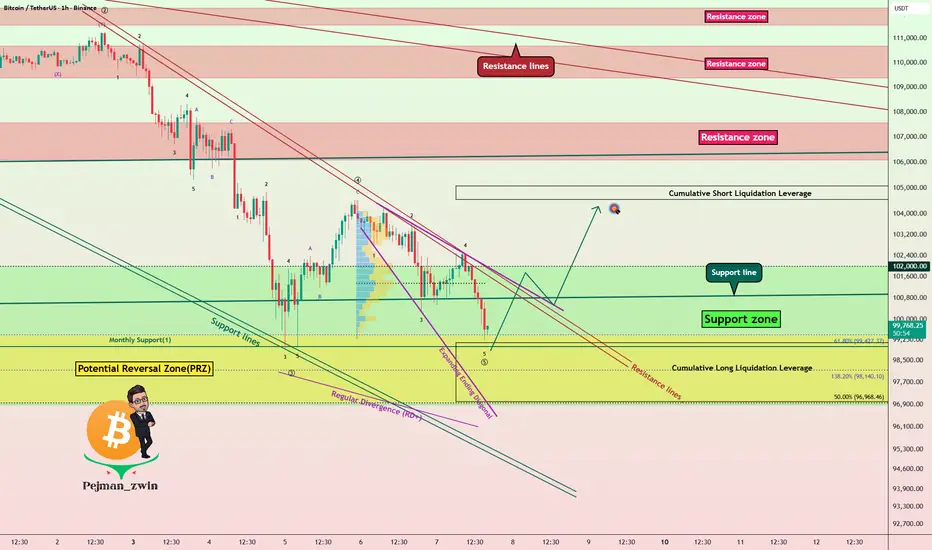
Bitcoin Bulls Defending $97K – Reversal Loading!Before diving into the Bitcoin analysis , it’s worth noting that Bitcoin has had a strong correlation with the SPX500 index ( SP:SPX ) in recent weeks. So, alongside analyzing Bitcoin, it’s a good idea to keep an eye on the SPX500 chart these days.
Currently, Bitcoin( BINANCE:BTCUSDT ) is moving in a Support zone($10200,980-$96,880) near a Potential Reversal Zone(PRZ) and a Cumulative Long Liquidation Leverage($99,145-$97,208) .
From an Elliott Wave perspective, it looks like Bitcoin is forming an Expanding Ending Diagonal to complete the microwave 5 of the main wave 5 .
Also, we can see a Regular Divergence(RD+) , which is a good sign of a potential reversal.
Given my expectation that the SPX500 Index will start to rise again, I also expect that Bitcoin will follow suit and could climb at least to around $104,200 .
Cumulative Short Liquidation Leverage: $105,074-$104,551
Stop Loss: $96,178
Please respect each other's ideas and express them politely if you agree or disagree.
Bitcoin Analysis (BTCUSDT), 1-hour time frame.
Be sure to follow the updated ideas.
Do not forget to put a Stop loss for your positions (For every position you want to open).
Please follow your strategy and updates; this is just my Idea, and I will gladly see your ideas in this post.
1980 Redux? SILVER set to Outshine the NYSE Composite.Has Silver set the stage to approach its all time high's versus the "Big Index" that was last seen close to 50 years ago.?
Why this chart is spectacular:
Silver has moved sharply higher this year, breaching it's historic $50 threshold, a feat last seen in 1980 and 2011.
Notable the Silver/US Equities ratio (using the TVC:NYA as a broad proxy) is forming a multi year bottom structure. Suggesting we are in the process of a powerful repricing from equities to commodities.
This is not a crash call on Stocks.
Simply put Metals and commodities are just likely be faster horses and receive higher capital allocations.
We've seen the Big short during the GFC.
We've seen Saylor's Big long trade on #BTC
is Silver the Big Reversal?

Bitcoin at a Decision Zone – Day 1👋🏻 Hey everyone! Hope you’re doing great! Welcome to SatoshiFrame channel.
✨ Today we’re diving into the 1-Hour BITCOIN analysis. Stay tuned and follow along!
🪙 Bitcoin on its one-hour timeframe is currently within a trading range, and due to the holidays, both volume and volatility have dropped to their lowest levels. According to the analysis, an important resistance has formed around $103,912, and a micro buyer support around $100,288. Once either of these zones is broken, Bitcoin could provide a trading opportunity.
📊 Bitcoin’s volume on the one-hour timeframe has now reached its lowest level, indicating that we are close to a potential move. This suggests possible upcoming volatility. As for the micro buyer floor, this level is crucial for buyers — when price reaches it, buying volume typically increases. To break this zone, it would require significant selling volume and large whale candles to overcome the long-biased traders.
🧮 My favorite oscillator, RSI, is also ranging between 30 and 70, which nicely overlaps with the identified support and resistance levels. A breakout from these RSI limits can confirm our risk level and validate potential trade entries.
✍️ You can read the possible scenarios for this trading range below. If needed, set your alert zones and use them accordingly. Don’t forget proper risk and capital management.
↗️ Long Position Scenario: A breakout above $103,912, accompanied by an increase in buying volume, would validate a potential long setup. This volume increase should also align with the oscillator, meaning RSI should break above 70 on the 1-hour or 15-minute multi-timeframe chart, along with increased market volatility.
📉 Short Position Scenario: A breakdown below the micro buyer floor at $100,288, with selling pressure and RSI falling below 30, could confirm a short position. However, it’s recommended to wait for a pullback after the breakout before entering the trade.
❤️ Disclaimer : This analysis is purely based on my personal opinion and I only trade if the stated triggers are activated .

#DAX at a record ALL TIME HIGHand Yet this move is far from over
My final log target is still 8000 points away.
We are witnessing #Fiat melt away in front of our eyes.
Are you actually making money is the real question?
#gold #silver #bitcoin
