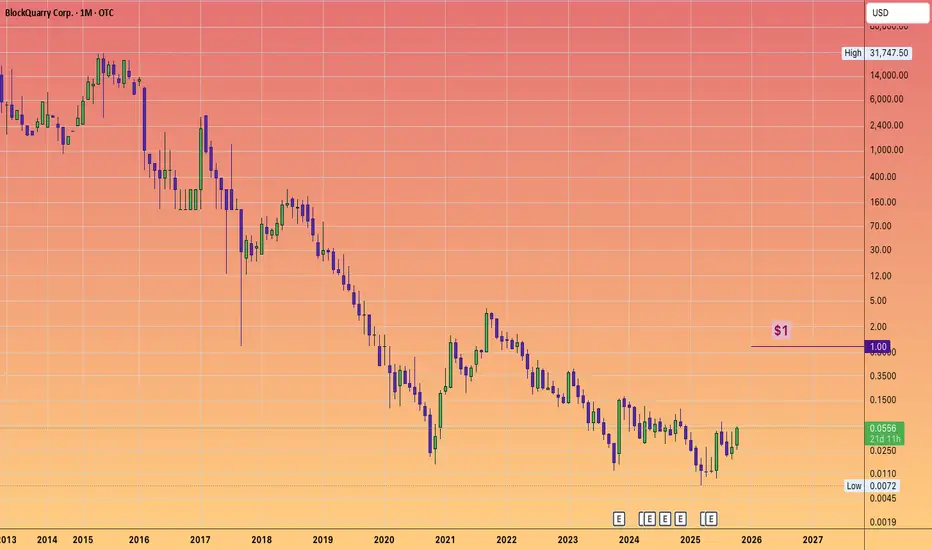
$BLQC Pink sheet stock can 20X --- BLOCKQUARRY CORP.What is it?
BLockQuarry has transitioned from pure #Crypto mining to advanced #AI data storage and HPC, tapping into high growth industries projected to reach $190 Billion for AI and $110B for HPC in the next several years.
The firm is leveraging state of the art data centers and infrastructure upgrades, focusing on scalable solutions for industries like Healthcare, finance and retail.
Financial Analyst forecasts:
Analysts have an average price target of $1.06 to $1.72 by late 2025!
Improved operational stability and freeing resources for expansion and debt reduction. A strengthened leadership team and new CEO with expertise in digital assets and operational growth in AI and HPC.
It's proprietary product BLQCBuster a US manufactured ASIC Bitcoin, features a modular chip architecture that enables superior mining capability per node. Which is meant to advance both performance and supply chain independence.
BTC-D
eth\btcThe Ethereum / Bitcoin pair is showing a pattern quite similar to that seen in 2019.
The price received a strong reaction from the demand zone and is currently in a falling trend retest process.
If it manages to stay above this zone, the first target will be the mid-level supply zone, followed by the major supply zone (0.08 BTC).

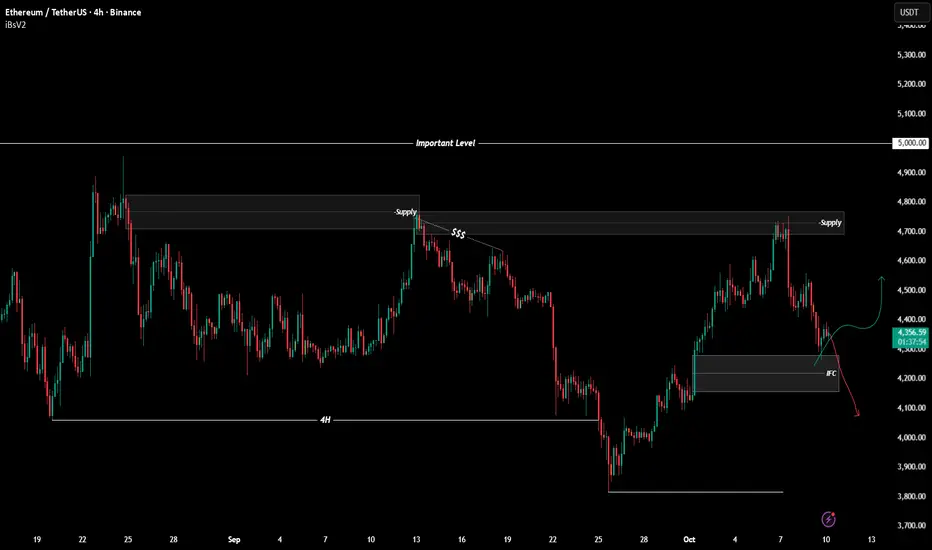
$ETHUSDT Analysis - Oct 10 | 4H Time FrameBINANCE:ETHUSDT Analysis - 4H
Hello and welcome to another analysis from the Satoshi Frame team!
I’m Abolfazl, and today we’re going to analyze Ethereum on the 4-hour timeframe.
After rejecting from the supply zone, Ethereum has reached an IFC, which could cause a price pullback.
On the 15-minute timeframe, look for confirmation signals to enter a long position — the first target is around $4,520, followed by $4,750.
Keep in mind that this setup is very risky, and no entry should be taken without proper confirmation.
The second scenario is a break below $4,200, which could provide a short opportunity targeting $3,950, and then the 4H low. (The break must be confirmed by a full candle close, not just a shadow.)
These scenarios allow you to align with price movement in both directions — the key is to wait for precise confirmations before entering any trade.
See you in the next analyses!
Stay tuned with the Satoshi Frame team...
$BTCUSDT Analysis - Oct 10 | 4H Time FrameBINANCE:BTCUSD Analysis - 4H
Hello and welcome to another analysis from the Satoshi Frame team!
I’m Abolfazl, and today we’re going to analyze Bitcoin on the 4-hour timeframe.
Bitcoin’s current all time high stands at $126,199!
Price has tapped into a demand zone, which could potentially trigger a bullish move toward this high.
This zone is worth the risk, and it’s recommended to look for buy positions on the 15-minute timeframe, targeting $130,000.
See you in the next analyses!
Stay tuned with the Satoshi Frame team...

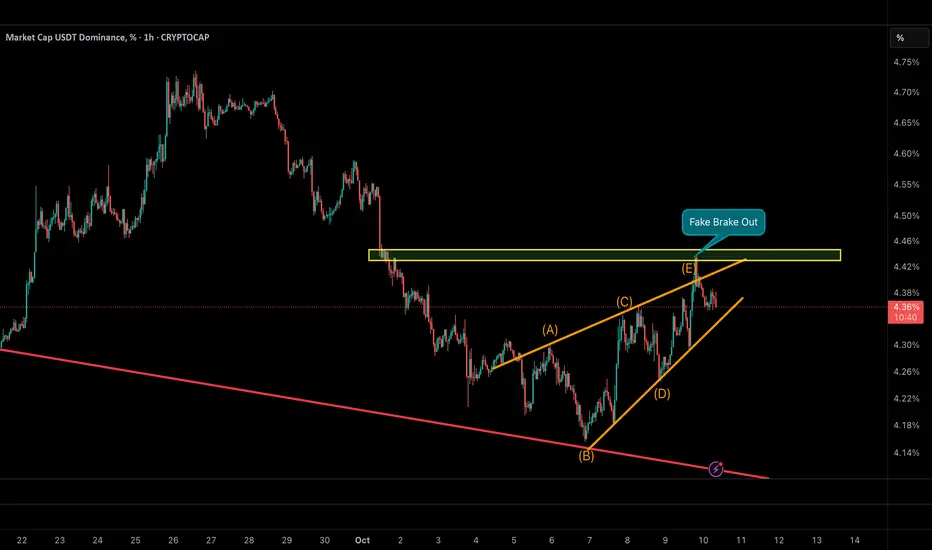
USDT Dominance – Fake Breakout Signals a Potential Altcoin ShiftUSDT Dominance has completed a contracting wedge pattern (A–B–C–D–E), followed by a fake breakout above the key resistance zone near 4.45%.
This move likely trapped late buyers of USDT at liquidity highs.
As long as dominance remains below 4.35%, the probability of a deeper decline toward 4.15–4.20% increases —
which could mark the beginning of capital rotation into altcoins.
In contrast, a confirmed breakout above 4.46% would invalidate this setup and suggest a new sideways phase.
📉 Base Scenario: Continuation of decline toward 4.15–4.20%
🚀 Implication: Growing probability of an upcoming Altseason
ETH Game Plan – DLRMD ModelETH Game Plan – DLRMD Model
📊 Market Sentiment
The FED has resumed its rate-cutting cycle with a 0.25% cut in September and two more expected in the coming months. Institutional liquidity inflows are accelerating as the U.S. officially adopts crypto as part of its reserves. While inflation remains elevated, a weakening labor market is pushing the FED to ease, channeling more capital into risk-on assets such as crypto.
📈 Technical Analysis
ETH ran the weekly swing low and closed above, signaling a shift in structure. A strong daily structure break followed, forming a fresh daily demand zone. The first tap into this demand zone resulted in a solid rejection — confirming its validity.
Afterward, price briefly deviated above the lower time frame bearish trendline, then retraced back, showing potential accumulation before the next leg up.
📘 Model to be used – HTF Demand w/ Liquidity Run & Max Discount Zone (DLRMD Model)
1-Identify the HTF trend and take setups only in that direction.
2-Mark the active HTF demand zone.
3-Confirm liquidity sweep within that zone.
4-Use Fibonacci retracement to locate the 0.75 max discount area.
5-Wait for LTF confirmation before entering.
📌 Game Plan
I’ll be waiting for price to return and retest the daily demand zone, ideally running the 12H swing liquidity at $4,090 and tapping the 0.75 max discount zone around $4,050 before considering entry.
🎯 Setup Trigger
4H structure break confirmation after price taps the $4,050 level.
📋 Trade Management
Entry: $4,050 (expected zone)
Stoploss: Below the 4H swing low that breaks structure
Targets:
TP1: Bearish trendline retest (≈$4,445)
TP2: All-time high (≈$4,965)
Once TP1 is reached, I’ll move stoploss to breakeven and manage partials actively.
💬 Like, follow, and comment if this breakdown supports your trading! More setups and market insights coming soon — stay connected!
⚠️ Disclaimer: This content is for informational and educational purposes only and does not constitute financial, investment, or trading advice. Always DYOR before making any financial decisions.

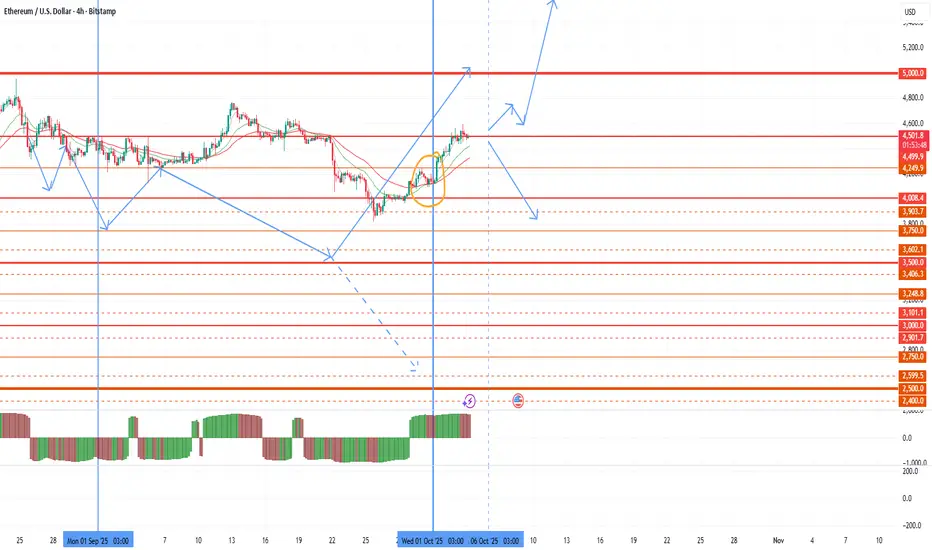
A dangerous market on the swing of a new quarterSeptember ended, a month of seasonal sales and 4 weeks of sluggish market decline, which I predicted in the last review. October and December are the months of seasonal growth in the 4th quarter, but the bears continue to hold the market. The quarter opened neutrally on the ETH. An opening above 4100 provides an opportunity for retests of 4750-5000, however, an opening below 4250 is a slightly stronger signal for a stable consolidation below 4k and an attempt to retest 3500. The current market growth is still only a retest of the 4500-4750 range before the likely continuation of sales. It will be possible to talk about the continuation of medium-term growth only with a repeated breakdown of 4750, in which case active purchases of altcoins will begin. With the current market, the probability of a further flat and a slow fall for most coins prevails. Bitcoin opened the quarter below 115k, which further increases the likelihood of a market drop with sales up to a 90-100 k retest.
The oil price also continues to fall, which negatively affects the markets. If there is a rebound in brent to $67.5-$69 in the new week, then the probability of a breakdown of $ 4750 in ether will begin to prevail. If brent falls below 64, there will be a chance of a hike to 3900 on the ETH by the end of next week.
Today, the opening level of the new week on the ETH is of great importance. When opening above 4500, the probability of a breakdown of 4750 will increase significantly and we will not see sales below 4250-350. When opening below 4500, a breakdown of 4750 will be possible only against the background of weighty arguments, extremely negative statistics on the United States or oil growth.
With the current negative market and the prevailing probability of further altcoin decline, I am still cautiously considering coins for operation. The only oversold group with the probability of growth from its current position is still the fantokens. Among them, I am considering atm city juv acm for work. These tokens do not have binance futures, which reduces the opportunities for large speculators to sell and insures against a pattern similar to alpine and asr. These tokens also have extremely high undeveloped targets on large timeframes up to 5-7 x.
ATM opened the quarter above 1.5, which is a very positive signal. After drawing the shadow on a new monthly candle with a retest of 1.35, there is a high probability of a bullish reversal of the current monthly candle with a stable approach to the 2.1-2.5 test at least. In the event of a breakdown of 2.5, further growth towards 5-7.5 will be very active. With a negative market and ether falling to 3500, there is a possibility of a delay and flat ATM with a rebound from 2.1 and growth from the second half of the quarter.
According to CITY, there is also a good quarter opening above 1.0, which can lead to stable growth on the 2.1-2.5 test this month with a further trend.
For ACM and JUV, there is also a good opening of the quarter above the supports, but the candlestick pattern on large timeframes is more negative, and therefore growth may be more sluggish after the breakouts of ATM and CITY.
Among other altcoins, so far I am considering only chess pivx and fio, which can give an increase of up to 50-70% from current levels against the background of the lack of assignment of the monitoring tag in the first week of the new month. However, the opening of the quarter for them is quite negative, which is likely to lead to new price drawdowns, especially in the event of a drop in ether. In work, it is worth keeping a moderate position with the expectation of possible drawdowns to 0.100-115 for pivx, 0.05 for chess and 0.0125-150 for fio. Topping up can be confidently done from these levels, a hike below is possible only if the monitoring tag is assigned in the following months, or there is a strong drop in ether up to 2500.
I will consider other coins to work only after the breakdown of 4750 on ether.
Bitcoin Roadmap Before FOMC Minutes – Correction or New ATH?Today, we have one of the most important macro events — the FOMC Meeting Minutes
Let’s quickly understand what it is and why it could shake the crypto market
What are FOMC Minutes?
They’re the detailed notes from the last Federal Reserve meeting, showing what members discussed about interest rates, inflation, and the economy.
Markets carefully read every line to find hints about future rate cuts or continued tightening.
Why does it matter for Bitcoin?
When the Fed turns dovish (hinting at lower rates), risk assets like Bitcoin usually rally But when the tone is hawkish (worried about inflation), investors move to cash or bonds, causing crypto to dip.
Let’s take a look at Bitcoin ( BINANCE:BTCUSDT ) on the 4-hour timeframe .
Before analyzing the chart, let’s quickly review what defines a strong uptrend :
1-Higher Lows(HL):
Each new low should form above the previous one, showing that buyers are stepping in earlier each time.
2-Higher Highs(HH):
Each new high should be higher than the last, confirming that bullish momentum is still in control.
3-Structure Respect:
The new low should not break below the previous high — if it does, it doesn’t necessarily mean the trend is over, but it indicates a weakening of the bullish structure.
Based on the points above, Bitcoin failed to form a new Higher Low(HL) during the past 24 hours, and the previous high was retested .
These signals indicate a loss of bullish momentum, suggesting that we might see at least a short-term correction from a technical perspective.
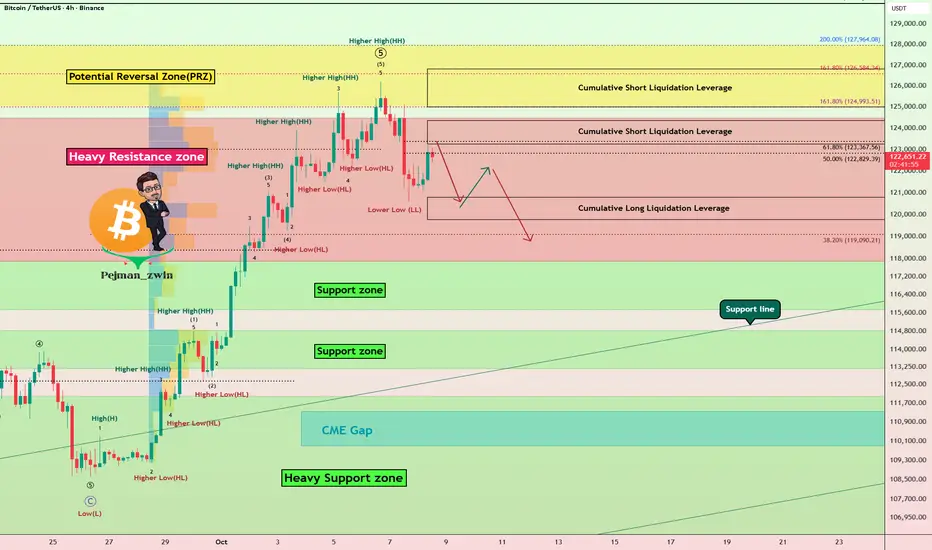
Bitcoin has already started to bounce back nicely from the Potential Reversal Zone (PRZ) and is currently trading in a Heavy Resistance zone($124,474-$117,900) .
In terms of Elliott Wave theory , it seems that with the formation of a Lower Low(LL) , Bitcoin has completed at least a series of impulsive waves , and we can now expect corrective waves .
I expect Bitcoin to drop to at least Cumulative Long Liquidation Leverage($120,779-$119,957) before the FOMC Meeting Minutes start and could continue to rise or correct depending on the tone of the FOMC Meeting Minutes .
Note: You should note that these days, Bitcoin has a higher correlation with the SPX500( SP:SPX ) index than before, so if there is a sudden movement in Bitcoin, one of the reasons could be a sudden movement in the SPX500.
Do you think this bullish move could lead to a new all-time high (ATH) for Bitcoin again!?
Cumulative Short Liquidation Leverage: $124,350-$123,244
Cumulative Short Liquidation Leverage: $126,813-$125,000
CME Gap: $111,355-$109,915
Please respect each other's ideas and express them politely if you agree or disagree.
Bitcoin Analysis (BTCUSDT), 4-hour time frame.
Be sure to follow the updated ideas.
Do not forget to put a Stop loss for your positions (For every position you want to open).
Please follow your strategy and updates; this is just my Idea, and I will gladly see your ideas in this post.
Please do not forget the ✅' like '✅ button 🙏😊 & Share it with your friends; thanks, and Trade safe.
Bitcoin STRONG Weekly Bounce - What's Next?Hello BTC Watchers 📈
📢 Bitcoin was trading right on top of a crucial support zone. But the price has successfully bounced in the weekly and made a strong comeback from the support zone.
The weekly moving averages
The daily moving averages
This is telling for a number of reasons. In the weekly we see a strong bounce above the moving averages as well as in the daily, and in the daily we had just bounced back from a correction which took us to the 100d MA (which is the general zone for a correction, or at least a wick towards that area. This indicate that in the short and longer term, the chart is looking up and bulls are in control.
What are you thoughts, new ATH or just a fakeout?

TradeCityPro | Bitcoin Daily Analysis #191👋 Welcome to TradeCity Pro!
Let’s get into Bitcoin analysis. The market is still in a ranging phase, so let’s take a look at today’s triggers together.
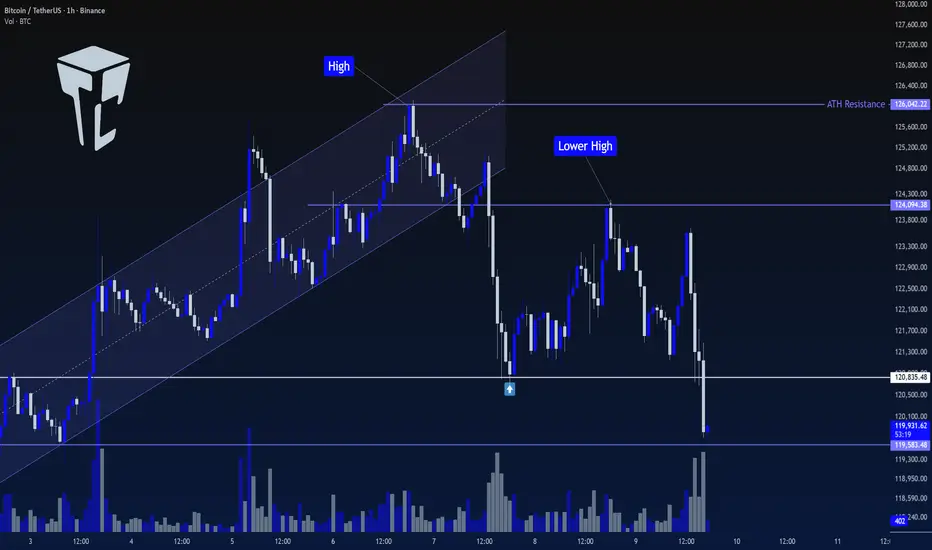
⌛️ 1-Hour Timeframe
In this timeframe, Bitcoin is still consolidating and has formed a new range high around 124,094.
✔️ Right now, the price is near the bottom of the range box it has created and is on the verge of breaking below it.
✨ If the bottom of the box breaks, price could move toward lower levels.
📊 If selling volume continues to increase, the downward move could extend further, and Bitcoin may correct to even deeper zones.
🎲 However, if this move turns out to be a fake breakdown, and we see reversal structures such as a V-pattern, we could look for a long trigger.
🔑 I still don’t see Bitcoin as being in a downtrend. In my view, every correction the market makes is still healthy and supports the continuation of the broader bullish structure, helping maintain the strength of upcoming legs.
⭐ For now, since momentum has turned bearish on the lower cycles, I don’t have any new triggers to give based on my strategy. In this phase of the market, I prefer to wait until price builds more structure.
❌ Disclaimer ❌
Trading futures is highly risky and dangerous. If you're not an expert, these triggers may not be suitable for you. You should first learn risk and capital management. You can also use the educational content from this channel.
Finally, these triggers reflect my personal opinions on price action, and the market may move completely against this analysis. So, do your own research before opening any position.
Is Altseason About to Begin?The market structure suggests we’re currently in wave C of the second corrective wave (2) — and it looks close to completion.
A potential ending diagonal and bullish divergence on momentum indicators signal exhaustion among sellers.
At the same time, Bitcoin dominance is testing a key resistance zone — a level where liquidity often starts rotating into altcoins.
📈 If the current low holds, we could be witnessing the early stages of wave 3 — the impulsive phase where altcoins usually outperform Bitcoin.
🟢 Base scenario: Correction ending → beginning of a new bullish phase
🔴 Alternative scenario: Breakdown of the current low → completion of a W–X–Y structure

Bitcoin (BTC), End of Cycle Season Based on Cycle DurationBINANCE:BTCUSDT
Bitcoin appears to have already formed its peak within the current bullish cycle and may now be preparing for a correction.
Alternatively, if BTC makes another attempt to reach a new all-time high within October, that period could mark the final peak of this cycle.
Looking at historical data, Bitcoin has shown a repeating pattern —
an uptrend lasting approximately 3 years and 11 months (1,065 days) from the bottom,
followed by a downtrend of about 1 year (365 days) from the peak.
During down cycles, the cycle low has typically formed between the EMA 50 and EMA 100.
Backtesting monthly charts shows that Bitcoin often breaks below the EMA 50, finds support above the EMA 100, and then breaks through the Ichimoku Cloud, signaling the start of a new bullish cycle.
Become an early follower and be part of the journey.🚀
I am Korean and I used Google Translate.

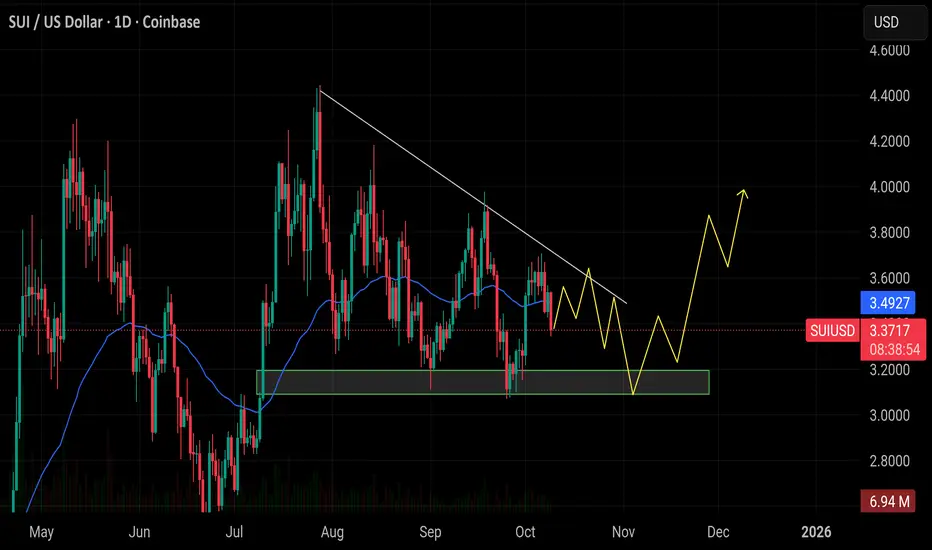
$SUI is forming a bullish structure on the daily chartCRYPTOCAP:SUI is forming a bullish structure on the daily chart, consolidating near support around $3.1. A breakout above the descending trendline could trigger a move toward the $4 zone.
RIOT Continues in Wave 3. Resistance? What resistance?NASDAQ:RIOT shot straight through resistance now support with only a small consolidation. The path should be clear for a stronger move towards $38

CLSK Breaking out!CLSK continues with momentum closing above the macro triangle upper boundary trend-line and now testing the last resistance before a breakout! This will coincide with a break above wave D and flip the macro structure bullish bringing in more capital!
Daily RSI is overbought with slight bearish divergence but can remain this way for weeks in a strong uptrend!

Gold Showed the Way... Is Bitcoin Next?Gold began a parabolic run after breaking through the Fibonacci 1.382 – 1.414 zone.
Now Bitcoin is gathering strength at the same threshold...
Historical similarity in setup
Gold broke through and became parabolic.
Next up Bitcoin
History often maps out the future.
Bitcoin, the “digital gold,” is preparing for its own run.
CRYPTOCAP:BTC Vs. TVC:GOLD 🔃
