Largest BTC Dump Case Study: December 2017–2018 December 2017–2018 – ICO Bust & Global Regulatory Crackdown
Drop:
-83% (from ~$20,000 to ~$3,200)
Catalyst:
The bursting of the ICO bubble, regulatory scrutiny worldwide, mass retail capitulation, and risky leverage.
BTC-D

Largest BTC Dump Case Study: December 2013 – China’s First BanDecember 2013 – China’s First Ban
Drop:
62% (from ~$1,241 to under $600 in weeks) triggering the bear market, with the lowest point of $165.68, -86% drop from ATH.
Catalyst:
The People’s Bank of China banned financial institutions from handling Bitcoin, sharply curbing demand and confidence.

$BTC Tests 50WMA - Line in the Sand for BullsIt’s only Tuesday, everyone RELAX.
Still a long way from a Weekly Close below the 50WMA for CRYPTOCAP:BTC
RSI is at the Liberation Day lows, and you know what happened after that.
Note: this is the shallowest pullback to the 50WMA all cycle for bitcoin, which is in-line with late cycle behavior.
In other words, this correction won’t take as long either.
We could see a Weekly Close below the 50WMA to shake everyone out, then have a bullish engulfing the following week to send us to the long awaited promise land we call VALHALLA.
In the small chance bulls cannot recover from this, below is a link to my 50WMA analysis that I put out back in February before everyone ran with my work.
Stay vigilant folks.

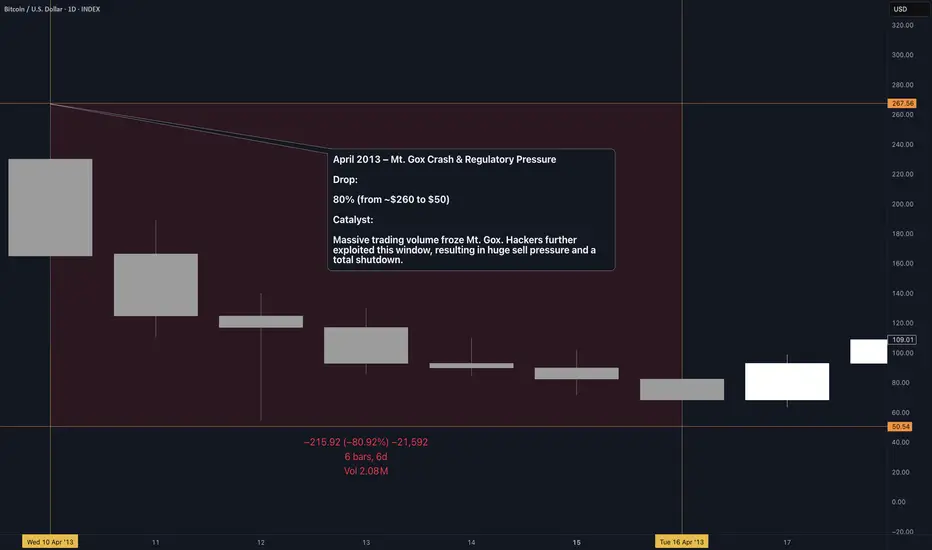
Largest BTC Dump Case Study: April 2013 April 2013 – Mt. Gox Crash & Regulatory Pressure
Drop:
83% (from ~$260 to ~$50)
Catalyst:
Massive trading volume froze Mt. Gox. Hackers further exploited this window, causing heavy sell pressure and a total shutdown.
Largest BTC Dump Case Study: June 2011 – Mt. Gox HackLargest BTC Dump Case Study :
June 2011 – Mt. Gox Hack
Drop:
93% (from ~$32 to ~$2 for a moment)
Catalyst:
The Mt. Gox exchange (then the world’s largest) was hacked, leading to panic selling and a massive price collapse.

BITCOIN Correction Ahead! Buy!
Hello,Traders!
BITCOIN fell down sharply today, but the price is now hitting the horizontal demand level and we are already seeing some early rejection signs, so as the coin is oversold, a local bullish correction is to be expected. Time Frame 12H.
Buy!
Comment and subscribe to help us grow!
Check out other forecasts below too!
Disclosure: I am part of Trade Nation's Influencer program and receive a monthly fee for using their TradingView charts in my analysis.

BTC WAIT FOR THE CRACK!After months of repeated warnings throughout the year about crypto's vulnerability, we’ve now arrived at a critical inflection point.
If Bitcoin breaks down here, it could trigger a waterfall decline — potentially into a bidless market.
This is a major level. What happens next could define the next phase for the entire crypto space.
Stay alert.
It's better to be out of the market wishing you were in than out of the market wishing you were out!
No one is forcing you to be in the market!
Click boost, like, and subscribe! Let's get to 5,000 followers! ))

Bitcoin falling to lower levels but be careful with fresh shortsBTC changed character on the h4 with a strong expansion to the downside. RR for fresh shorts is not in your favour, but upon relief, looking for a hedge is ideal.
However, sentiment will play an important role. Upon relief using support as resistance, many will enter this short bias. This could lead to a very important short squeeze.

BTC — Is This the End of Bitcoin’s Bull Market?First of all, I’ve been quite busy the past few weeks working on some exciting projects and developing new indicators that’s why I haven’t posted much here lately. But now I’m back with a fresh Bitcoin analysis, and there’s a lot to unpack.
Macro Context
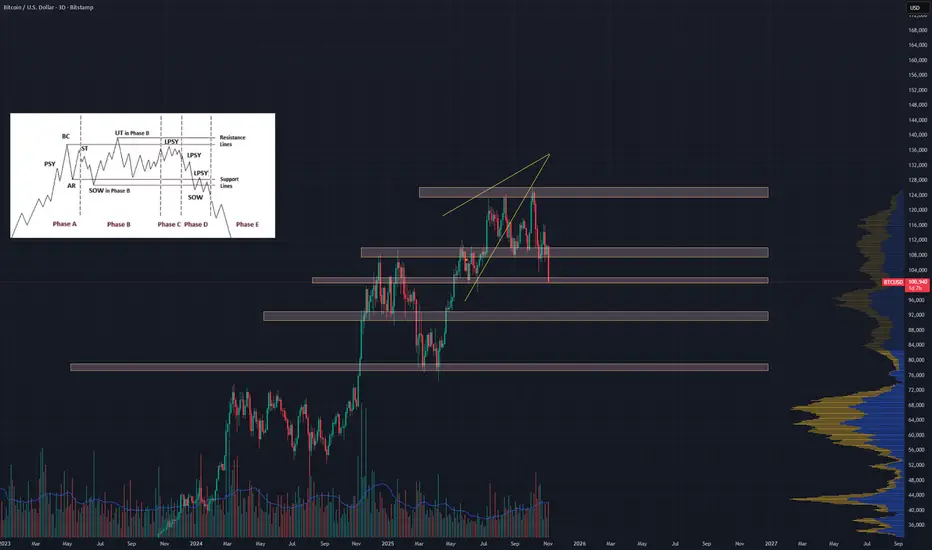
BTC’s recent structure has played out exactly like a classic Wyckoff Distribution schematic.
Back in mid-July (14th July 2025), we printed a Buying Climax (BC), followed by an Upthrust (UT) → SFP / liquidity grab. Later, price formed a UTAD (Upthrust After Distribution) → the final failed breakout, confirming buyer exhaustion and triggering the sharp sell-off event that followed.
After that sell-off, BTC retested the monthly resistance level at $115,764 twice:
The first attempt resulted in a clean rejection.
The second led to SFP of the high, confirming a bull trap and setting the tone for further downside.
The monthly resistance turned out to be the most ideal short entry, offering a near-perfect risk-to-reward setup after the clear rejection. The charts really tell the whole story, BTC has followed the technical structure perfectly.
Current Structure & Key Levels
Today, we tapped the $100K psychological level, aligning with the $2 trillion market cap, that produced an initial bounce.
The question now: is this the start of a meaningful bounce, or just a relief rally before further downside?
Looking at the wave structure, we are most likely in a Wave 3 (iii) → meaning more downside pressure remains probable.
BTCUSD (INDEX):
Key Low: $98,200 — Sell-Side Liquidity
0.618 Fib retracement: ~$94,254 — ideal long entry zone
Trend-based Fib Extension (1.0): ~$93,728
Yearly Open: $93,576
The Volume Profile shows a high-volume node between $98K–$94K, with the POC at $96.4K, perfectly aligning with the support trendline and key low.
This gives us a high-probability long zone between $98.2K and $93.5K, an area where multiple technical factors align:
Key low liquidity
Fib confluence (0.618 FR & 1.0 TBFE)
Yearly open
Volume cluster (POC)
Rising trendline support
Pattern Confluence
After the rejection at the monthly resistance ($115,764), a clear Head & Shoulders pattern also formed → another strong bearish confluence.
The neckline was broken cleanly, confirming the expectation for further downside, which is now playing out.
Psychological & Technical Zones
At the moment, $100K remains a psychological key support and the market is reacting accordingly.
Now it’s time to pay close attention as we approach critical levels, especially the long opportunity zone (98.2K–93.5K).
🟢 Ideal trade plan:
Long Entry Zone: $98.2K → $93.5K
Take Profit 1: $100K
Take Profit 2: $104K
Stop Loss: below the Yearly Open ($93.5K)
Summary
Structure: Wyckoff Distribution → Markdown Phase
Pattern: Head & Shoulders confirmed
Bias: Bearish, but approaching high-value long zone
Watch for: SFP of $98.2K → potential reversal trigger
Main invalidation: Below Yearly Open ($93.5K)
BTC continues to respect the technicals beautifully.
Stay patient! The next high-probability long setup is forming right in front of us.
🔍 Indicators used
DriftLine — Pivot Open Zones → For identifying key yearly/monthly/weekly/daily opens that act as major S/R reference points
LuxAlgo — Liquidity Sentiment Profile (Auto-Anchored)
➡️ Available for free. You can find it on my profile under “Scripts” and apply it directly to your charts for extra confluence when planning your trades.
_________________________________
💬 If you found this helpful, drop a like and comment!

Not Rocket Science, but we are RetracingNot rocket science, but we are still within the channel and most likely looking to retrace down to $95k first. This channel has been holding for a while.
#BTC CRYPTOCAP:BTC BYBIT:BTCUSDT.P
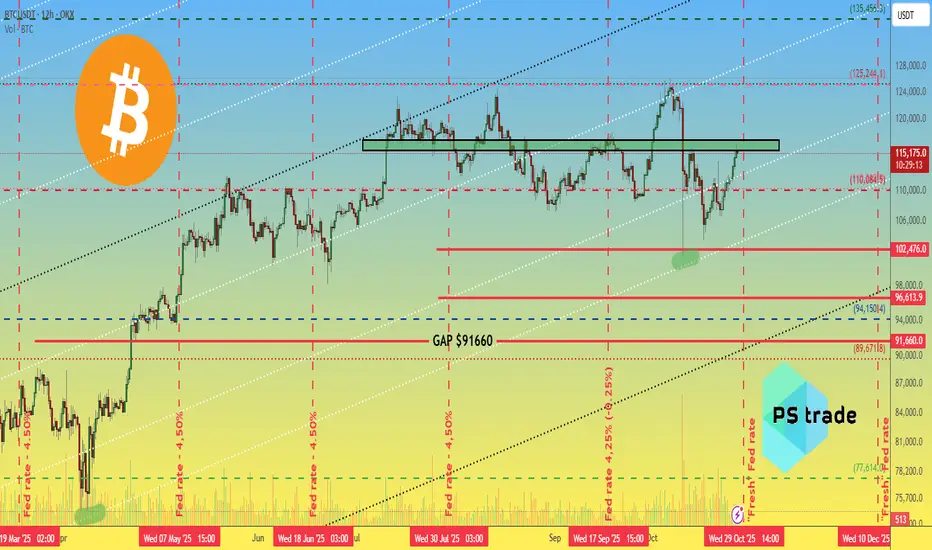
Crypto Markets Enter a Volatile Week Ahead of Key Global EventsKey events shaping volatility this week:
Oct 29: FED rate decision (expected -0.25%)
Oct 30: Trump–Xi meeting in South Korea
Market sentiment:
Fear & Greed Index jumped from 22–34 → 51
Short-term optimism is returning as macro uncertainty softens
CRYPTOCAP:BTC Technical Zone:
Current resistance: $115,500–117,000
Support: $110,000
A confirmed breakout above 117K could open the way to the next bullish leg on OKX:BTCUSDT
Question remains: is this the start of a new rally or just a pre-correction bounce?
______________
◆ Follow us ❤️ for daily crypto insights & updates!
🚀 Don’t miss out on important market moves
🧠 DYOR | This is not financial advice, just thinking out loud.
Another BTC Chart but created with PnF chartingThese drawings were made with a One Hour PnF chart for Bitcoin. Wyckoff distribution picture included for posterity.
Chart speaks for itself along with my last chart. Those Supply/Demand Zones will tell you a lot.
The Pink Elephant in Bitcoin That Everyone IgnoresYes, my friends. The game is over, and sadly, it seems like only I have to point this out to you because no one else is talking about it. Let's jump straight into the total liquidity in crypto.
As you can see, it's broken its weekly support. Look, I don't want to say our HWC—or weekly—trend has turned bearish, but I can tell you that if the daily candle closes like this, we're heading into corrections and a whole lot of pain.
Let's circle back to Bitcoin. Starting with the monthly candle
there are 26 days left, so we can't judge it fully yet, but right now, it's looking very bearish: small upper and lower shadows with a full, powerful bearish body. Combine that with the previous four indecisive candles... it's like we've got a car where all the seats are full except the driver's, and suddenly some random seller jumps behind the wheel. Okay, it's done—let's prepare for the drop. But this doesn't mean the HWC has changed ; we're still in an uptrend, and we'd need to break higher highs and lower lows to confirm that. But damn, of course we'll short in its secondary trend... why not?
Moving to the weekly timeframe
as you can see, each wave is proving weaker than the last: the first wave had 180% growth, the second 100%, and the latest one just 50%.
Now, on the daily
it's breaking that key 105k support. Around 100k, we've got another super important support level. If we lose that, the next ones are 98k and 95k. So, open your short positions on the break of 100k—keep in mind, the volatility around there will be intense.
For longs, we've got two scenarios.
1: A reaction at 101k, faking out the 104k break with a reversal pattern, then going long on the break of its resistance (which could be around 108k). Scenario 2: Going long after forming higher highs and lows on the 4H timeframe. Personally, I prefer to hold onto my long bias because, as I mentioned before , Bitcoin's uptrend legs have gone parabolic in this phase. That means if you don't jump in on the first leg, finding a stop loss on the later ones gets tough, you end up with lower R/R, plus a lower win rate—which leads to more losing streaks, more frustration, brewing the worst coffee of your life, and banging your head against everything else :)) So... that's it. Get outta here.

ETHFI – Potential Rebound from Major Support ZoneETHFI is currently testing a critical support zone between $0.60 and $0.80, a level that previously held strong during market corrections. Price structure appears to be respecting this level, and the RSI is nearing oversold territory, hinting at a possible momentum shift. This combination sets the stage for a potential bounce if current conditions hold.
🔹 Trade Idea Setup
📌 Entry Zone: $0.60 – $0.80
🎯 Take Profit Targets:
• TP1: $1.90
• TP2: $2.90
🛑 Stop Loss: $0.18
This setup presents a favorable risk-reward ratio, with entry at support and clearly defined targets. RSI signals are adding confluence, but always watch for volume confirmation and broader market behavior.

Chainlink (LINK) – SmartCon 2025 + Key Support TestLINK is in focus as SmartCon 2025 kicks off today, drawing attention to the broader Chainlink ecosystem. Historically, this event has sparked major announcements and partnerships, often impacting LINK price action. Traders are now watching for potential bullish catalysts during the event.
Technically, LINK is breaking down into a key support zone between $14.50 and $15.00. This zone has held in the past and could act as a launchpad for a reversal bounce, especially if event-driven sentiment kicks in. Failure to hold this zone opens the door to deeper retracements.
🛠️ Trade Setup (Idea Only):
Entry Zone: $14.50–$15.00
Take Profits: $20 / $22 / $25
Stop Loss: $13
Bias: Short-term bullish if support holds

$BTC Probably nothing.CRYPTOCAP:BTC Probably nothing.
Bitcoin RSI is still above 50, which is a definite area for a reversal.
Furthermore, the MA25, VWMA and SMA 26 are still strongly supporting the price, just as they have in previous reversals.

AFTER THE BREAKDOWN 105K IS THE KEY LEVEL FOR RECOVERYWe have seen an unexpected breakdown in BTC, even despite the positive news about the China deal. BTC continued to decline further, although the data has generally been pointing in the right direction.
At the moment of writing, BTC is still in a downtrend. However, the $105K level could be a key point that triggers a potential recovery, depending on how the upcoming data unfolds.
We will continue to monitor whether BTC can enter the $105K zone in the coming time frames.

TradeCityPro | Bitcoin Daily Analysis #210👋 Welcome to TradeCity Pro!
Let's dive into the Bitcoin analysis. The bearish movement of Bitcoin has begun, so it's best to analyze the market together.
⏳ 1-Hour Timeframe
On the 1-hour timeframe, Bitcoin is in a downtrend, and after breaking the 105,780 level yesterday, it continues its downward movement.
📈 The next low point the price reached was 104,488, which has also been broken, and the price is still moving downward.
💥 The RSI oscillator is at a very important support level around 30, and from both a momentum and candlestick perspective, we can say there is no weakness in the trend.
✨ Therefore, a break below the 30 level and into the oversold zone significantly increases the likelihood of a sharp downward move.
✔️ Currently, we don’t have a short trigger because the price has moved very sharply, and no specific trigger has been formed. However, once RSI enters the oversold zone, we can use candlestick setups for entries.
🎲 As long as the price doesn’t create a lower low and lower high below 104,488, I won’t consider the break of this level valid, and there’s a possibility of this bearish move being a fakeout.
🧮 If the price stabilizes above 105,780, it would confirm the fakeout. However, if the price stabilizes below 104,488, the next wave of the drop will begin.
❌ Disclaimer ❌
Trading futures is highly risky and dangerous. If you're not an expert, these triggers may not be suitable for you. You should first learn risk and capital management. You can also use the educational content from this channel.
Finally, these triggers reflect my personal opinions on price action, and the market may move completely against this analysis. So, do your own research before opening any position.

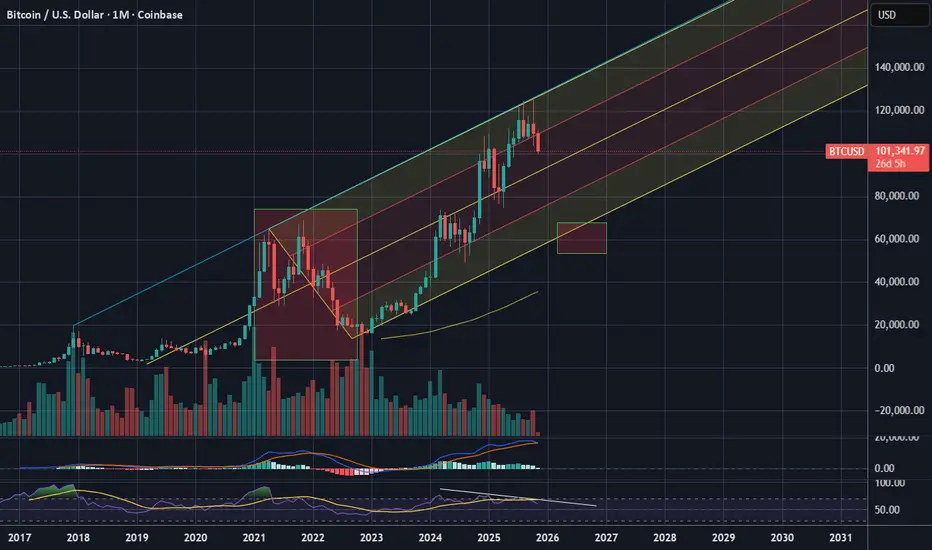
BITCOIN and stocks, 2021 vs 2025...Bitcoin (BTCUSD) could be entering a new Bear Cycle and as we've mentioned a few times recently, the 1W MA50 (blue trend-line) will play a big part at deciding that. This is basically the level that BTC is testing right now.
What may seem surprising to some, is that while Bitcoin has been correcting, the stock market (S&P500 illustrated by the black trend-line) has been rising making All Time High (ATH) after All Time High. This is not uncommon towards the end of Bull Cycles and has been particularly relevant during the Top of the previous (2021) Cycle.
As you can see, Bitcoin topped 7 weeks before stocks did, as we witnessed heavy profit taking and rotation of those (extraordinary) crypto gains towards stocks. Even the 1W RSI Lower Highs structure is similar between 2021 and 2025. The 4-year Cycle Theory in full confirmation (so far).
If the pattern plays out the exact same way time-wise as in 2021 (often it doesn't), we should be expecting stocks to top around the week of November 24. As for Bitcoin's trend after, following the 2022 blueprint wouldn't be unreasonable at all, as a 1W candle closing below the 1W MA50 would open the way to a 1W MA100 (green trend-line) test, multiple months of ranged price action between the two and then violent crash towards the 1M MA100 (red trend-line).
So do you think Bitcoin has topped and if yes, are stocks about to follow soon? Feel free to let us know in the comments section below!
-------------------------------------------------------------------------------
** Please LIKE 👍, FOLLOW ✅, SHARE 🙌 and COMMENT ✍ if you enjoy this idea! Also share your ideas and charts in the comments section below! This is best way to keep it relevant, support us, keep the content here free and allow the idea to reach as many people as possible. **
-------------------------------------------------------------------------------
💸💸💸💸💸💸
👇 👇 👇 👇 👇 👇

Bitcoin at the Brink: Breakdown or Breakout?Bitcoin is on the edge of a cliff . If this channel breaks downward, Bitcoin could fall below $100,000. But if the price respects this PRZ (Potential Reversal Zone), we can expect a solid rally toward $111,000, then $117,000, and eventually $125,000.
What do you think—will Bitcoin fall or rise?

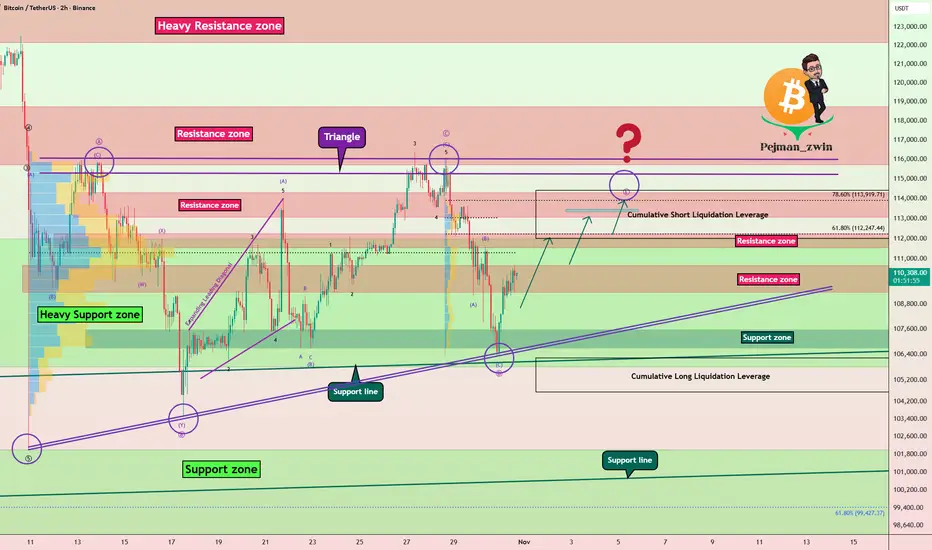
Bitcoin Correction Forming a Triangle – Which Way Next?Bitcoin ( BINANCE:BTCUSDT ), just as I expected in the previous idea , started to decline and reached its full target .
Over the past 20 days , Bitcoin has been moving in a ranging pattern that seems to be forming into a triangle shape .
From an Elliott Wave perspective , this corrective structure also appears to be a triangle , with its wave E potentially completing around the Resistance zone($114,300-$113,000) and the Cumulative Short Liquidation Leverage($114,424-$112,000) .
I expect that in the coming hours, Bitcoin can rise at least up to about $112,800 . If the upward momentum is strong enough , we might even see it reach the upper lines of the triangle .
Cumulative Long Liquidation Leverage: $106,231-$104,648
Please respect each other's ideas and express them politely if you agree or disagree.
Bitcoin Analysis (BTCUSDT), 2-hour time frame.
Be sure to follow the updated ideas.
Do not forget to put a Stop loss for your positions (For every position you want to open).
Please follow your strategy and updates; this is just my Idea, and I will gladly see your ideas in this post.
Please do not forget the ✅' like '✅ button 🙏😊 & Share it with your friends; thanks, and Trade safe.
BTCUSD: A bullish channel might be formedHello Traders!
Considering the next few days, we might see a buy opportunity for the king of the Cryptos!
General long-term is bullish,
Mid-term is bearish,
we are around a zone,
a week bearish trend seen breakable.
We would trade the possible channel after reaching the activation line.
If SL hit before the activation line, we'll cancel the trade .

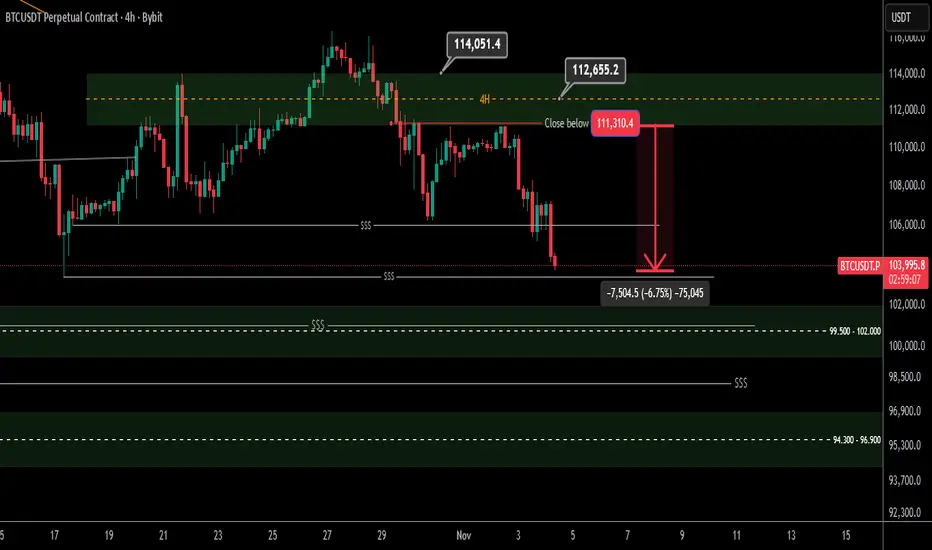
Bitcoin 4 Hour Update
Hello Traders
Bitcoin moved towards lower liquidity as expected and so far we have made a loss and profit of about $7000. This will continue to be a bearish structure to gather liquidity and important support below all these liquidity levels will be the 96k/94k range where we will look for a trigger buy
Analysis link and entry range: