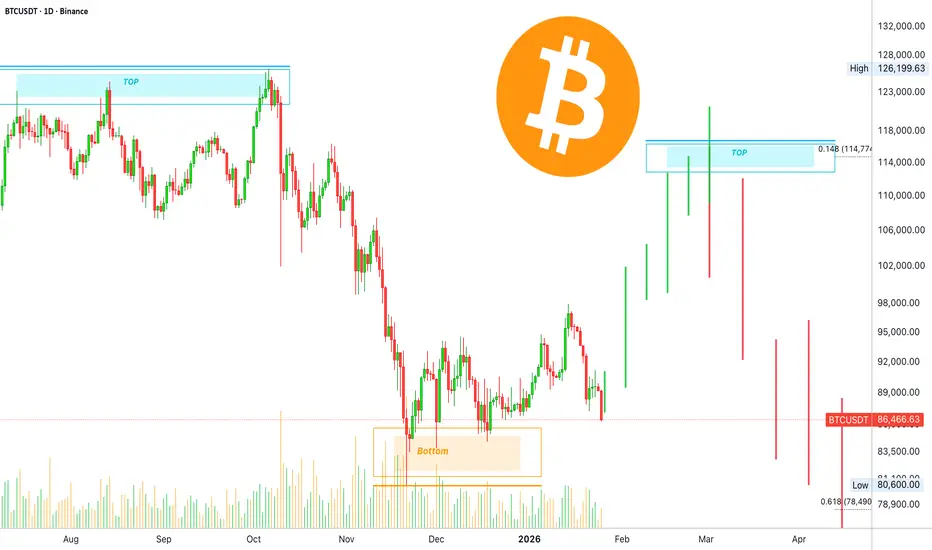
BTCUSD: Building Energy Between Demand and ResistanceBitcoin is currently compressing after a sharp sell off, holding firmly above a well-defined demand zone, while price continues to form higher lows into a descending EMA. This structure signals absorption and accumulation, not panic selling. Sellers are failing to push price back into demand, while buyers are stepping in earlier on each dip a classic sign of pressure building before expansion.
Technically, this is a range-recovery structure: liquidity has already been taken below, and the market is now rotating to decide whether it can reclaim the EMA and attack the higher-timeframe resistance zone. From a macro perspective, Bitcoin remains supported by expectations of looser financial conditions ahead and persistent institutional interest on dips. Until demand is lost with acceptance, the higher-probability path remains upward continuation toward resistance, not a trend reversal.
Btc-e

ETHUSD: Grinding Higher to Hunt Liquidity Above Three ThousandEthereum just printed a classic post-liquidation recovery, and the structure tells a very clear story: after the sharp sell-off into the major support zone around 2,780–2,800, price rebounded aggressively and transitioned into a tight ascending channel, printing higher lows with controlled pullbacks. this is not impulsive euphoria, it’s acceptance and absorption. Notice how every dip holds above the rising trendline while price coils under the key resistance zone near 2,980–3,000, right where the EMA 89 is flattening that’s a textbook compression before expansion. From a trader’s logic perspective, this is a liquidity-building phase: shorts are getting uncomfortable below resistance, while late longs are forced to chase strength. Macro adds fuel here — stable risk sentiment, ETH ETF inflow expectations, and relative strength vs BTC keep downside limited as long as the broader market doesn’t flip risk-off. The play is simple and disciplined: as long as ETH holds above the rising structure, a breakout and acceptance above 3,000 opens the door toward the next upside leg, while failure and a clean loss of the channel would signal a deeper mean reversion back toward the lower demand. Until proven otherwise, this is controlled bullish continuation not distribution.

BTCUSD H1 — Support Held, Structure Is RebuildingBitcoin has cleanly defended the 87,200–87,500 support zone after a sharp sell-off, printing a sequence of higher lows that signals short-term structural repair. Price is now grinding higher along a rising trendline, but remains below the declining EMA 98, meaning this move is still corrective until proven otherwise. The key near-term test sits at 88,800–89,000 — a local lower-high resistance and dynamic EMA confluence. A confirmed reclaim and hold above this level would open the path toward 89,700 → 91,000, aligning with prior liquidity and range highs. However, failure to hold the rising trendline or a breakdown back below 87,200 would invalidate the bullish recovery and expose downside toward the 86,000 liquidity pocket.
⚠️ This is not a breakout yet. BTC is deciding whether this bounce becomes continuation or just a relief rally.

BTCUSDT (Weekly) – Long-term Chart Update. BTCUSDT (Weekly) – Long-term Chart Update.
BTC is still inside a rising channel (higher highs & higher lows intact).
Price is holding the lower trendline support of the channel — a key bullish area.
The weekly MA (~87.5k) is acting as dynamic support.
Current price: ~88.7k
This is a make-or-break support region.
As long as weekly closes stay above the lower channel + MA, the bullish structure remains valid.
Consolidation above 85k–90k.
100k psychological-
120k–125k (channel mid/upper area)
Extended cycle target 140k–150k+ (as projected)
Weekly close below ~85k.
Break of channel support → deeper correction toward 75k–70k.
short-term consolidation
Buy the dip mindset while structure holds.

BTC Running Flat?Looks like a running flat correction on BTC with B wave completing at the $86k low
May see C wave soon $100k+

Bitcoin — Bearish Bigger Picture, But a Short-Term Reversal?When it comes to the overall outlook for BTC, I remain far from optimistic and continue to hold a bearish bias on the medium to longer term.
That said, markets move in waves — and based on last week’s price action, I’m now expecting a short-term upside reversal.
🔎 What Changed on the Chart
After breaking below the flag formation that had defined price action since late November, BTC dropped into the 86k zone, where it formed a local low.
What’s important is what happened next:
- price reversed quickly
- and moved back up to retest the broken flag structure
Under normal circumstances, a clean break from a continuation pattern like this should lead to acceleration to the downside.
The fact that this acceleration did not happen is, in itself, information.
👉 This behavior strongly suggests the possibility of a false break.
⚖️ Two Time Horizons, Two Different Biases
To be very clear:
Medium-term:
My bearish view remains unchanged, with 75k still my primary downside objective.
Short-term:
The current structure opens the door for a counter-trend long, especially if price continues to hold above the recent low.
📌 Trading Idea (Short-Term Only)
On the short-term horizon, I will look to:
👉 buy dips
The logic is simple and tactical:
- downside risk is relatively well-defined
- upside potential could extend toward the 95k zone
That gives a potential risk-to-reward of up to 1:5, which is more than acceptable for a counter-trend setup.
✅ Conclusion
BTC remains a bearish market on the bigger picture — but short-term price behavior matters.
Right now, the lack of downside follow-through after the flag break increases the probability that we are seeing a temporary upside reversal.
Trade the timeframe you’re in — and manage risk accordingly. 🚀

BTCUSDT 341% profits potential with 10X leverage —LONG tradeGood afternoon my fellow Cryptocurrency trader, I hope you are having a wonderful afternoon.
I found another chart setup that looks great for a 10X LONG. It is Bitcoin, the top, the biggest, the #1 crypto.
Let's look at this chart setup from a different perspective, let's go with the classic saying; buy when the market is red.
Bitcoin has been in a retrace for nine days and trading volume is really low. The action continues to happen as a higher low... Below the full trade-numbers:
___
LONG BTCUSDT
Leverage: 10X
Potential: 341%
Allocation: 10%
Entry zone: $83,000 - $88,000
Targets:
1) $98,000
2) $104,400
3) $108,780
4) $116,441
Stop: $82,800
_____
Thanks a lot for your continued support.
This trade can start moving the next day. It is a high probability chart setup. It has a good potential for reward. All targets can be reached "short-term," within 30 days.
Thank you for reading.
Namaste.
Bitcoin (BTC/USDT) – Trading Plan for Today | Jan 27🔥 Bitcoin (BTC/USDT) – Trading Plan for Today | Jan 27
The session opened above the key daily level
and near the composite Point of Control,
suggesting a potential bullish narrative and a balanced trading day.
However, the higher-timeframe context remains bearish,
which keeps downside scenarios relevant.
Primary scenario (long – locally)
As long as price holds above the key daily level
and does not accept below it,
I consider a bullish intraday scenario.
Long target:
– 88952.
Expectations:
– balance conditions,
– possible upside continuation while holding above the level.
Alternative scenario (short – on confirmation)
If price:
– accepts below the key daily level,
– and shows clear seller continuation,
the bias will shift back to short.
Short target:
– lower boundary of the daily reverse zone, marked on the chart.
If this idea was helpful, support it 🚀 and follow.
This is not financial advice. Proper risk management is required.

PUMPUSDT: 65% Wick Rejection at Supply ZoneWe just witnessed a textbook rejection at $0.003096 with a shooting star candle sporting a 65% upper wick. After an 18% rally into extreme overbought conditions, the market delivered a violent rejection at our identified bearish order block. This is smart money distribution, not retail strength.
1. THE TECHNICAL REALITY 📉
• Trading in PREMIUM zone per SMC framework – the sell zone, not the buy zone
• Unfilled bullish FVG at $0.002541 acting as magnet for price reversion
• Bullish OB demand zone sitting at $0.002354-$0.002492 below current price
• Strong low at $0.002240 becomes primary target if demand fails
2. THE INDICATORS ⚖️
Bearish Signals:
• RSI at 72.8 – extreme overbought territory
• Stochastic at 81.7 – confirming overbought conditions
• ADX reading of 19.3 shows weak trend strength despite +18% move
• Shooting star with 65% upper wick at resistance = distribution pattern
Bullish Signals:
• Recent 18% rally shows momentum capability
• Bullish OB demand zone intact below at $0.002354-$0.002492
The Conflict:
The rally percentage looks impressive, but ADX reveals there's no real conviction behind this move. Overbought indicators at resistance suggest this is a liquidity grab, not a breakout.
3. THE TRADE SETUP 🎯
🔴 Scenario A: Mean Reversion Short
• Trigger: Continued rejection below $0.003096 bearish OB
• Entry: Current levels or retest of $0.002936-$0.003096 supply zone
• Target 1: $0.002541 (bullish FVG fill)
• Target 2: $0.002354-$0.002492 (bullish OB demand)
• Target 3: $0.002240 (strong low)
• Stop: 4H close above $0.003096
🟢 Scenario B: Rejection Invalidation
• Trigger: Strong 4H close above $0.003096 bearish OB
• Entry: Reclaim and hold above $0.003096
• Target: $0.003243 (24h high retest) and potentially higher
• Invalidation: Failure to hold above $0.003096 on retests
MY VERDICT
The setup favors the short side with 72% confidence. We're in the premium zone with overbought indicators and a weak ADX reading – this rally lacks the conviction for continuation. The line in the sand is clear: $0.003096. Below it, bears control the narrative. Above it, reassess immediately.

BITCOIN - Consolidation below 90K. Weak marketBINANCE:BTCUSDT failed to break through the 90K area, and the market is forming a cascade of resistance, indicating the dominant position of sellers in the current circumstances.
The market still looks quite weak, and any attempts at growth are a hunt for liquidity. Global and local trends are bearish, with sales dominating (outflow of funds).
There is no fundamental support, the transfer of assets to crypto exchanges and the outflow of funds from ETF funds continues, which in general indicates weak market sentiment during the crypto winter. The current cycle is downward, and there is a possibility of a retest of the 80,000-75,000 zone.
Technically, Bitcoin is facing strong resistance at 89K and, unable to continue its growth, is rebounding and heading downwards. A short squeeze may form before the fall.
Resistance levels: 88,950, 89,590, 90,350
Support levels: 86970, 86100
If the bears keep the price below 89000, the market may fall to an intermediate bottom of 86000, however, closing below 86K could signal a further decline to 80K.
Best regards, R. Linda!

THE FOUR HORSEMEN OF FINANCE -BTC/SP500/GOLD/COPPERTHE FOUR HORSEMEN OF FINANCE
BTC/SP500/GOLD/COPPER
"THE GREAT SHOWDOWN IN THE FINANCIAL ARENA: WHO WINS?" ⚔️
There are 4 assets on the table: GOLD | COPPER | SPX | BITCOIN
Our technical data screams that history's largest "Great Rotation" has begun. Leave your emotions aside. Let the data speak.
ROUND 1 & 2: THE "BUBBLE" vs THE "OPPORTUNITY"
Traditional markets are saturated. Bitcoin is historically cheap against them.
BTC vs S&P 500: RSI is at 26 (Technical Bankruptcy). Similar to 2015/2019 bottoms.
BTC vs GOLD: RSI is at an ALL TIME LOW (29).
2w chart BTC vs S&P 500
1w chart BTC vs S&P 500
1w BTC vs GOLD
1M BTC vs GOLD
Verdict: Wall Street and Gold are exhausted. Smart money is rotating into the only oversold asset: Bitcoin.
ROUND 3: THE ECONOMIC REALITY
Is Bitcoin expensive against the economy? NO.
BTC/COPPER: Technically oversold against industrial demand.
COPPER/GOLD RATIO: Deep in the danger zone (RSI 22). When this ratio rises from the dead, Bitcoin goes parabolic.
Meaning: We are at the exact pivot point where risk appetite wakes up.
THE VERDICT & THE TRAP
Those in stocks feel "Safe." Those in Bitcoin feel "Tired." This is the trap. The market transfers wealth from the impatient to the patient.
The Scoreboard:
S&P 500: Overvalued ❌
Gold: Saturated ⚠️
Bitcoin: OVERSOLD AGAINST EVERYTHING. ✅
Strategy: Follow the value, not the price. The "Great Rotation" flows to the scarcest asset—because this is exactly what happened in every previous cycle bottom. History is repeating itself.
PSYCHOLOGICAL TRAP
Those currently in stocks or gold feel "Safe." Those holding Bitcoin feel "Tired and Jaded." This is exactly what the market is: A transfer of wealth from the impatient to the patient.
The "Oversold" zones on the charts are "Pain" zones. But the biggest profits are always born from this pain.
STRATEGY
I am not a soothsayer; I am an analyst. The data tells me this: Global liquidity will exit swollen traditional markets (SPX, Gold) and flow into the asset with the highest "Value/Price" mismatch.
That asset, having bottomed out in all ratios, is Bitcoin. This is not investment advice; it is an "Asset Survival" guide.
"The crowd follows price; Professionals follow value." Value is currently at the bottom, while Price has not yet left the station.
Are you ready?

BTCUSDT is manipulating the liquidity zone The market structure is bearish, with an upward momentum forming in response to the growth of the US stock market (S&P 500). As part of a countertrend correction, Bitcoin may test the zone of 89,200 (0.6 Fibonacci) - 89,800 (order block from the 0.7 Fibonacci zone).
Buyers are showing a weak reaction, with no bullish volumes. The last two hours have seen manipulative trading aimed at capturing liquidity (moving towards the magnet).
Scenario: a false breakout of the downward resistance + the 89,250 level could cause a possible decline.

BTC vs. Gold similar sigularityThe daily bars from gold in the 1970s are similar to the weekly btc chart 2025.
Let´s see whats happpend after the actual gold run dropped and the money is turning back in digital gold btc.
Amazing times ahead.

btc update now btc is currently exhibiting a significant shift in market structure on the 15-minute timeframe. After a steady climb within an ascending channel, the price has encountered heavy selling pressure at the 5,115 - 5,125 supply zone. This rejection has led to a decisive break below the primary trendline support, signaling a potential trend reversal.
Technical Breakdown:
Supply Interaction: The purple resistance box represents a high-interest area where buyers failed to maintain momentum, leading to a "double top" like exhaustion.
Trendline Breach: The breakdown of the ascending channel suggests that the previous bullish cycle is over, and the market is now seeking lower liquidity pools.
Entry Logic: The current setup follows a "Break and Retest" pattern. We are looking for the price to stabilize below the broken trendline before expanding toward the downside.
Target Levels: The primary take-profit objective is set at 4,924, which aligns with a major structural low and a significant liquidity gap.
Risk Management: To maintain a high risk-to-reward ratio, the invalidation point (Stop Loss) is placed at 5,148, just above the recent swing high.
Summary: This is a high-probability bearish setup based on a structural shift (ChoCh). We expect further downside expansion as long as the price remains below the immediate resistance level of 5,077.

Bitcoin Targeting 84.450 - watching for point D CompletionOn the Bitcoin daily chart, i am observing a very intersting harmonic pattern that is gaining more technical significance every day. Everything points to a developing GARTLEY FORMATION, where point B is already clearly visible, and following the BC bounce, the market is currently heading towards completing the entire structure. My key decision-makin area is the around 84.450 level, which is where point D of the formation sits. I have identified this zone based on significant reference points, such as the lower shadows from early December and the lows from December 18th. I'm now waiting for this setup to fully complete and I intend to trade it once the price precisely reaches that designated level.

BTC Bitcoin MONSTER Trade in Play | Planning Our Next MoveIn this video, we continue managing our BTC Bitcoin MONSTER trade 🥇💪. We break down our strategy and how this can be a lifge changing opportunity.. now planning our next move. Price is printing clear higher highs and higher lows on the 30-minute chart ⏱️📊, and we’re looking to capitalize on the next swing high and retracement.

BTC is not reversing — A bearish pullback into EMA resistanceBitcoin remains firmly in a bearish market structure on the H1 timeframe, with price consistently trading below the EMA 98, which is acting as dynamic resistance rather than support. The recent bounce is corrective in nature, occurring after a sharp sell-off, and shows overlapping candles with weak upside momentum a typical bearish pullback rather than the start of a new impulsive leg. Notably, price was previously rejected aggressively at the EMA 98 zone, confirming that sellers are still in control and using this level to reload shorts. As long as BTC fails to reclaim and hold above the EMA 98 with acceptance, the path of least resistance remains to the downside, with lower highs continuing to form and downside liquidity still untested. The bearish scenario remains the higher-probability outcome, targeting the previous demand and liquidity zone below, while any bullish alternative would require a clean break and sustained acceptance above EMA 98 something the market has not shown yet.

ETH bounce = resistance test, not a reversal.On the 1H timeframe, ETH remains structurally bearish despite the sharp rebound from the recent sell-off. Price is still trading below the declining EMA 98, which continues to act as dynamic resistance, aligning closely with the descending trendline a confluence that reinforces seller control. The current bounce shows corrective characteristics: overlapping candles, weak follow-through, and rejection near the 2,880–2,900 zone rather than impulsive continuation. This suggests short-covering and mean reversion, not fresh demand. As long as ETH fails to reclaim and hold above the EMA 98 with strong momentum, the dominant scenario favors another leg down, with downside targets toward 2,838 first and potentially the 2,780–2,800 demand pocket if selling pressure resumes. Only a clean break and acceptance above the EMA 98 would invalidate this bearish continuation bias.

From Panic to Opportunity: Demand Absorption Is Shaping Bitcoin has just completed a textbook liquidity-driven sell-off, followed by a sharp reaction from higher-timeframe demand, and the current structure suggests the market is transitioning from panic to stabilization. After failing to hold below the descending EMA cluster, BTC accelerated lower and swept sell-side liquidity aggressively, flushing late longs and triggering forced liquidations into the 86,000–86,800 demand zone. This move was emotional and fast a classic signature of capitulation, not healthy trend continuation. Immediately after tapping this demand, price reacted strongly, reclaiming intraday structure and pushing back above 88,000, confirming that buyers were waiting below, not absent. From a market structure perspective, Bitcoin is still technically in a broader corrective phase, but the downside momentum has clearly slowed. The impulsive sell-off has transitioned into a higher-low recovery, which tells us that selling pressure is no longer dominant. Price is now attempting to build acceptance above 88,000–88,500, an important equilibrium area inside the prior range. As long as Bitcoin continues to hold above the demand zone and prints higher lows, this recovery should be viewed as a developing corrective leg upward, not a dead-cat bounce.
Looking at liquidity and order flow, the current price action makes sense. Sell-side liquidity below 87,000 has already been taken, and the market now has an incentive to move higher toward buy-side liquidity resting above 89,500, 90,500, and into the major resistance zone near 90,800–91,200. This is where trapped shorts from the breakdown and breakout traders from the previous range have their stops clustered. The projected zigzag path higher reflects how the market typically rebalances — partial pullbacks to trap premature longs, followed by continuation to the next liquidity pool.
From a psychological standpoint, sentiment has just shifted from fear to hesitation. Many traders are still biased bearish after the sharp drop and are selling too early into strength. That hesitation is fuel for continuation. As long as price does not collapse back into the 86,000 demand zone, bears lack follow-through. Meanwhile, dip buyers are becoming more confident, especially as volatility compresses after the sell-off.
On the macro and narrative side, Bitcoin remains sensitive to risk sentiment, U.S. dollar movement, and real yields. Any pause or pullback in the U.S. dollar, combined with stabilization in equity markets, supports further upside relief in BTC. Importantly, this is still a range recovery, not a confirmed macro bull continuation — which means resistance must be respected, especially near the 90,800–91,200 supply zone.
Bullish scenario:
As long as BTC holds above 86,000–86,800, price is likely to continue grinding higher toward 89,500, then 90,500, and potentially a full test of the 90,800–91,200 resistance zone.
Bearish invalidation:
A decisive breakdown and acceptance below 86,000 would signal that demand has failed and open the door for a deeper continuation toward 84,000–82,500.
Bias: Short-term recovery, medium-term range
Key demand: 86,000–86,800
Key resistance: 90,800–91,200
This is not a market to chase emotionally. Bitcoin is doing what it always does after a liquidity sweep reset sentiment, rebuild structure, and hunt the next pool of liquidity.

CUSD (1H) — The breakdown isn’t the danger. The failed retestOn the 1H timeframe, Bitcoin is playing out a very textbook range–liquidity–breakdown sequence. Price spent a prolonged period consolidating inside a sideways range between 88,200 and 90,250, allowing liquidity to build on both sides of the box. Once that liquidity matured, the market executed a clean breakdown below the 88,200 support, triggering stop-losses from late longs and breakout traders a classic sell side liquidity sweep. The sharp bounce that followed is not bullish by default; it is a natural reaction after liquidity has been consumed. At this stage, the rally should be treated as a relief bounce, not a confirmed trend reversal.
Structurally, the short-term market remains bearish. The EMA is still sloping downward, and price has not yet reclaimed any key resistance. This makes the retest zone between 88,200 and 88,600 the most critical area on the chart. If price rallies into this zone and shows rejection long upper wicks, bearish closes, or increased sell volume. it would confirm that former support has flipped into resistance. In that scenario, the market is likely transitioning into distribution below resistance, with high probability of another leg lower toward the 86,000–86,500 liquidity pocket, where unfilled orders and resting buy-side liquidity are likely sitting below the recent low.
From a liquidity and psychology perspective, this area is extremely sensitive. Traders who were stopped out during the breakdown are now emotionally inclined to sell near breakeven, while aggressive shorts often enter late after the flush. This creates the perfect environment for a failed retest, where sellers regain control and push price lower once again. Conversely, the bullish invalidation is very clear and objective: if Bitcoin reclaims and holds above 88,600, with a strong hourly or four-hour close and a successful retest, then the breakdown would be classified as a false break / stop-hunt. In that case, price could rotate back into the prior range and target 90,250 first, followed by 91,270, and ultimately the higher resistance zone near 93,500.
From a macro standpoint, Bitcoin remains tightly correlated with risk sentiment. Any sudden moves in U.S. dollar strength, bond yields, or Federal Reserve rate-cut expectations can act as catalysts for sharp liquidity-driven moves. During periods of thin liquidity, the market often exaggerates reactions to news, producing wicks designed to trap emotional traders before the real direction unfolds. This is why confirmation at structure levels matters far more than prediction.
Trading plan summary:
– Bearish base case: Look for rejection signals in the 88,200–88,600 retest zone. Failure here favors continuation toward 86,000 and below.
– Bullish invalidation: Only shift bullish if price reclaims and holds above 88,600, opening the path back toward 90,250 → 91,270 → 93,500.
Until that reclaim happens, this market should be treated as a corrective bounce within a bearish structure, not a confirmed reversal. Risk management remains key.

Coinranger| BTCUSDT. Continuing decline to 85,000🔥News
🔹No important news today. Only an old data on american market will be released, which is usually considered preliminary.
🔥BTC
🔹Fell down last night and broke through previous peak. Current levels:
1️⃣ The levels above can only be calculated tentatively. 88,500 is the first level for the end of the pullback.
2️⃣ The levels below - 85,000 and 84,700 - almost coincident potential ends of the downward sets of waves on h1 and h4.
Without news, we could either continue the decline, or make a pullback, and then, for example, fall further.
---------------
Share your opinion in the comments!

#GBPJPY , Another Short ??📊 Morning Market Brief | London Session Prep
🔎 Instrument Focus: #GBPJPY
⚠️ Risk Environment: High
📈 Technical Overview:
Maybe , We can have GJ again but this time would be so Risky.
🚀 Trading Plan:
• Check Momentum around Entry point . if it be high momentum , SKIP IT
• LTF ENTRY NEEDED
🧠 Stay updated with real time news and macro events, visit 👉 @News_Ash_TheTrader_Bot
#Ash_TheTrader #Forex #EURUSD #MarketInsight #PriceAction #TradingPlan #RiskManagement #LondonSession #Scalping #Futures #NQ #Gold

BTC will face hell this year - bottom will set in at 45,379$!its safe to say we are in a bear market.
the bottom will set in at 45,379$ and lift off will occur to 300,000£ at the minimum.
I would advise you all to DCA anything below 50k usd.
you will probably get till mid 2027 to fill your usdt bag and enter the market before lift off.
Bitcoin will never totally fail, but it works in miraculous cycles to clean out the dead weight and those not in the know.
our recent projections of price hitting 61,382$ are coming to fruition.
main areas of support whereby we expect brief support are at 80,934$ and 69,675$ before then.
please see linked ideas and our page, you will realise how scarily accurate our dooms day predictions are.
