COIN Short-term analysis | Trading and expectationsNASDAQ:COIN
🎯 Price appears to have completed wave C of 2, a corrective pattern to the downside, filling the gap left in May 2024. Coin recovered above the daily pivot, but below the daily 200EMA so direction is ambigous.
📈 Daily RSI has printed bullish divergence from oversold, a strong bottoming signal.
👉 Analysis is invalidated below wave C, $220, keeping the downtrend alive.
Safe trading
Btc-e

CLSK Short-term analysis | Trading and expectationsNASDAQ:CLSK
🎯 Price fell a dollar shy of breaking the triangle wave D target, keeping the triangle alive. The 3 white knight pattern was rejected, but the structure is still bullish. Support was found at the orange trend line, and resistance is found at the daily 200EMA.
📈 Daily RSI sits at the Eq with no divergence.
👉 Analysis is invalidated if price falls below wave (2) at $9
Safe trading

CIFR Short-term analysis | Trading and expectationsNASDAQ:CIFR
🎯 Wave d of the triangle may still be underway, wave e is expected to end at the daily pivot where price currently sits, above the daily 200EMA, showing the uptrend is still intact but flattening.
📈 Daily RSI bullish divergence has failed to play out, showing the bears are in control.
👉 Analysis is invalidated if price falls below wave C, $12.50, suggesting a deeper retracement
Safe trading

BTDR Short-term analysis | Trading and expectationsNASDAQ:BTDR
🎯 Price appears to have bottomed at the low-cap golden pocket, 78.6 Fibonacci retracement and major High Volume Node support. However, a triangle could be printing, suggesting one more push lower is on the table. Getting above $14.50 will negate this.
📈 Daily RSI has printed bullish divergence, but we need to see some follow though to be confident the bottom is in.
👉 Analysis is invalidated if price falls below wave (B), $6, and the structure will start to look bearish.
Safe trading

BTC Coils at a Critical Breakout PointBitcoin remains within a broader bullish market structure, supported by a rising trendline that has guided price action since the impulsive breakout. After printing a local high near the 94.8k area, price has transitioned into a consolidation phase, forming a series of lower highs while still maintaining higher lows a classic compression structure within an uptrend.
This price behavior reflects temporary equilibrium rather than trend exhaustion. The market is digesting prior gains, with volatility contracting as price coils between dynamic support and descending resistance.
The ascending trendline continues to act as structural support, while the descending trendline caps upside attempts, creating a tightening triangle. Price is also hovering around the EMA 50, which has flattened and is acting as short-term balance rather than directional momentum.
This setup typically precedes expansion. As long as price holds above the rising trendline and does Key Levels
Resistance:
Descending trendline near 93.2k–93.6k
Major supply above 94.8k
Support:
Rising trendline / structural support around 92.2k–92.6k
Deeper support near 90.4k (structure invalidation)
EMA / Dynamic Level:
EMA 50 around 92.8k (short-term equilibrium)not break structure to the downside, the bullish bias remains intact.
➡️ Primary Scenario:
Price continues to compress within the triangle before breaking above the descending resistance. A confirmed breakout and acceptance above this trendline would open the path toward the 94.8k high, with potential continuation toward the 96k area as bullish momentum expands.
⚠️ Risk Scenario:
A breakdown below the rising trendline with acceptance under EMA support would invalidate the bullish continuation setup. This would likely trigger a deeper corrective move toward the 90.4k zone before the market attempts to rebuild structure.

Mid-Pullback or Momentum Reset? BTC Holds a Critical Bullish Market Context & Structure
Bitcoin remains in a well-defined bullish market structure following a strong impulsive expansion from the prior accumulation phase. The sequence of higher highs and higher lows is still intact, confirming that the broader trend remains constructive despite recent volatility.
After printing a local high near the upper resistance zone, price has transitioned into a corrective phase. This pullback is occurring within structure, not as a reversal signal. Current price action reflects short-term distribution and profit-taking rather than aggressive selling pressure.
Technical Confluence
The recent sell-off failed to break the most critical higher low, indicating that buyers are still defending key structural levels. Price is currently consolidating between a well-defined support zone and overhead resistance, forming a mid-range equilibrium typical after a strong impulse leg.
This consolidation sits above the previous breakout area, suggesting the market is rebalancing before the next directional move. As long as price holds above the structural support zone, the bullish framework remains valid.
Resistance: 94,200 – 94,800 (distribution / rejection zone)
Support:
92,200 – 92,600 (structural demand)
90,400 (major invalidation level)
Scenarios
➡️ Primary Scenario:
Price holds above the 92.2k–92.6k support zone and forms a higher low. A bullish reaction from this area opens the path for continuation toward the 94.8k resistance, with potential extension into new highs if acceptance occurs above supply.
⚠️ Risk Scenario:
A clean breakdown and acceptance below the support zone would invalidate the immediate bullish continuation. In that case, BTC may enter a deeper corrective phase toward the 90.4k level before any meaningful upside attempt resumes.

Bitcoin Compresses Under Descending ResistanceHello Everyone!! Bitcoin (BTCUSD) remains within a broader bullish context after a strong impulsive rally from the lower support region. The sharp expansion leg confirmed aggressive buyer participation and shifted the short-term structure decisively to the upside.
Following this rally, price has transitioned into a descending consolidation structure, forming a clear descending triangle / falling wedge-type compression beneath a downward-sloping resistance line. This indicates that while sellers are pressing from above, buyers continue to defend the 92,200–92,400 support zone, preventing a full breakdown so far.
Price is currently trading around the EMA 50, reinforcing this area as a key short-term equilibrium zone. This mid-structure region carries elevated risk, as liquidity can be swept on either side before the next directional move is confirmed.
Bullish scenario: A clean break and strong close above the descending resistance trendline, followed by a successful pullback hold, would confirm bullish continuation toward 94,500–95,000.
Bearish scenario: A confirmed breakdown below the 92,200 support, with a pullback and rejection, would open downside targets toward 91,000, with extended risk toward 89,500.
At this stage, Bitcoin is compressing and building energy. Patience remains key the next high probability opportunity will come from confirmation, not from anticipating the breakout or breakdown.

Bitcoin Stalls Between Supply and DemandBitcoin continues to trade within a broader bullish context after a strong impulsive advance, but current price action on the H1 timeframe shows clear hesitation as the market compresses between a defined supply zone above and a demand zone below. This type of behavior typically signals a decision phase, where the market is balancing recent buying pressure against emerging profit-taking and short-term distribution.
At present, price is rotating around the 92,800 area, unable to generate sustained momentum toward the upper supply zone near 94,400–94,500. Previous reactions from this region highlight active seller interest, making it a key level that must be reclaimed with acceptance for bullish continuation to unfold. As long as price remains capped below this supply zone, upside attempts are vulnerable to rejection rather than clean continuation.
From a corrective perspective, failure to build acceptance above current levels increases the probability of a pullback toward the 91,400 demand zone. This area previously acted as a strong base before the impulsive rally and is likely to attract responsive buyers on a first test. A clean reaction here would support the view of a healthy higher low within the broader uptrend.
However, if demand around 91,400 fails to hold, the structure opens the door for a deeper retracement toward the 89,500 region. A move into this zone would represent a more significant liquidity sweep and reset, yet would still remain technically corrective rather than trend-breaking, provided the higher-timeframe structure remains intact.
Alternatively, a decisive breakout and sustained acceptance above the 94,500 supply zone would invalidate the corrective outlook. In that scenario, Bitcoin would likely transition back into expansion mode, targeting the 95,500 region and potentially extending further as fresh upside liquidity is unlocked.

Reload for Continuation or Deeper Shakeout First?Hello traders! Here’s a clear technical breakdown of BTCUSD (1H) based on the current chart structure.
Bitcoin remains within a broader bullish market structure, established by a strong impulsive rally that broke above multiple resistance levels. Following that expansion, price entered a distribution-to-correction phase, characterized by lower highs and increasing sell-side pressure.
The recent move lower represents a healthy corrective pullback rather than an immediate trend reversal, as the market is retracing into a high-confluence support area formed during the prior accumulation phase.
Major Demand / Support Zone:
The 88,800–89,200 region is a well-defined demand zone, where previous strong buying activity initiated the bullish expansion. This area also marks the base of the prior range and represents institutional demand.
Intermediate Resistance / Flip Level:
The 91,800–92,000 level acts as a critical structure flip. This level previously supported price and now functions as resistance during the pullback.
Upper Targets (Supply Zones):
If bullish continuation resumes, overhead targets are located at:
93,800–94,000 (prior swing high / liquidity)
94,800–95,000 (upper supply and range high)
These levels define the upside roadmap if demand holds.
Currently, BTC is trading directly above the major demand zone, placing price at a high-probability reaction area. This is where buyers are expected to step in if the broader bullish narrative remains valid.
The rejection from the EMA and structure flip above suggests sellers remain active short-term, but downside momentum is beginning to slow as price approaches demand.
As long as Bitcoin holds above the 88,800–89,200 demand zone, the current move should be viewed as a corrective retracement within a bullish trend. A strong reaction from demand could lead to a push back toward 91,800, followed by continuation toward the 93,800–95,000 target zones.
However, a decisive hourly close below the demand zone would invalidate the bullish continuation thesis. In that case, price could extend the correction toward lower liquidity levels, signaling a deeper structural reset before any sustainable upside attempt.
For now, Bitcoin is testing demand, not breaking trend.

Bitcoin Remains Under Pressure — Sellers Still in Full ControlPrice is trending firmly below the descending trendline and the EMA50, confirming a sustained bearish market structure with lower highs and lower lows intact. Recent pullbacks are being sold aggressively, showing no meaningful sign of demand stepping in.
A minor bounce toward the 90,800–91,000 area is likely to act as a corrective retest of structure rather than a reversal, where sellers may re-enter positions.
As long as price remains below the trendline, downside continuation is favored, exposing key liquidity targets at 89,300, followed by 88,800–88,400. Only a strong reclaim and close above 91,300 would invalidate the bearish scenario and signal a shift in short-term momentum.

Will ETH Defend This Final Support???????????Ethereum has completed a full bullish expansion cycle and is now trading in a post-distribution corrective phase on the H1 timeframe. After a strong impulsive rally supported by a clean EMA trend, price topped into a well-defined resistance zone, where buying pressure failed to sustain continuation.
Since that peak, ETH has printed a sequence of lower highs and lower lows, confirming a short-term bearish structure. The recent sell-off is impulsive rather than corrective, indicating that this is not just a shallow pullback but a deeper structural reset following distribution.
Price is now approaching a major support zone, which previously acted as a strong demand base during the prior bullish leg. This area also aligns with the flattening EMA curve, suggesting the market is reaching a key decision point.
Importantly, bearish momentum is starting to decelerate as price approaches support, increasing the probability of a technical reaction or corrective bounce, rather than immediate continuation lower.
Resistance:
3,280 – 3,320 (distribution / major supply zone)
Support:
3,060 – 3,100 (key structural demand)
Below this zone risks continuation into a broader bearish leg
➡️ Primary Scenario:
Price holds above the 3,060–3,100 support zone and forms a higher low. A bullish reaction from this area would likely trigger a corrective recovery toward the 3,200 level first, followed by a potential extension into the 3,280–3,320 resistance zone. This move would be classified as a corrective rally, not an immediate trend reversal.
⚠️ Risk Scenario:
A clean breakdown and acceptance below the support zone would invalidate the bounce setup. In that case, ETH could accelerate into a deeper bearish continuation, opening the path toward lower untested demand levels.

Has BTC Completed Its Bullish CycleBitcoin has completed a full bullish cycle and is now transitioning into a post-distribution corrective phase. After a clear accumulation base, price delivered a strong impulsive expansion (Phase 2), printing a clean sequence of higher highs and higher lows. This bullish leg peaked inside the Phase 3 distribution zone, where upside momentum stalled and selling pressure began to dominate.
The failure to hold above the last key higher low marked a structural shift. What initially appeared as a healthy pullback has now evolved into a deeper correction, with price accelerating lower and respecting a newly formed bearish structure.
Price is currently trading below the former bullish mid-range and is being capped by a descending trendline, which is acting as dynamic resistance. The prior “mid-pullback inside bullish structure” zone has failed, confirming that buyers are no longer in control at that level.
The market is now respecting a series of lower highs, while bearish impulses are stronger and cleaner than bullish reactions a key sign that momentum has flipped.
Resistance:
91,200 – 91,400 (broken structure / supply reaction)
Descending trendline resistance
Support:
89,000 – 89,200 (minor reaction level)
86,800 – 87,200 (major downside target / structural support)
➡️ Primary Scenario:
Price continues to respect the descending trendline and forms another lower high. A rejection from the 91.2k–91.4k zone would confirm bearish continuation, opening the path toward the 89k level first, followed by a deeper move into the 86.8k–87.2k support zone.
⚠️ Risk Scenario:
If price reclaims and accepts back above the broken mid-structure zone, the bearish continuation would be invalidated. In that case, BTC could transition into a broader range rather than immediate continuation lower.

Healthy Pullback or Trend Breakdown? Market Context & Structure
BTC has delivered a strong impulsive rally, shifting market structure decisively bullish on the H1 timeframe. After the vertical expansion, price is now transitioning into a corrective phase, consolidating between a clearly defined resistance zone above and a higher demand area below. This behavior is typical of post-impulse digestion rather than trend failure.
Despite recent volatility and sharp wicks, the broader structure remains constructive as long as price continues to respect higher lows. The current price action reflects a battle between short-term profit-taking and medium-term trend continuation.
Technical Confluence
Price is currently trading between the rising EMA cluster, which continues to act as dynamic support, and a supply-heavy resistance zone where selling pressure previously emerged. The fast EMA has started to flatten, while the slower EMA remains positively sloped, suggesting momentum cooling but not yet reversing.
The highlighted support zone aligns closely with EMA support and prior breakout structure, reinforcing it as a key area for buyers to defend if the bullish trend is to remain intact.
Key Levels
Resistance:
94,400 – 94,900 (supply / rejection zone)
Support:
91,300 – 91,700 (demand zone)
90,400 (major horizontal support)
EMA / Dynamic Level:
EMA cluster around 92,000–92,400
Scenarios
➡️ Primary Scenario:
Rejection from the resistance zone leads to a controlled pullback into the 91.3k–91.7k support area. If price forms a higher low and shows bullish reaction within this zone, continuation toward the 94.8k resistance — and potentially a breakout toward 96k+ — becomes the higher-probability outcome.
⚠️ Risk Scenario:
A clean breakdown below the support zone with acceptance under the EMA cluster would invalidate the bullish continuation setup. In that case, downside extension toward the 90.4k level is likely, signaling a deeper corrective phase rather than a shallow pullback.

Bitcoin Is Building a Base — Accumulation Before the Next Push Price is consolidating above the key support zone around 89,800–90,000, showing clear signs of selling pressure absorption after the recent sell-off. Volume behavior suggests potential accumulation rather than aggressive distribution.
As long as price holds above 89,800, the bullish scenario remains favored. A clean break and acceptance above 91,200–91,500 would confirm upside momentum, opening the path toward 93,000, followed by the major target near 94,700–95,000.
Only a decisive breakdown below 89,800 would invalidate the bullish setup. For now, buyers appear to be positioning for the next expansion leg to the upside.

SOLANA - retest resistance of the trading range BINANCE:SOLUSDT has been rising since the session opened amid a weak market. The altcoin is showing bullish momentum in a predominantly bearish market, with a focus on the 145.0 zone.
Bitcoin is rebounding from resistance amid a global downtrend. There is currently no bullish potential (across the entire market), which is putting pressure on altcoins overall.
SOL, against the backdrop of a neutral market, is seeking to test the resistance zone of 144.7 - 146.0 - a key liquidity zone that plays an important role for MM in the current circumstances.
A short squeeze and the formation of a reversal pattern could shift the imbalance towards sellers, which in turn could lead to a decline.
Resistance levels: 143.4, 144.7, 146.0
Support levels: 134.3, 127.55
Solana is trading in a neutral trading range of 145.0 - 123.0. The main trend is bearish. The bullish run and retest of resistance can be perceived as a hunt for liquidity. We are interested in the above-mentioned resistance zone and confirmation in the form of a false breakout to enter the market.
Best regards, R. Linda!

50 DAY $BTC WHALE FARM IN PROGRESS 50 Day Whale Farm, Community Challenge in Progress.
- Since the 30% decline from the October 2025 Bulltrap (See Sunday Oct 12th to Sunday October 26 Closers for reference)
BTCUSD has been in a 50 day whale farm with an average catch floor of 85k with a low of 81,600k.
This has been an endurance test by whales to see if the community can push past resistance without assistance from traditional finance. IMO I don't see many of them cashing out their gains to turn around and chase this market. This is a War between the 7% majority and it's OG Whales. I would rather have the floor break and continue a full -70% reduction from the top than let Corporations and Monopolies like MicroStrategy control the market with their Moby Dick Whale Size Bags this early in BTCUSD life cycle.
#NFA
CRYPTO:BTCUSD BITSTAMP:BTCUSD BINANCE:BTCUSDT COINBASE:BTCUSD

$BTC 2026 Wide Divergence Prediction 2026CRYPTO:BTCUSD
This prediction is simple, and based on the only Wide Divergence visible on the Weekly Candle chart through out the life span of CRYPTOCAP:BTC , which occurred roughly from June 2022 to December 2022 for an estimate of 203 days and is directly responsible for the price action that followed over the next 2.7 years.
- I believe that every crypto moves at its own individual rate depending on age, mcap, token circulation, holder count, ect... and that Bitcoin is the slowest moving of all.
- It is also my belief the 3x Meme Coin Pump is not only a naturally occurring phenomenon in Memes, But also Bitcoin. And we have just watched it unfold in real time over the last 2.7 years and are are in the -70% reversal from top right now.
3x Pump Date Range
- Start Date : 11/20/22 CRYPTOCAP:BTC @ 16k
- 1x Date : 3/10/24 CRYPTOCAP:BTC @ 70k
- 2x Date : 1/0/25 CRYPTOCAP:BTC @ 105k
- 3x Date : 11/5/25 CRYPTOCAP:BTC @ 125k
Start to 1x = 468 days / 1x - 2x Pump = 293 Days / 2x to 3x Pump = 249 Days
- For the last 50 days we have been tested in a whale farm with a 85k bottom and a 94k top, we are currently in the down trend from the third and final swing as the community was not able to break past the 93500k Resistance zone during this time. In the upcoming weeks we will see a sharp decline in price action breaking the 85k and create a new floor at 68k for a shorter period of time before finally completing our decent to roughly 55k.. This final bottom will be the start indicator for the next 200 day (estimated) Wide Divergence Set Up, before resetting the next 3x Pump.
Thank you for time, Hope for feedback!!
Profit > Cost Average
CRYPTO:BTCUSD

BTC/USDT 4H Chart📈 Trend
Main trend: up
Local trend: downward correction
The uptrend line (black) has still not been broken → this is crucial.
🟩 Support Zones
The most important levels you have well-marked:
91,120 – 91,400
Current price reaction
Local support + mid-range
Decisive in the short term
90,120
Very important zone
Overlaps with:
previous consolidation
potential retest of the trendline
Loss = deepening correction
88,843
Strong structural support
If price reaches here → high probability of bounce
87,235
Bulls' last line of defense
Break = structure changes to bearish
🔴 Resistance
91,400 – 91,500
Nearest resistance
Here we'll see if the uptrend has fuel
92,718
Very important level
Return above = bulls regain control
94 834
High / supply zone
Unlikely to be broken on the first try without an impulse.
📊 Stochastic RSI
Was heavily oversold.
Now bouncing from the lows → a short-term bounce signal.
Note: in an uptrend, the Stochastic RSI often gives false short signals.
➡️ Supports a corrective bounce scenario, not a dump.
🧠 Scenarios
🟢 Baseline scenario (more likely)
Defense 90-91k
Bounce → test 91.5k → 92.7k
Consolidation and decision
🔴 Negative scenario
Break 90 120
Down to 88.8k
Reaction there (or fake breakdown)

BITCOIN PREDICTION / WIDE DIVERGENCE 2026This prediction is simple, and based on the only Wide Divergence visible on the Weekly Candle chart through out the life span of CRYPTOCAP:BTC , which occurred roughly from June 2022 to December 2022 for an estimate of 203 days and is directly responsible for the price action that followed over the next 2.7 years.
- I believe that every crypto moves at its own individual rate depending on age, mcap, token circulation, holder count, ect... and that Bitcoin is the slowest moving of all.
- It is also my belief the 3x Meme Coin Pump is not only a naturally occurring phenomenon in Memes, But also Bitcoin. And we have just watched it unfold in real time over the last 2.7 years and are are in the -70% reversal from top right now.
3x Pump Date Range
- Start Date : 11/20/22 CRYPTOCAP:BTC @ 16k
- 1x Date : 3/10/24 CRYPTOCAP:BTC @ 70k
- 2x Date : 1/0/25 CRYPTOCAP:BTC @ 105k
- 3x Date : 11/5/25 CRYPTOCAP:BTC @ 125k
Start to 1x = 468 days / 1x - 2x Pump = 293 Days / 2x to 3x Pump = 249 Days
- For the last 50 days we have been tested in a whale farm with a 85k bottom and a 94k top, we are currently in the down trend from the third and final swing as the community was not able to break past the 93500k Resistance zone during this time. In the upcoming weeks we will see a sharp decline in price action breaking the current 85k floor and will create a new floor at 68k for a shorter period of time before finally completing our decent to roughly 55k.. This final bottom will be the start indicator for the next 200 day (estimated) Wide Divergence Set Up, before resetting the next 3x Pump.
Thank you for time, Hope for feedback!!
Profit > Cost Average
-MikeyLikesDips707

BTC: The Premium Zone Trap (4H vs 1H)Bitcoin is at a decisive junction. We are trading in the Premium Zone ($93,700+) with a clear conflict between timeframes. The 4H screams exhaustion (RSI 70.7 + Low Volume), while the 1H structure remains stubbornly bullish, holding above the $92,102 demand zone. The structure is intact, but the conviction is missing.
1. THE TECHNICAL REALITY (4H + 1H)
📉 We are seeing a divergence between price action and momentum:
• The Trap (4H): Price is in the Premium sell zone. RSI is overbought (70.7) and volume is down 41% at these highs. This is classic "divergence" behavior, price grinding up while participation drops.
• The Floor (1H): Despite the macro exhaustion, the 1H timeframe has cooled off (RSI 42.9) and is respecting the Ascending Support Trendline ($92,306).
• The Magnet: We have a bearish OB supply overhead at $94,760, but a juicy unfilled FVG sitting below at $90,189. Price hates leaving these gaps open.
2. THE CONFLICT: MOMENTUM VS. STRUCTURE ⚖️
Bearish Case (The Exhaustion):
• Volume has collapsed 66% on the 1H timeframe.
• MACD is printing bearish divergence on the 4H.
• 14.1% wick rejection at the $94,760 local top suggests sellers are active.
Bullish Case (The Trend):
• CHoCH and BOS are both confirmed bullish.
• Price is holding above all major EMAs (20/50/200).
• Buyers are defending the $92,102 Order Block.
3. THE TRADE SETUP 🎯
We play the reaction, not the prediction. Here are the two probability paths:
🔴 Scenario A: The Premium Rejection (Higher Probability) If volume fails to return, gravity takes over.
• Trigger: Loss of the 1H support trendline ($92,300)
• Target 1: $90,189 (Filling the 4H FVG)
• Target 2: $86,760 (Major Swing Low)
• Invalidation: 4H Close above $94,760
🟢 Scenario B: The Demand Reclaim If the 1H structure holds, we squeeze the shorts.
• Trigger: Bounce from $92,102 (Bullish OB) with increasing volume
• Target: $94,760 (Range High) → $96,000 Extension
• Stop: Tight below $91,900
MY VERDICT Short-term structure is bullish, but the "fuel" (volume) is empty. I am leaning 68% bearish (expecting a sweep of the $90k FVG) unless we see a massive volume injection above $94k. Patience is the play, let the $92,100 level dictate the next move.
MARKET ROTATION WATCHLIST
📋 While Bitcoin consolidates in this premium zone, liquidity often rotates into specific altcoin setups that are lagging behind.
I am updating my watchlist today for coins that are showing cleaner structure than BTC.

BTCUSDT: Pullback Toward Demand ZoneHi!
Bitcoin is showing short-term weakness after failing to hold above the recent high. Price is currently trading below the local resistance area, suggesting a corrective pullback rather than continuation.
The highlighted demand zone around 90.4K–90.9K is a key area to watch. This level previously acted as resistance and was later flipped into support.
Key Levels:
• Resistance: 93.1K–94.4K
• Demand / Support: 90.4K–90.9K
Downside Target:
• 90,500 (primary demand zone)
As long as price remains below resistance, a deeper retracement into demand is likely. Reaction at support will determine the next directional move.

BTCUSDT.P - January 8, 2026Bitcoin is trading below former support at 90,000–90,200, which is now acting as firm resistance, keeping the short-term bias bearish. A short entry is favored on retracements into 89,850–90,050, with profit targets near 87,700–87,900 at the next major support zone. A stop-loss should be placed above 91,200–91,400, as a move back above this level would invalidate the bearish setup.

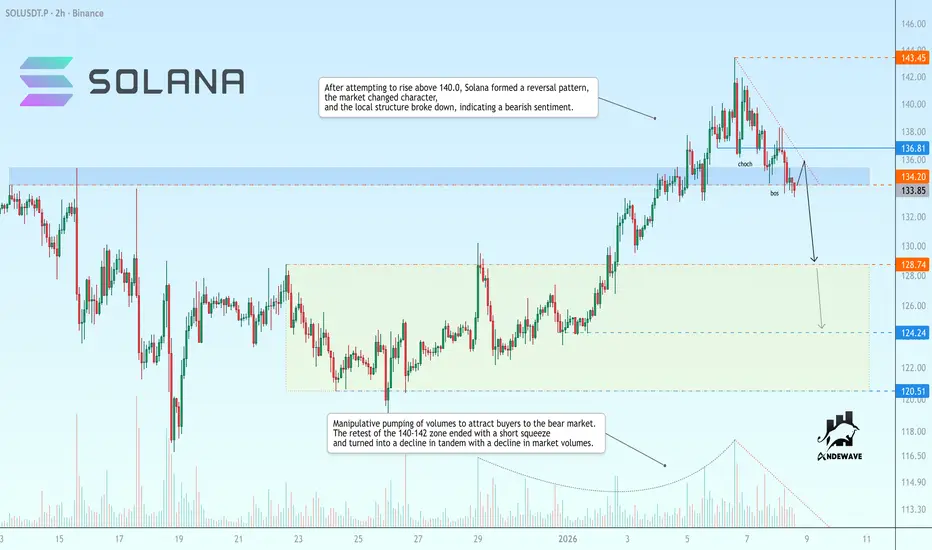
SOLUSDT is poised to break support before falling Manipulative pumping of volumes to attract buyers to the bear market. The retest of the 140-142 zone ended with a short squeeze and turned into a decline in tandem with a decline in market volumes
After attempting to rise above 140.0, Solana formed a reversal pattern, the market changed character, and the local structure broke down, indicating a bearish sentiment.
If the coin closes below 134, the market may intensify the sell-off and decline to 128.75 - 124.25
Scenario: A retest of 134.2 - 136.8 may confirm market weakness. If the price consolidates below this area, it may cause further price decline