Let the chart explainFirstly, HAPPY NEW YEAR!!
In terms of the chart, people seem not to understand - candlesticks provide a whole lot of info. The majority of indicators are reflections of old price action.
Last year I covered several posts on mechanical structures and the associated techniques. Here's one;
Let's give an example here using GBPUSD.
This is how you can simplify your trading.
First, identify the larger range.
There are two obvious things that stand out in this example; firstly the trend itself and secondly, the break of the structure that caused the new low.
The reason they are important is to show the momentum (orderflow), in other words, who's in control.
We could do this in several ways - the mechanical is just a simple way to allow you to repeat the same process almost on autopilot.
Once you can spot the obvious without much effort, the ranges become a lot easier and the analysis is done in under one minute.
Now I have my range, next step I can look for some rationale as to where and why a Pull Back is likely to come to.
For clarification
Just to show you, a simple way to do this is use the volume profile tool and just cover range high or low to the opposing high or low.
So why here?
Well, to understand this, there are some other interesting areas to look into, such as supply and demand (not for this post) but in simple terms, it was this supply that made the new low.
OK, so if you get this so far. Another post that might be useful for you is one of my posts from 2021 here on @TradingView. This, is a lesson on Dow Theory.
Once you understand the primary range is what was drawn, you can then shift your attention to the secondary trend.
If you remember, how we broke down the external range. You can now see an internal range formed.
If this low had been taken out - the story would be completely different. This would have given more reason for the Pullback to be over and done with.
But in the example, the low held and that means it is still in the Pullback phase. So, unless the larger range high in broken. Indicating a larger trend shift.
The logic is simple, look for changes of character on the smaller ranges and watch them fall like dominoes. Once the secondary trend switches to your favour (back down, in the example) then you have some good, high probability setups on the cards.
Happy New Year to you all, again!
2026 is going to be another AWESOME YEAR!!!
Disclaimer
This idea does not constitute as financial advice. It is for educational purposes only, our principal trader has over 25 years' experience in stocks, ETF's, and Forex. Hence each trade setup might have different hold times, entry or exit conditions, and will vary from the post/idea shared here. You can use the information from this post to make your own trading plan for the instrument discussed. Trading carries a risk; a high percentage of retail traders lose money. Please keep this in mind when entering any trade. Stay safe.
Btc-e

Is Bitcoin on the verge of a bullish move? (4H)This analysis is an update to the previous one, which you can find in the related analyses section.
The previous analysis is still valid, and Wave D of this diametric pattern needs to complete. Since trading volume was low and it was the end of the year, this move has taken longer.
I had marked a red line in the previous analysis, noting that as long as this line isn’t convincingly broken, the price cannot recover. In the past, every time the price approached this line, it was quickly rejected but now, after moving above this red line, it hasn’t been rejected yet.
We’ve marked Bitcoin’s targets on the chart.
Let’s see how it plays out.
If you have a coin or altcoin you want analyzed, first hit the like button and then comment its name so I can review it for you.
This is not a trade setup, as it has no precise stop-loss, stop, or target. I do not publish my trade setups here.

Bitcoin: Renewed optimism for 2026?The year 2025 was pretty tough for the crypto market, with significant corrections in the value of coins, however, it seems that the year 2026 started with renewed optimism. During the first trading day in this year, BTC moved from the $88K levels and tested the $90K currently strong resistance line. The question that currently remains is when the BTC will have strength to finally test the next resistance and strong psychological level at $100K?
The RSI finally managed to move above the 50 level, indicating that the market is slowly moving toward the overbought market side. At the same time, the MA50 continues to strongly diverge from MA200, indicating that there will be no cross in the near term period.
During the previous week the majority of market participants were on New Year’s holidays, in which sense, liquidity was not at higher levels on financial markets. Monday will be the day of the actual first trading week in this year, in which sense, it could be expected some increased volatility. If Friday's move was only a small reflection of the current market sentiment, then we can expect a final break of the $90K resistance level, where the next target for BTC will be the $95K up to $100K range. In case that geopolitics and macro data affect the market sentiment, in this case BTC will again shortly pull back toward the $88K. In any case, what the first trading day showed is that the liquidity is there and just waits for the right moment to return back to crypto.

BTC Macro analysis | The bigger picture | Long-term holdersCRYPTOCAP:BTC
🎯 Price remains in a shallow corrective phase, similar to previous price behaviour. Bitcoin remains up 420% since the 2023 bottom, and sentiment has never been this low for this long. Weekly RSI has now printed bullish divergence and tapped the weekly pivot, a strong bottoming signal. Wave 4 appears complete, wave 5 has a target of the weekly R4 pivot at $233000.
📈 Price is above the weekly 200EMA and pivot, demonstrating the bullish trend is intact. Weekly RSI bearish divergence has played out. Bitcoin RSI does not often reach oversold on the weekly.
👉 Analysis is invalidated below the weekly 200EMA, $73000
Safe trading

BTC 97-98K is possibleMorning folks,
Just we talked about bearish signs last time, BTC immediately has shown upside bounce. But I'm hurry up to disappoint you that bearish context is not off the table yet, say on weekly chart.
BTC shows splashes every time when some liquidity is injected. We know what has happened on 31 December and 2nd of January. RRP activity by US Banks and 75+Bln from the Fed. Obviously some part appears on crypto market.
This makes us consider upside AB=CD and "222" Sell pattern with possible target around 97-98K area. At the same time, AB-CD shape doesn't let us to say that bearish tendency is broken. It might be just a local retracement.
For position taking I would keep an eye on 90K support area. If BTC will reach 98K - we will think what to do next. But, as it can collapse at any moment as it has shown previously, let's just see what will happen

TradeCityPro | Bitcoin Daily Analysis #256👋 Welcome to TradeCity Pro!
Let’s move on to Bitcoin analysis. The market trend has started, and long triggers are being activated one after another.
⏳ 1-hour timeframe
Yesterday, Bitcoin made another bullish leg, and after breaking 89,040 and 90,373, it also activated the next trigger at 91,585.
✔️ At the moment, the zone Bitcoin has reacted to is 93,026, but the main resistance is located at 94,157.
📊 So far, we have had three entry points on Bitcoin, all of which are in profit, and from now on, any new entry on Bitcoin will be much riskier.
⚡️ For now, we can move our stop-losses up to the previous low at 91,118, and for taking profit, the next suitable zone would be 94,157.
↗️ For a new position, we can consider the break of 93,026 as a trigger, but the key point is that we have a major resistance at 94,157, which lies before Bitcoin reaches its target and can prevent this bullish wave from continuing, pushing the price into a correction.
🎲 For this reason, in my opinion, the 93,026 trigger is not very attractive and is quite risky, and personally, until 94,157 is broken, I won’t open any new positions on Bitcoin using another trigger.
🔽 As for short positions, the situation is completely clear: for now, we need to wait until a trend change occurs and a bearish structure is formed, and only then look for short triggers.
❌ Disclaimer ❌
Trading futures is highly risky and dangerous. If you're not an expert, these triggers may not be suitable for you. You should first learn risk and capital management. You can also use the educational content from this channel.
Finally, these triggers reflect my personal opinions on price action, and the market may move completely against this analysis. So, do your own research before opening any position.

Bitcoin at the Edge: Breakout Incoming or Another Trap $89000BTCUSD H1 chart, price is currently testing a key resistance zone around 88,800 – 89,000, an area that has previously triggered multiple rejections. The recent upward move represents a recovery leg within a broader range, rather than a confirmed breakout.
As price reaches this resistance, buying momentum is clearly slowing, with smaller bullish candles and immediate selling pressure appearing at the zone. This behavior suggests that sellers are still active, and the market has not yet accepted higher prices. Without a strong H1 close above this resistance, the current move lacks technical breakout confirmation.
The more probable short-term scenario is a rejection from resistance, followed by a pullback toward nearby support levels. Initial support is located around 88,200 – 88,000, with a deeper support zone near 87,700, where buyers previously stepped in. As long as price remains capped below resistance, the market structure continues to reflect a range-bound / consolidation environment.
In summary, this is not a confirmed breakout. Bitcoin is trading at a decision area where price must either produce a clean, impulsive close above resistance to confirm continuation, or face rejection and rotate back into the range. Until that clarity appears, bias remains neutral, with focus on price reaction rather than directional anticipation.

Bitcoin Is Not Escaping Yet — This Is H2 Accumulation Hello everyone,
On the H2 timeframe, the key focus right now is not an immediate breakout, but the fact that Bitcoin remains locked inside a broad accumulation range, where price continues to rotate between clearly defined support and resistance.
Structurally, BTC has spent an extended period compressing inside the 86,200–90,500 range. Multiple upside attempts toward the upper resistance zone have been rejected, while every pullback into the lower support zone has been absorbed. This repeated rotation confirms balance, not trend, and signals that liquidity is still being built.
From a technical perspective, price is currently holding above the EMA34–EMA89 cluster, which has acted as dynamic support during the recent recovery. The latest dip was defended cleanly and followed by a push higher, forming a support-and-retest structure around the 88,200–88,400 area. This behavior shows that buyers are active, but not yet aggressive enough to force acceptance above resistance.
Importantly, there is no structural breakout at this stage. Highs remain capped below the range top, and price action continues to print overlapping swings, typical of accumulation rather than continuation. The projected path on the chart reflects this well: a shallow pullback to retest support, followed by another attempt higher toward resistance.
Resistance zone: ~90,400–90,600 — range high and breakout trigger.
Mid-range support / retest: ~88,200–88,400 — current decision area.
Major support: ~86,200–86,500 — accumulation floor.
Invalidation: Acceptance back below the EMA cluster would weaken the constructive setup.
Only a clean breakout and sustained acceptance above the resistance zone would confirm that accumulation has completed and open the door for upside expansion. Until then, Bitcoin is not trending — it is absorbing liquidity and preparing, where patience and level discipline remain critical.
Wishing you all effective and disciplined trading.

Can Bitcoin Hold This Level?Hello Traders,
On the H1 timeframe, Bitcoin is currently trading back into a clearly defined resistance zone after recovering from the prior sell-off. The recent price action shows a series of higher lows, indicating short-term bullish pressure rebuilding as price rotates upward toward supply.
This resistance zone is a key decision area. Historically, this level has acted as a distribution zone, and price reaction here will determine whether the move develops into a sustained continuation or another corrective rotation.
If price manages to break above the resistance and hold with acceptance, the structure opens the path toward higher targets, as marked on the chart. In this scenario, continuation would likely unfold in stages, with upside extensions toward Target 1, then Target 2, and potentially Target 3, assuming structure remains intact.
However, failure to accept above resistance would likely trigger a pullback. A rejection from this zone could rotate price back toward the mid-range support levels. As long as price holds above the broader support zone, such a move would still be considered a corrective pullback within a developing recovery, not a full bearish reversal.
The bullish continuation scenario is invalidated if price decisively breaks below the marked support zone and shows acceptance below it. That would signal a structural failure and reopen the downside.
At this point, Bitcoin is not at a high-conviction entry area but at a decision zone. Patience and confirmation are required. Let the market show whether it accepts above resistance or rotates back toward support before committing to directional bias.
Share your view below.

Bitcoin broke the RESISTANCEBitcoin broke the resistance line eventually and its time to pump, but 94k is still a major resistance for short term

We LOVE this indicator!Our Power Band Oscillator Pro has been a real game changer for picking tops and bottoms and determining exhaustion levels, whether you’re already in a trade or looking to enter one. This is a great example of a recent short position we took on Bitcoin. Hopefully, this explanation shows why we see so much value in the Power Band Oscillator, which has taken us over six months to build and perfect.
Happy Trading!

Rising Wedge already done! Time to BUY BTC ?The Rising Wedge pattern has reached its target at 80% completion. The decline has actually touched the white shaded area marked as "exp stronger demand area 2," although the decline in this zone was relatively rapid and short-lived. Overall, I believe the downward trend in this Rising Wedge is likely limited. Even if a decline does occur, the swing low might open the opportunity for a double bottom pole position, triggering a stronger rally.
On the other hand, take a look at the RSI I marked! In previous periods, it was clear that every time the price began to saturate or become oversold, the RSI would cross over the moving averages, indicating a gradual price increase. This wasn't just one example, but also several other examples in the past.
Now, check the arrow marked on the current RSI and the current price. The RSI is starting to show signs of an impending crossover with the yellow moving average. Although the crossover hasn't officially occurred, it may be the first sign needed for the gradual start of an upward phase. Of course, the assumption of the white area as an alternative demand area is considered in the 73,624-80,277 zone, or the current area in the yellow shaded zone, around 86,491-92,829. As a safety measure, a stop-loss should be placed below the 69,666 support level, which previously served as resistance for the Cup & Handle pattern.
Caution!
Given that BTC is considered a risky asset, it is important to ensure a conducive environment for risk assets to rise, such as economic stability, expectations of interest rate cuts, or calm geopolitics. Otherwise, the bullish scenario is likely to fail!

BTCUSDT: Bullish Breakout from ConsolidationHi
BTC was moving sideways inside a clear rectangle, showing a period of consolidation and balance after the previous move. This range allowed the market to build energy. Price has now broken above the upper boundary with strong bullish candles, confirming a valid breakout. As long as BTC stays above the former resistance area, which should now act as support, the bullish structure remains intact. Based on the rectangle height, the next upside target is around 93,367 . A short pullback to the breakout zone would be normal and healthy, but a return inside the range would weaken the bullish outlook.

BTC/USDT – 4H Chart UpdateBTC/USDT – 4H Chart Update
Bitcoin is trading inside a rising wedge / ascending structure and has just made a strong bullish push from the lower trendline.
Price holding above short-term MAs
Higher lows structure intact
Bullish momentum is building near the resistance
Current Price: ~92.5K
Immediate Resistance: 94.5K – 95K
Major Resistance: 96.8K
Support Zone: 89K – 90K
Trendline Support: ~88K
Above 90K: Bullish continuation possible
Break & hold above 95K: Momentum could accelerate toward 96.8K+
Rejection near resistance: Expect a healthy pullback to trendline support
A 4H close below 88K would weaken the bullish structure.
Bullish while above key support
Trade with discipline & proper risk management

Bearish reversal off pullback resistance?GBP/JPY is rising towards the pivot and could reverse to the 1st support, which is a pullback support.
Pivot: 94,255.27
1st Support: 80,712.26
1st Resistance: 106,846.29
Disclaimer:
The opinions given above constitute general market commentary and do not constitute the opinion or advice of IC Markets or any form of personal or investment advice.
Any opinions, news, research, analyses, prices, other information, or links to third-party sites contained on this website are provided on an "as-is" basis, are intended to be informative only, and are not advice, a recommendation, research, a record of our trading prices, an offer of, or solicitation for, a transaction in any financial instrument and thus should not be treated as such. The information provided does not involve any specific investment objectives, financial situation, or needs of any specific person who may receive it. Please be aware that past performance is not a reliable indicator of future performance and/or results. Past performance or forward-looking scenarios based upon the reasonable beliefs of the third-party provider are not a guarantee of future performance. Actual results may differ materially from those anticipated in forward-looking or past performance statements. IC Markets makes no representation or warranty and assumes no liability as to the accuracy or completeness of the information provided, nor any loss arising from any investment based on a recommendation, forecast, or any information supplied by any third party

ETH — Price Slice. Capital Sector. 3410.61 BPC 5© Bolzen | The Architect | BPC Framework
Bolzen Market Institute
🏷 ETH — Price Slice. Capital Sector.
TradingView Publication Date: 05.01.2026
🏷 3410.61 — price not yet reached at time of publication.
🏷 BPC — The Bolzen Price Covenant — Strength Index: 5
Quantum structure of obligations and capital flow in price formation via energy blocks.
🏷 Vertical chart — Energy Grid Dashboard.
🏷 Static Stream 1: price published in energy-block production sequence.
🏷 The price energy block is already ordered—not by time, but by execution priority. Crucially: block priority dynamically reconfigures in response to hidden energetic impulses, whereas price execution order records their market manifestation. Every price in the dynamic stream is tied to proprietary energy-production metrics inaccessible to the general public. Those who perceive structure before its manifestation do not follow price—they anticipate it.
EΞ2Φ8Ψ45Θ·ζ⁻¹·106Λ732·Ω²
📎 Screenshot:
🏷 When trading from levels, use liquidity zones from BPC 10 and above.
🏷 Bolzen Liquidity Map — ETH (numerical equivalent):
🏷 I. Interactive Reference Guide: BPC — The Bolzen Price Covenant
🏷 P.S. English is not my native language — I offer no apologies for stylistic imperfections. What you see here is not a post. It is a demonstration of another level of preparation: the symbiosis of human intuition and algorithmic precision. Mathematics and aggressive market analysis — against the machine of liquidations.
— The Architect
BPC — The Bolzen Price Covenant

ETH — Price Slice. Capital Sector. 3223.30 BPC 10© Bolzen | The Architect | BPC Framework
Bolzen Market Institute
🏷 ETH — Price Slice. Capital Sector.
TradingView Publication Date: 02.01.2026
🏷 3223.30 — price not yet reached at time of publication.
🏷 BPC — The Bolzen Price Covenant — Strength Index: 10
Quantum structure of obligations and capital flow in price formation via energy blocks.
🏷 Vertical chart — Energy Grid Dashboard.
🏷 Static Stream 1: price published in energy-block production sequence.
🏷 The price energy block is already ordered—not by time, but by execution priority. Crucially: block priority dynamically reconfigures in response to hidden energetic impulses, whereas price execution order records their market manifestation. Every price in the dynamic stream is tied to proprietary energy-production metrics inaccessible to the general public. Those who perceive structure before its manifestation do not follow price—they anticipate it.
EΞ2Φ8Ψ45Θ·ζ⁻¹·106Λ732·Ω²
📎 Screenshot:
🏷 When trading from levels, use liquidity zones from BPC 10 and above.
🏷 Bolzen Liquidity Map — ETH (numerical equivalent):
🏷 I. Interactive Reference Guide: BPC — The Bolzen Price Covenant
🏷 P.S. English is not my native language — I offer no apologies for stylistic imperfections. What you see here is not a post. It is a demonstration of another level of preparation: the symbiosis of human intuition and algorithmic precision. Mathematics and aggressive market analysis — against the machine of liquidations.
— The Architect
BPC — The Bolzen Price Covenant

ETH — Price Slice. Capital Sector. 3196.84 BPC 2.9© Bolzen | The Architect | BPC Framework
Bolzen Market Institute
🏷 ETH — Price Slice. Capital Sector.
TradingView Publication Date: 29.12.2025
🏷 3196.84 — price not yet reached at time of publication.
🏷 BPC — The Bolzen Price Covenant — Strength Index: 2.9
Quantum structure of obligations and capital flow in price formation via energy blocks.
🏷 Vertical chart — Energy Grid Dashboard.
🏷 Static Stream 1: price published in energy-block production sequence.
🏷 The price energy block is already ordered—not by time, but by execution priority. Crucially: block priority dynamically reconfigures in response to hidden energetic impulses, whereas price execution order records their market manifestation. Every price in the dynamic stream is tied to proprietary energy-production metrics inaccessible to the general public. Those who perceive structure before its manifestation do not follow price—they anticipate it.
EΞ2Φ8Ψ45Θ·ζ⁻¹·106Λ732·Ω²
📎 Screenshot:
🏷 When trading from levels, use liquidity zones from BPC 10 and above.
🏷 Bolzen Liquidity Map — ETH (numerical equivalent):
🏷 I. Interactive Reference Guide: BPC — The Bolzen Price Covenant
🏷 P.S. English is not my native language — I offer no apologies for stylistic imperfections. What you see here is not a post. It is a demonstration of another level of preparation: the symbiosis of human intuition and algorithmic precision. Mathematics and aggressive market analysis — against the machine of liquidations.
📎 Architect’s Note:
I thank TradingView moderation for their constructive collaboration and for enabling the display of analytical artifacts in their evolutionary state. Publishing maps in prefactum mode is not merely a technique—it is a method of future verification through structure. This is BPC quantum analytics—The Bolzen Price Covenant.
The persistent ETH and BTC Energy Grid Dashboard remains publicly accessible and is intended for international institutional review.
🏷 PC-compatible international interactive link:
— The Architect
BPC — The Bolzen Price Covenant

Bitcoin Back to Bullish Trend after October LiquitdationBitcoin is showing signs of bullish price trend and momentum for the first time since the mid-October crypto liquidation event.
Price has logged 2 green candles and working on the third which are the first green candles since October 9th, indicating a shift to bullish price trend. Price is also above the 8, 13, 21 and 50 moving averages with the shorter averages crossing above the 50ma, indicating a shift to bullish price trend. During the decline and consolidation over the past few months, price also held above the April 2025 low which means that the long-term bull market is intact. This bull market has been in play since April 2023 when price crossed back above the 200-day average and marked the end of the post-FTX collapse bear market. We've been in a bull market since then when price was at $28k and as of now it looks like this October liquidation decline has just been another bullish pullback in an overall structural bull market.
The PPO indicator shows the green PPO line rising above a rising purple signal line, with the green PPO line crossing above the 0 level. When the PPO line is trending above the 0 level it indicates bullish momentum behind price.
The ADX indicator shows a rising green +DI line and it is above a declining purple -DI line which is another indication of a bullish price trend. The background histogram is green and rising which indicates increasing bullish price trend.
The TDI indicator shows a rising green RSI line, which is also trading above the upper Bollinger Band and crossing above the 60 level. Price is considered to have bullish momentum when the RSI is above 60, and in general you don't want to be short when the RSI is above it's upper Bollinger Band.
Overall, Bitcoin is looking the most bullish here since the October 2025 liquidation event.
Stay humble and stack Sats.

BTC CME Futures (Weekly) – Pullback Into Structural SupportWe have now closed our short position.
BTC has completed a corrective leg from the recent highs and is now reacting off major weekly trend support.
Key observations:
• Price has pulled back into the ascending weekly trendline that has held since the cycle low
• This zone also aligns with prior range value + horizontal support (~85k–90k)
• Momentum shows correction, not distribution – structure remains intact
Bias:
• As long as BTC holds above the weekly trendline, this looks like a high-timeframe higher-low rather than a trend change
• A sustained hold here opens the door for a continuation leg back toward 110k+, then ATH expansion
Invalidation:
• Weekly close decisively below trend support would shift bias to a deeper retracement toward the low-80s
Plan:
• Patience at HTF support
• Let price confirm before sizing aggressively
Trend intact until proven otherwise.

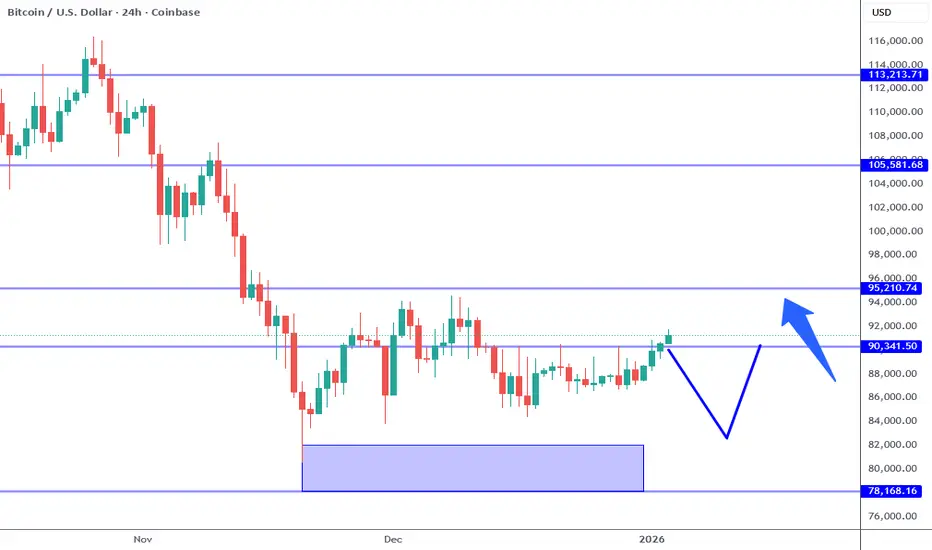
Bitcoin: Next Stop 95K?Bitcoin has held the 88K area support and is now attempting to push into the 95K key resistance. Can the momentum continue? That's up to Bitcoin to decide. Our job is to evaluate the price action for further evidence of momentum or not. From this point we can assess risk and figure out if an opportunity exists that aligns with our own style and risk tolerance.
The arguments for the bullish side are clear and coherent. I have no idea how anyone can assert a "bear" market, unless you are stuck on 1 minute charts and missing the big picture. Technically everything points higher. The 80K low on this time frame presented here is a higher low on the weekly and monthly time frames. Higher lows typically lead to higher highs. Price is trying to break out of the recent consolidation and test the 95K high. This is NOT characteristic of a "bear" market. We should be testing and breaking major supports effortlessly and price is NOT.
The 80K low to 95K high happens to be expressed as a spinning top candle on the monthly time frame. This indecision at a LOW point implies an absence of selling pressure. IF 95K is compromised, it will confirm the higher low and increases the probability of a retest of 100K or higher in the coming weeks.
On top of that, charts alone are only a SMALL piece of the puzzle. There is a very supportive and vibrant ecosystem, and economic environment for this asset class to grow and thrive. For example, now that the U.S. is going to be bringing more oil production online after acquiring Venezuela, I mean uh temporary management of the country, the price of oil is likely to go lower. This will bolster the argument for lower interest rates since energy is a major component of inflation. Combine this with a new incoming Yesman, I mean Chairman of the Federal Reserve, and we have a recipe for an easy monetary policy environment. Easy money means lower dollar, which means every thing goes higher like stocks, Gold, Bitcoin etc.
The 3 rate cuts recently will take time to process, at least half a year or more. Along with that, we have a plethora of major banks, hedge funds and other companies like Strategy pouring all kinds of money and resources into this market in the face of weakness. These types of situations where fundamentals and technical analysis are misaligned are uncommon AND often where longer term investment opportunities lurk. Things can change and anything is possible, but as traders and investors we have question the probability of one scenario over the other. And at the same time not be mislead of nonsensical forecasts aimed at simply monetizing attention.
From the swing trade perspective, Bitcoin can still reject the general 90K area resistance as my illustration suggests but this is a very short term view. IF such a pullback is confirmed, it should be viewed as another buying opportunity in my opinion, UNTIL the 80K support is cleared. As long as 80K holds in general, Bitcoin is more likely to break resistance levels. Watch for bullish reversal confirmation near the midpoint or lower part of the range. If taking a bullish break out of resistance, just be prepared for a fake out even if it is less likely.
Thank you for considering my analysis and perspective.
BTC NEXT CYCLEMy unpopular opinion about 2026–2027.
Somewhere closer to summer 2026 the world will look too perfect.
Green energy headlines.
Stable inflation narratives.
“Recovery is strong.”
“Markets are resilient.”
Unicorns flying through Bloomberg terminals.
Everything will feel clean, sustainable and under control.
That’s usually the moment when things break.
I don’t believe the next problem will start with crypto.
Crypto is just the first victim, not the cause.
Energy comes first.
When energy prices spike or supply becomes unstable, mining becomes unprofitable.
Not “less profitable”.
Unprofitable.
Bitcoin miners don’t mine ideology.
They mine electricity.
If energy costs explode or access becomes restricted, miners shut down, sell reserves, and survive.
Price doesn’t argue with survival.
That’s how you get pressure that has nothing to do with narratives, ETFs, or “long-term adoption”.
Just math.
I strongly believe we will see Bitcoin below $63,000 this cycle.
Most likely much lower.
A sub-$40,000 print before the end of 2026 or sometime in 2027 doesn’t sound crazy to me at all.
Not because Bitcoin is weak.
But because the system around it is fragile.
Energy stress doesn’t come alone.
Food follows.
Logistics, fertilizers, production costs, weather, geopolitics — pick any combination.
When energy shakes, food doesn’t stay calm for long.
And here’s the uncomfortable part:
People who say
“that can’t happen”
will struggle much more than people who simply ask
“what if it does?”
This is not about panic.
It’s about mental positioning.
You don’t need to predict the exact event.
You just need to accept that smooth narratives usually end violently.
Markets don’t crash when everyone is scared.
They crash when everyone feels safe.
This is not financial advice.
This is pattern recognition.

!!! URGENT WARNING !!!This is not intended to cause panic, but to provide awareness of a highly probable scenario developing today.
In our latest update, we highlighted liquidity resting near the weekly POC. This area also aligns with the Asia session high and low that have not been swept, as Asian markets have been closed for holidays since December 31. Today marks Asia’s first trading day of 2026.
Over the weekend, additional geopolitical news surfaced involving Venezuela and renewed market interference tied to Donald Trump. The timing of this news, combined with the current technical structure, increases short-term downside risk.
We are seeing a buildup of long exposure following the recent bullish price action, which has been constructive and rewarding for many traders. However, when paired with unswept Asia liquidity and a visible weekly POC below, conditions are present for a temporary liquidity sweep.
There is a high probability of an aggressive downside spike during the Asia open transitioning into London or New York. This would likely be a temporary move designed to rebalance liquidity rather than a trend reversal.
If you are holding long positions, ensure profits are secured and risk is managed appropriately. This is not a guaranteed outcome, but the probability is elevated enough to warrant caution and preparedness.
Regards,
ENTRYLAB
