TradeCityPro | Bitcoin Daily Analysis #252👋 Welcome to TradeCity Pro!
Let’s move on to Bitcoin analysis. The market is still ranging — even on New Year’s Eve!
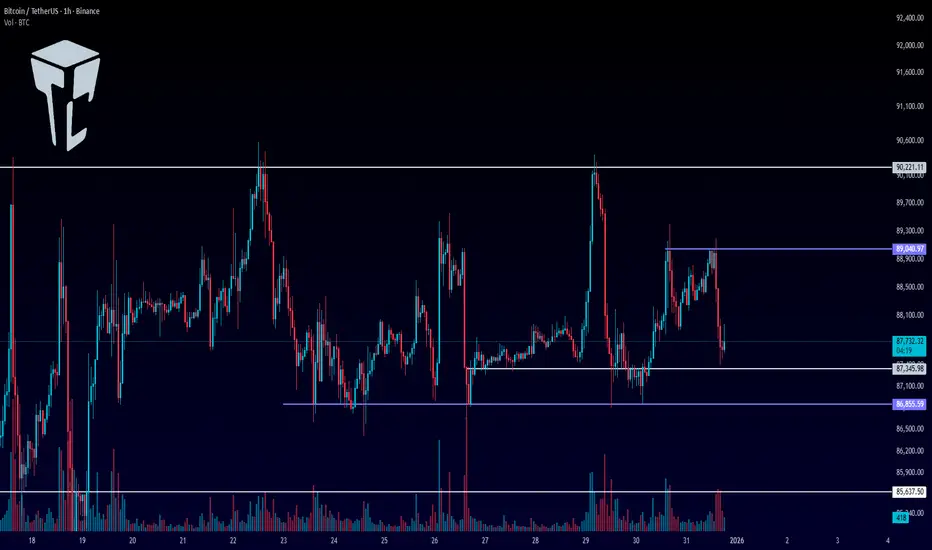
⏳ 1-hour timeframe
Bitcoin is still inside the range box it has been in over the past period and is fluctuating within this zone.
✔️ A high that formed for Bitcoin yesterday, which was tested twice, is the 89,040 area, and we can use it as a trigger today.
⚖️ If 89,040 breaks, we can open a very risky long position.The main trigger is still the break of 90,221.
✨ For shorts, our triggers have not changed compared to before.The breaks of 87,345 and 86,855 are both suitable triggers for short positions.
💥 The main short trigger on Bitcoin is 85,637.Given the low volume, I think until the Christmas holidays are over, the market won’t have any major moves. However, it’s very important to stay behind the chart so that we can open positions if the main triggers get
❌ Disclaimer ❌
Trading futures is highly risky and dangerous. If you're not an expert, these triggers may not be suitable for you. You should first learn risk and capital management. You can also use the educational content from this channel.
Finally, these triggers reflect my personal opinions on price action, and the market may move completely against this analysis. So, do your own research before opening any position.
Btc-e
$XAG > $BTC? The 1980 "Curse" is Finally Broken.We just witnessed history. Stop scrolling and look at the chart.
For 45 years, the $50 level was the "Graveyard of Bulls."
1980: The Hunt Brothers cornered the market, peaked at $50, and crashed.
2011: The retail mania hit $49 and collapsed.
Today, that ceiling is gone. NASDAQ:XAG hasn't just "broken out"; it has shattered the most significant resistance level in modern financial history. We are trading at $58+, well into price discovery mode.
The "No-BS" Reality: While CRYPTOCAP:BTC is fighting for its life to hold support during this liquidity crunch, Silver has done what "Digital Gold" promised to do but couldn't.
CRYPTOCAP:BTC Status: Flushing leverage, correlating with tech stocks, and failing to act as a hedge.
NASDAQ:XAG Status: Breaking a 45-year suppression cycle to become the #1 performing asset.
The Setup (The Cup & Handle of the Century): This is a 45-year technical structure. The "Cup" started in 1980. The "Handle" ended this month.
The Breakout: $50 is now the floor, not the ceiling.
The Target: The measured move from the 1980 peak targets $85.89 - $89.15.
My Outlook: The "Gold 2.0" narrative is being tested in real-time.
Long NASDAQ:XAG : I am riding this breakout to the $89 target.
The "Re-test" Buy: If we dip back to $50 (the 1980 High), that is a generational buying opportunity. Old resistance must become new support.
Verdict: The "relic" just outperformed the "future." The 1980 curse is dead.
👇 Discussion: Is CRYPTOCAP:BTC failing its "Gold 2.0" audition, or is this just a temporary rotation before Crypto catches up to AMEX:SLV & AMEX:GLD Sectors ? Let me know your targets below.

BTC/USD 1h chart review1️⃣ Uptrend broken
• The black upward trend line has been clearly broken down
• This is a change in the market structure (HH/HL → LH/LL)
• It's not just the wick - the candles have closed below
➡️ Short-term bias: bearish
⸻
2️⃣ Strong downward impulse
• One long falling candle + continuation
• No immediate rebound = weak demand
• This looks like a distribution + dump, not a correction
⸻
3️⃣ Key Levels (from your lines)
🔴 Resistances (now SELL / short area):
• 88,520 – 88,800
• 89,000 – 89,200
➡️ Until the price returns and stays above 89k, any upward movement is a pullback, not a trend.
🟢 Support:
• 87,650 (local – already tested)
• 87,400 – 87,200
• 86,750 (very important, lower support)
⸻
4️⃣ Stochastic RSI
• Came out of overbought
• Lines pointing strongly downwards
• There is no bullish divergence yet
➡️ Momentum is still down, no long signal visible
⸻
🧠 Scenarios (Highlights)
🟥 SCENARIO 1 – base (more likely)
Pullback → further decline
• The price returns to around 88,200 – 88,600
• Rejection (lack of volume, weak candles)
• Next move down:
• 🎯 87,200
• 🎯 86,750
➡️ This is a classic break & retest
⸻
🟨 SCENARIO 2 – consolidation
• Price holds 87,400 – 88,200
• Lack of volume
• “Grinding” before the next move

ZEC / USD – Daily – Structural Update (Bullish going into 2026)ZEC remains in a higher timeframe uptrend despite the recent pullback. The move lower from the recent highs is corrective in nature and fits within a rising channel structure that developed after the strong bounce from the $300 region. No daily lower low has formed, keeping the broader bullish structure intact.
The $300–310 zone remains the most important level on the chart. This area marks the macro breakout base and prior demand. As long as daily closes hold above this level, the bullish thesis remains valid and the trend favors continuation into 2026 rather than a full reversal.
Price is currently consolidating between roughly $450 and $550. This zone is acting as a compression area following the last impulse leg. Dips into the $420–450 region have been bought and continue to form higher lows, suggesting accumulation rather than distribution.
A sustained reclaim and hold above the $520–550 range would signal trend continuation and open the door for a move toward $600, followed by $680 and potentially the upper channel region near $750–800 over time.
Volume behavior supports this view, with expansion on upside moves and contraction on pullbacks. Momentum has cooled but remains constructive, resetting conditions for another expansion leg rather than signaling exhaustion.
The primary risk to this view is a daily close below $300, which would break the macro structure and invalidate the bullish continuation scenario. Until that occurs, this remains a buy-the-dip environment, favoring patience and entries on controlled pullbacks rather than chasing strength.
Overall bias remains bullish, with ZEC consolidating above its breakout base and positioning for potential continuation into 2026.

BTC - Where the 2026 Bottom Might Actually FormLet me be clear from the start.
This is not about calling a bottom today.
It’s about comparing this cycle to the previous ones.
📉 From a structural point of view:
Price is trading below the key moving average, and as long as that MA is not reclaimed to the upside, the trend remains bearish.
At the same time, momentum confirms this view.
The MACD has flipped bearish, which historically marks the transition from expansion into a corrective cycle.
In previous BTC cycles, the real bottom never formed until both conditions were met:
- MACD flips back bullish
- Price reclaims the moving average
Until that happens, we stay in a bearish or corrective regime, even if price bounces short term.
🧠 Now zooming out.
When you compare this structure to prior cycles, Bitcoin tends to:
• Correct deeply
• Find support at prior major resistance
• Reset momentum near long term demand
• Then flip trend again
On this chart, that area is very clear.
The green zone around 55k to 65k aligns with:
• Previous cycle highs
• Strong historical demand
• The lower boundary of the long-term rising structure
If history rhymes again, this is where we would expect:
• Momentum to stabilize
• MACD to start curling bullish
• Price to eventually reclaim the moving average
⏳ Timing wise , based on previous cycles, this process usually takes time.
That points toward late 2026, roughly October and beyond, not before.
⚠️ Disclaimer: This is not financial advice. Always do your own research and manage risk properly.
📚 Stick to your trading plan regarding entries, risk, and management.
Good luck! 🍀
All Strategies Are Good; If Managed Properly!
~Richard Nasr

BTC is stuck in a range. What should we do?While Bitcoin is stuck in a range, we need to wait for it to break out in one direction before trading from the specified zones. The market is not volatile. It's the holidays; exchanges are closed and people are relaxing. Clearly, there's no point in expecting anything from the market right now.
BINANCE:BTCUSDT.P

Bullish bounce off for Bitcoin?The price has bounced off the pivot and could rise to the 1st resistance, which acts as a multi-swing high resistance.
Pivot: 87,847.82
1st Support: 86,753.29
1st Resistance: 90,258.97
Disclaimer:
The opinions given above constitute general market commentary and do not constitute the opinion or advice of IC Markets or any form of personal or investment advice.
Any opinions, news, research, analyses, prices, other information, or links to third-party sites contained on this website are provided on an "as-is" basis, are intended to be informative only, and are not advice, a recommendation, research, a record of our trading prices, an offer of, or solicitation for, a transaction in any financial instrument and thus should not be treated as such. The information provided does not involve any specific investment objectives, financial situation, or needs of any specific person who may receive it. Please be aware that past performance is not a reliable indicator of future performance and/or results. Past performance or forward-looking scenarios based upon the reasonable beliefs of the third-party provider are not a guarantee of future performance. Actual results may differ materially from those anticipated in forward-looking or past performance statements. IC Markets makes no representation or warranty and assumes no liability as to the accuracy or completeness of the information provided, nor any loss arising from any investment based on a recommendation, forecast, or any information supplied by any third party

2025 Performance Review: Why Capital Rotated Into Metals 2025 Investment Landscape — Capital Chose Stability Over Speculation
The data in the image clearly shows a decisive shift in capital allocation during 2025. Precious metals significantly outperformed traditional risk assets. Gold delivered a +67.3% return, while Silver (+155%) and Platinum (+137.1%) posted exceptional gains. In contrast, the S&P 500 rose a modest +17.7%, and Bitcoin declined by −9.3%. This divergence reflects a year dominated by macro uncertainty rather than growth-driven risk appetite.
Why Metals Outperformed in 2025
Gold’s strong appreciation was driven by a combination of persistent inflation pressure, declining real yields, and rising geopolitical risk. Central banks globally continued to diversify reserves away from fiat currencies, reinforcing structural demand for gold. Silver and platinum benefited not only from monetary hedging flows but also from industrial demand tied to energy transition and supply constraints. Metals, unlike equities or crypto, offered both capital preservation and asymmetric upside.
Risk Assets Lagged — A Market Defined by Caution
The S&P 500’s gains were largely multiple driven rather than earnings-led, making returns vulnerable to tightening liquidity conditions. Bitcoin, despite prior cycle optimism, struggled as speculative capital rotated out amid regulatory pressure, reduced liquidity, and lower risk tolerance. The underperformance of BTC relative to metals highlights a clear preference for tangible, inflation-protective assets in this phase of the cycle.
Key Investment Lesson from 2025
Markets rewarded discipline, macro awareness, and defensive positioning. Capital flowed toward assets with intrinsic value, limited supply, and global monetary relevance. Gold acted as both a hedge and a performance asset not merely a safe haven, but a core portfolio driver.
Strategic Outlook for 2026 — Positioning with Structure, Not Emotion
Heading into 2026, the priority is balance and selectivity. Precious metals particularly gold should remain a foundational allocation, especially during periods of monetary easing or geopolitical stress. Tactical exposure to equities should focus on sectors aligned with real assets and cash flow resilience. High-volatility assets like crypto require strict risk control and confirmation from broader liquidity conditions before meaningful allocation.
Conclusion
2025 was a year where markets clearly signaled what they value in uncertain environments: protection, scarcity, and macro alignment. Traders who respected structure and capital flow thrived. As 2026 begins, the edge will belong to those who continue to follow capital not narratives.

Bitcoin Is Compressing — Range Control Before the Next ExpansionOn the 1H timeframe, Bitcoin remains locked in a well-defined range structure, capped by a strong resistance zone around $89,800–$90,500 and supported by demand between $86,800–$87,200. Price has repeatedly failed to achieve acceptance above resistance, while sellers also lack follow-through below support. This behavior confirms that the market is not trending, but rotating liquidity within a controlled environment.
From a market structure perspective, the repeated swing highs into resistance followed by sharp pullbacks suggest distribution rather than breakout pressure. Each push toward the upper boundary has been met with aggressive selling, indicating that larger participants are using higher prices to offload positions instead of initiating continuation. Until resistance is decisively reclaimed, upside moves should be treated as range highs, not trend signals.
The area labeled as the accumulation zone in the mid-range reflects prolonged consolidation with overlapping candles and reduced volatility. This is typical of a market waiting for external confirmation. Price acceptance here shows balance between buyers and sellers, but importantly, balance is not direction. A breakout from such zones requires volume expansion and structural follow-through, neither of which is currently present.
On the downside, the support zone around $86,500–$87,000 continues to act as a reliable demand pocket. Each test has produced a reaction, confirming short-term buyer interest. However, below this lies a stronger macro support near $85,200, which represents the level where bullish structure would be meaningfully threatened if broken. A clean loss of this zone would shift the broader bias toward downside continuation.
In summary, Bitcoin is in a classic range-bound environment. The market is compressing energy between clearly defined levels, and directional conviction remains absent. Until price breaks and holds above $90,500 or loses $86,500 with momentum, the optimal approach remains range-based execution and patience. The next impulsive move will come from resolution — not prediction.

BTC Is Stuck in a Range, and That’s Exactly the PointHello everyone,
On the H1 timeframe, the key focus right now is not a breakout attempt, but the fact that Bitcoin remains locked inside a well-defined accumulation range. Despite several sharp intraday moves, price continues to rotate between clear support and resistance boundaries, showing no structural commitment to a new trend yet.
After the previous impulsive rally into the 89,500–90,300 resistance zone, BTC was rejected aggressively, triggering a fast sell-off back into the 86,500–87,000 support zone. Importantly, this decline did not extend further. Instead of continuation lower, price stabilized and transitioned into sideways price action, which is typical behavior when the market is absorbing liquidity rather than trending.
From a structural perspective, there is no valid uptrend or downtrend on H1 at this stage. The market is printing range-bound swings, with highs capped below resistance and lows consistently defended above support. This tells us that sellers are active near the top of the range, while buyers are quietly absorbing supply near the bottom — a classic accumulation environment.
Technically, price remains trapped in the middle of the range, offering poor risk–reward for directional trades. The repeated failures near resistance and the lack of follow-through below support suggest indecision, not weakness. This type of structure often precedes an expansion phase, but direction cannot be assumed until the range is resolved.
Resistance zone: 89,500–90,300 — repeated rejections, strong supply present.
Support zone: 86,500–87,000 — demand holding firmly so far.
Range equilibrium: ~87,800–88,200 — noise area, best avoided.
As long as price remains inside this range, patience is the strategy. A clean breakout and acceptance above resistance would open the door for a bullish expansion toward the next liquidity pocket. Conversely, a decisive breakdown below support would signal that accumulation has failed and a deeper correction is underway.
Until then, Bitcoin is not trending it is preparing.
Wishing you all effective and disciplined trading.

Bitcoin Isn’t BREAK — It’s Being Trapped Between Liquidity WallsHi Traders,
BITSTAMP:BTCUSD is currently trading inside a clearly defined consolidation range between $85,000 and $90,000, with price repeatedly rotating between a strong resistance zone overhead and a well-defended support zone below. The chart shows that every attempt to push higher into the upper boundary has been met with aggressive selling, while downside moves stall once price reaches the lower demand area. This behavior confirms that the market is range-bound rather than directional.
From a price action perspective, the recent impulsive move into the $89,500–$90,000 resistance zone failed to gain acceptance. The sharp rejection that followed indicates the presence of strong supply and profit-taking at higher levels. Importantly, this was not followed by continuation selling, but instead by a drift back toward the middle of the range, a typical characteristic of balanced market conditions.
Structurally, BITSTAMP:BTCUSD is printing overlapping highs and lows on the 1H timeframe. There is no consistent sequence of higher highs or lower lows, which means neither buyers nor sellers have control. Price continues to rotate around the mid-range equilibrium near $87,500–$88,000, an area where liquidity is actively exchanged and where short-term traders dominate order flow.
The EMA 34 and EMA 89 are flat and tightly compressed, with price frequently crossing above and below them. This flattening of moving averages reflects momentum exhaustion and indecision, not trend strength. In trending markets, price typically respects one side of key EMAs; here, they act more as mean-reversion magnets.
From a macro standpoint, BITSTAMP:BTCUSD is lacking a strong directional catalyst. U.S. yields remain relatively stable, the USD is not making decisive moves, and there is no immediate Federal Reserve policy shift driving risk appetite. As a result, Bitcoin is responding primarily to technical liquidity zones rather than macro narrative, reinforcing the ongoing consolidation.
In conclusion, BITSTAMP:BTCUSD remains neutral and range-controlled, capped by heavy resistance near $90,000 and supported by demand around $85,000–$86,000. Until the market achieves a clean breakout with acceptance and volume, price is likely to continue oscillating within this range. In this environment, patience and discipline matter more than prediction, and trading decisions should be based on reaction at key levels, not directional bias.

BITCOIN STUCK in Accumulation ZoneBITSTAMP:BTCUSD remains in a range reaccumulation structure after rejecting the upper 89,800–90,300 resistance zone. The sharp impulse was followed by a pullback into the 87,000–87,500 support, where buyers are defending and price is stabilizing above the EMA cluster. Structure favors consolidation and rotation rather than immediate trend reversal.
As long as support holds, this looks like rebalancing before the next expansion, not distribution.
Resistance: 89,800 – 90,300
Support: 87,000 – 87,500
Range focus: 87,000 – 90,300
➡️ Primary: hold 87k → higher lows → rotation back toward 89.5k–90k.
⚠️ Risk: clean loss of 87k → deeper pullback toward the lower demand zone.

BTCUSDT.P - December 31, 2025Bitcoin is holding above a short-term support zone at 87,700–87,950, while the next major resistance is near 90,000–90,200. A long entry is favored on pullbacks into 87,720–87,920, targeting a retest of 89,800–90,100 at prior highs. A stop-loss should be placed below the lower support at 86,400–86,500, as a breakdown there would negate the bullish structure.

The "Siege" of Strategy (A Technical Reality Check)You want to talk about "Diamond Hands"? The chart suggests this isn't just a hold— it is a Siege.
Strategy ( NASDAQ:MSTR ) is the ultimate high-beta Bitcoin proxy. For a long time, leverage made it a hero. But right now, the technicals show that the same leverage is turning into a massive overhead weight.
Here is the data-driven reality of the current structure ( NASDAQ:MSTR Weekly Chart).
1️⃣ THE DATA: The "Vice Grip" 📉 We are witnessing a classic compression event. Price is being squeezed between two major technical levels:
The Floor (Support): Price is sitting exactly on the Yellow Baseline (Weekly SMA). This is the "Line in the Sand." As long as this moving average holds, the bullish trend is technically intact.
The Ceiling (Resistance): Look overhead. The candles are trapped below a dense cluster of Short-Term Moving Averages (Red/Purple lines). This represents "overhead supply"—investors looking to exit at break-even.
2️⃣ THE SIGNAL : Defensive Regime ⚠️ The chart has shifted from an Offensive structure (consistently making Higher Highs) to a Defensive structure (struggling to hold the lows).
The Implication: When an asset loses its short-term moving averages, the probability shifts from "Buy the Dip" to "Sell the Rally" until proven otherwise.
3️⃣ THE SETUP: Survival Mode 💀 Current price action is testing the Weekly Support, not bouncing from it yet. This is a critical juncture:
The Bear Case: If the Weekly SMA cracks, the "Air Pocket" opens up. There is very little structural support below this level, meaning price could enter rapid discovery mode to the downside.
The Bull Requirement: To invalidate this bearish pressure, price must reclaim the overhead resistance cluster. Until then, the path of least resistance remains lower.
🎯 THE VERDICT This is a "Don't Blink" situation. Technically, the floor hasn't broken yet, so the bulls are alive. But the structure is heavy. The technicals demand a successful defense of this baseline before any long-term entry can be considered safe. Watch the Yellow Line. If it breaks, the siege breaks.
⚠️ RISK MANAGEMENT MSTR is highly volatile and tied to BTC. A sudden spike in Bitcoin can invalidate technical bearishness instantly. This is NOT a recommendation to Short. It is a warning to watch the support level. Always use stop-losses.
👇 THE DISCUSSION: Do you think Saylor can hold the line here, or is the leverage unwinding? Let me know below!
🔥 Follow me for more institutional-grade analysis.
Disclaimer: This analysis is for educational purposes only and does not constitute investment advice, portfolio management, or a solicitation to buy any assets. Trading involves significant risk. Do your own due diligence.

What I Expect from 2026Scenarios • Markets • Levels • Positioning
First of all, I want to thank everyone for the activity under my previous post .
More than 300 likes are not just numbers to me — they show that you read, think, and ask the right questions. These are exactly the people who motivate me to keep sharing my perspective.
I don’t write for algorithms.
I write for those who want real results and understand that results come through process, discipline, and the right environment.
This text is not about fast growth or guessing the bottom.
It is about patience, structure, and working during moments of maximum pain.
In 2026, the market will be selective: opportunities will become fewer, and the cost of mistakes will be higher.
This is exactly when an advantage is built — by those who can wait and work systematically, not alone.
___________________________________________
Context and Philosophy of 2026
2026 is a year of reassessment and awareness.
A year when the market stops rewarding haste and illusions.
We are in a bearish phase, and according to my calculations, it will likely last almost until the end of the year. This is not a time for emotions or hope — it is a time for learning and preparing for the next cycle.
It’s important to accept a simple truth:
the market does not owe you opportunities every day.
No trade is also a position.
I’ve been in financial markets since 2009 and in crypto since 2016.
I’ve seen how every cycle looks different but ends the same way — disappointment and denial. That is exactly where the market pushes the majority in 2026.
___________________________________________
What Really Happened in 2025
2025 became the year of maximum institutional involvement.
ETFs, derivatives, structured products, and complex instruments fully integrated crypto into the global financial system.
And the global financial market is:
- highly competitive
- professional
- cold and calculated
This is not a place for belief — this is where capital positions, hedges, and extracts liquidity.
Crypto remains a young industry, but it is already playing by adult rules.
Many failed to understand this — and paid for it.
___________________________________________
The Main Mistake Most Will Make in 2026
Two things:
1. Believing in a quick reversal
2. Increasing risk in an attempt to “win it back”
Hope is the most expensive emotion in the market.
The market does not pay for hope — it pays for timing, structure, and execution.
Most people will leave not because the market is “bad,” but because they will break psychologically. I’ve seen it many times: different cycles, different faces — the same mistakes.
If you stay in the market, you must relearn it every cycle.
___________________________________________
Macro Environment and Market Conditions
Key factors I’m watching:
- interest rates
- regulation
- capital flow direction
- narratives that attract new liquidity
Regulation is neither an enemy nor a savior — it is reality.
Licenses, requirements, and rules are shaping a market that is becoming part of the global financial system.
2026 is a year of redistribution and accumulation, not growth.
Liquidity is fragmented. There are too many projects, too many tokens, and not enough capital for everyone. Stablecoins are growing, but still not enough to “feed” the entire market.
___________________________________________
Altcoins in 2026: My View
My position is strict and honest:
Most altcoins face collapse, cleansing, and increased regulatory pressure.
The reasons are clear:
- an excessive number of tokens
- fragmented attention
- constant unlock pressure
- funds sitting in long-term profit
- lack of sustainable economics
There will be exceptions — but they will be rare.
Paradoxically, memecoins (despite my skepticism) did one useful thing:
they forced people to learn on-chain analysis, search for inefficiencies, and track capital flows.
What remains structurally alive
RWA (tokenized real-world assets)
infrastructure
DeFi v2 as an alternative to the traditional system
At the same time, we must be honest: potential returns in altcoins are structurally declining compared to previous cycles.
___________________________________________
Bitcoin — Base Scenario for 2026 and Key Levels
My base scenario is continued pressure and bottom formation.
Capitulation will affect:
- traders
- investors
- miners
- funds
- large corporations
The market will be cleansed of large holders.
This process is always painful — and always necessary.
Key ranges
- base: 48,000 – 74,000
- extreme zones: 38,000 – 46,000
My operating logic
- the first meaningful accumulation zone is around 64k
- limit orders are placed lower
- buying only during moments of panic
- no rush, no emotions
There is an old saying:
“ We enter the market when there is blood in the streets .”
This is not drama — this is how asymmetric advantage is built.
Short squeezes are possible, but they will be short-lived.
Markets do not trend higher on disappointment.
In my view, the final deep phase of this cycle and the shift toward early bullish conditions align closer to September 2026.
___________________________________________
Other Markets and Diversification
One of the biggest mistakes crypto traders make is thinking the world ends with crypto.
Blockchain is infrastructure — not the entire market.
That’s why in 2026 I diversify across:
- gold
- oil
- indices
- stocks
- and only very selectively crypto assets
Other markets are:
- more liquid
- more structured
- often cleaner in execution
S&P 500
So far there are no clear reversal signals, but after new highs I expect correction or stagnation. The reasons are obvious: the AI bubble, debt pressure, and liquidity concentration.
Gold
A historical safe haven. The trend remains intact.
My long-term target is $6,000 ± $1,000.
DXY
Weakening is possible, but the dollar is likely to maintain dominance due to digitization and global settlement demand.
Oil
One of my key instruments. Expensive oil is not beneficial for the US, and I see no strong reasons for sustainably high prices in the short term.
___________________________________________
Narratives Beyond Crypto
The world is reaching the limits of energy supply.
Energy is becoming a strategic advantage.
Those who produce electricity efficiently will be in a strong position.
Alternative energy sources and the entire energy chain will play a key role.
AI is not just hype.
AI will drive breakthroughs in medicine, energy, data analysis, and financial markets.
Global instability is no longer a forecast — it is a condition.
We are moving toward a reset of global processes and agreements.
___________________________________________
My Trading Approach in 2026
- more cash
- short-biased trading when structure allows
- only selective entries
- waiting for panic
- minimized risk
If there is no setup - there is no trade.
That is discipline.
And one more thing: if you are tired - rest.
The market will not disappear.
Your capital and your mindset are your main assets.
___________________________________________
Personal Commitment and Community
In 2026, I will relaunch the Academy and deeply integrate AI tools.
For members of my community, the Academy will be free under specific conditions.
Discipline is not motivation.
Discipline is the ability to follow a plan regardless of emotions.
Growth is slow alone. It is faster in the right environment.
I am building a strong trading community where:
- thinking evolves
- on-chain capital flows are analyzed
- portfolios with limit orders are structured
- experience is shared, not illusions
Some of these portfolios have already started activating, and one position is around +15%. This is not luck — this is systematic work.
___________________________________________
One Honest Question
Ask yourself honestly:
Are you here to prove something to the market — or to achieve a sustainable result?
Because results only come through self-study, discipline, and a repeatable process.
___________________________________________
Final Thoughts
Markets reward preparation, not urgency.
Give the market time. Give the system time.
If you are still here in 2026 — you are already ahead of most.
The main task is simple: stay in the game.
Build positions when it hurts.
Grow when it is quiet.
Best regards EXCAVO

MACD at the zero lineHoliday volume has effectively stalled progress in Bitcoin’s anticipated advance. With MACD resting at the zero line, momentum is ready to coil, rather than exhausted, and technical conditions remain conducive to a renewed bid from traders closing out their year. In this environment, it would not take much participation for buyers to reassert control, as reflected in the chart below.

Bitcoin Setups: Smart Entry for Buy and Sell Positions (3H)Bitcoin Market Analysis: How Market Makers Banks and Governments Manipulate Price and Capture Liquidity
Market makers large financial institutions and even government entities often influence Bitcoin’s price movements to serve their own trading strategies. Their goal is to manipulate the market in a way that allows them to fill their own orders efficiently and enter positions at more favorable prices. Understanding this behavior is crucial for retail traders who want to avoid being caught on the wrong side of these movements.
As we have observed Bitcoin has been consolidating for over a month moving sideways within a specific range. During this period it repeatedly hits buyers’ and sellers’ stop orders creating temporary spikes or drops before continuing its range bound movement. These price actions are often small and controlled but they are deliberate. The key question we need to ask is why is this happening The answer lies in thinking like market makers rather than retail traders.
In this low volatility phase the main focus should be on identifying where liquidity resides. Market makers target areas where stop orders are clustered these are points where they can collect liquidity to fuel their next large move. On lower timeframes we’ve identified a critical stop zone between 90,154 and 91,600 dollars. This range represents a high probability area to look for sell short setups as market makers often attempt to trigger these stops to gather liquidity.
Why is it unlikely for price to break significantly above this zone at this moment On higher timeframes the long stops have not yet been triggered meaning sufficient liquidity has not been collected. Banks and institutional players are still filling their orders. Until this accumulation process is complete strong bullish moves are less likely.
Entering positions should always be strategic and aligned with proper risk to reward management. On our chart we’ve marked a setup that respects this principle. It is positioned where sellers’ stops are likely to be triggered allowing us to enter in alignment with market makers and institutional flows. This approach increases the probability of a successful trade while minimizing unnecessary risk.
Equally important is integrating trader psychology into your analysis. Technical analysis alone is rarely enough. The majority of trading success approximately 70 to 80 percent comes from understanding market psychology not just price patterns. Recognizing how other traders are likely to react to stops liquidity pools and market maker movements is essential to staying ahead in the market.
In summary successful trading in Bitcoin requires a combination of technical awareness liquidity analysis and psychological insight. Always think like the market makers anticipate where liquidity is concentrated and enter trades with calculated risk to reward setups. By doing so you can align yourself with the larger players instead of constantly reacting to their manipulations.
If the price does not reach the red zone and our sell position is not triggered, and then it reaches the green zone without hitting our sell zone, we will no longer enter the sell position. In this case, we will look for a buy/long in the green zone
We have two entry points for the position, allowing you to enter the sell position using DCA. There are also two targets; after hitting the first target, take some profit and move your stop to break even.
If you have a coin or altcoin you want analyzed, first hit the like button and then comment its name so I can review it for you.
This is not a trade setup, as it has no precise stop-loss, stop, or target. I do not publish my trade setups here.

How to interpret charts and trade...
Hello, fellow traders!
If you "Follow" me, you'll always get the latest information quickly.
Have a great day.
-------------------------------------
The Trend Check (TC) indicator is a comprehensive evaluation of the PVT, OBV, and StochRSI indicators.
Therefore, a breakout above the zero level indicates strong buying pressure and a high probability of a price increase.
The StochRSI indicator is a coincident indicator that can be used as a trading signal by quickly detecting overbought and oversold levels in a stock price.
The OBV indicator is a volume indicator that measures buying and selling pressure by adding the trading volume on days when the price is rising and subtracting the trading volume on days when the price is falling. It was developed based on the assumption that trading volume precedes the price.
The PVT indicator is a technical analysis tool that analyzes buying and selling pressure and trends in the market by reflecting both stock price movements and trading volume. It combines accumulated trading volume with price volatility to sensitively reflect market supply and demand and trends.
By comprehensively evaluating these indicators, it can be used to determine trading timing.
However, since the trend may fluctuate depending on whether the StochRSI indicator is in the overbought or oversold zone, the StochRSI indicator has been displayed accordingly.
If the StochRSI indicator enters the overbought zone, upside is likely to be constrained, and if it enters the oversold zone, downside is likely to be constrained.
Therefore, it is recommended to check the StochRSI indicator's fluctuations along with the TC indicator.
If the On-Bottom Volume (OBV) indicator is between the Low Line and High Line, the price is likely to move sideways.
Furthermore, if it rises above the High Line, it is likely to be bullish, and if it falls below the Low Line, it is likely to be bearish.
To confirm this, the On-Bottom Volume (OBV) indicator has been added separately.
In summary, if the TC indicator shows an upward trend or remains above 0, the price is likely to rise.
However, the movements of the StochRSI and OBV indicators are checked to determine whether the upward trend can be maintained or whether a downtrend will occur.
Therefore, for the price to continue its upward trend,
1. the TC indicator must show an upward trend above 0,
2. the StochRSI indicator must show an upward trend without entering an overbought zone, and
3. the OBV indicator must remain above its High Line or show an upward trend.
For the price to continue its downward trend, this is the opposite of the above conditions for a sustained upward trend.
If the StochRSI or OBV indicators show a different trend than the TC indicator, the price is likely to move sideways, so be mindful of this when trading.
-
Since most indicators are based on 1D charts, it's important to first check the movements of the 1D chart.
Next, it's best to trade by reflecting the movements of the 1D chart with the movements of the timeframe chart you're trading.
In other words, if the 1D chart shows an upward trend, you should trade based on the expectation that the price will rise on the timeframe chart you're trading.
Therefore, when prices are falling, it's best to trade with a smaller investment amount and a shorter investment period to react quickly (with a short stop-loss point). When prices are rising, it's best to trade with a larger investment amount and a longer investment period (with a more generous stop-loss point).
-
Auxiliary indicators should be considered as supplementary indicators, as their name suggests, in interpreting charts.
The key is to identify support and resistance points or ranges for the price and the movements of the M-Signal indicator on the 1M, 1W, and 1D charts.
To determine the overall chart movement, check the movements of the M-Signal indicator on the 1M, 1W, and 1D charts.
For the price to continue its upward trend, it must remain above the M-Signal indicator on the 1M chart.
If it fails to do so, a downward trend is highly likely, so you should consider a strategy to counter a bearish market.
If the price is below the M-Signal indicator on the 1M chart, it is recommended to shorten the investment period.
Consequently, it is also recommended to set a shorter stop-loss point.
For this purpose, the HA-MS indicator includes indicators designed to indicate support and resistance points.
The most representative indicators are the HA-Low and HA-High indicators.
The HA-Low and HA-High indicators are designed for trading using the Heikin-Ashi chart.
The HA-Low indicator indicates the low range, so if it encounters support, it's a buy signal.
The HA-High indicator indicates the high range, so if it encounters resistance, it's a sell signal.
To make this more clear, the DOM(60) and DOM(-60) indicators have been added.
The DOM(-60) indicator, like the HA-Low indicator, indicates the low range.
The DOM(60) indicator, like the HA-High indicator, indicates the high range.
Therefore, if support is found within the established DOM(-60) ~ HA-Low or HA-Low ~ DOM(-60) range, it's a buy signal.
If resistance is found within the established HA-High ~ DOM(60) or DOM(60) ~ HA-High range, it's a sell signal.
-
When assessing support at these points or intervals, adding the interpretation of the auxiliary indicators mentioned above will be a significant aid in determining support.
In other words, if price movements indicate support, but the auxiliary indicators do not support it, the price is likely to decline.
-
If you trade based on indicator movements, you may suddenly find yourself trading against them.
This happens because you prejudge the indicators' movements based on your own thinking and then trade accordingly.
To prevent this problem, it's important to ensure that all auxiliary indicators are moving in the same direction.
Also, while you can buy to some extent in spot trading, you should never initiate a trade based on price movements when trading short positions in futures.
This is because price volatility is higher when prices are falling.
Therefore, when starting a short position, it's best to initiate the trade at support and resistance levels.
-
We begin trading based on indicator movements or chart analysis, but we lose something.
That's our trading strategy.
When actually trading, we must first determine:
1. How long will the trading period be?
2. How much capital will we invest?
3. How will we conduct the trade?
If we simply analyze the indicator movements and charts without deciding on these factors, we are likely to trade in a state of constant anxiety.
This is because maintaining a stable mental state is more important than profit when trading.
A stable mental state during a trade increases the likelihood of a successful trade.
This is because it allows us to respond more effectively.
Therefore, establishing a basic trading strategy that suits your investment style is paramount.
By considering the investment period for the stock or coin you're considering, you can determine your investment amount accordingly and choose a detailed trading method.
Therefore,
1. Investment Period
2. Investment Size
3. Trading Method
When conducting a trade, consider the three factors above.
When investing for a medium- to long-term or longer, it's important to carefully manage your purchases to lower your purchase price.
If your average purchase price is high, it can be psychologically burdensome to trade with a medium- to long-term investment horizon.
Therefore, in this case, you should trade for shorter periods of time, generating cash profits while lowering your average purchase price.
Lowering your average purchase price isn't easy in the stock market.
This is because trading is done on a weekly basis.
However, the coin market allows for decimal trading, so you can lower your average purchase price by increasing the number of coins corresponding to your profit.
For coins corresponding to profit, you trade by purchase price. When profits are generated for each purchase price, you sell the amount equivalent to the purchase price (including transaction fees) for each purchase price, thereby retaining the remaining coins.
Since the purchase price of these remaining coins is 0, as the number of these coins increases, the average purchase price will decrease.
-
Investment size is crucial, as it determines how you allocate your total investment capital to conduct your trading.
If your investment is misallocated, even with high returns, actual profits may be small, and even with low loss rates, actual losses may be large.
Furthermore, the most important aspect of investment size is always maintaining a reserve fund.
The amount of reserve fund you should keep will vary depending on your individual investment style.
I recommend approximately 20% of your total investment capital.
This reserve fund is used for emergencies. If you start trading with this reserve fund, you must sell it quickly to secure the reserve fund.
Failure to do so can lead to extreme anxiety and the inadvertent execution of unintended trades.
Depending on your investment size, you should consider how many stocks (coins) you will trade at a time.
Investing in too many stocks (coins) can lead to a small purchase amount or simultaneous trading, which can hinder your ability to execute your trades effectively.
Therefore, you should always consider the number of stocks (coins) you can manage simultaneously.
Typically, the number of stocks (coins) you can manage simultaneously is 1-3.
Long-term investments, even if managed concurrently, often require time to respond, so they don't need to be included in the number of concurrent investments.
However, it's recommended to include mid-term and shorter investments in your concurrent management count.
-
Once you've chosen a stock (coin) based on your investment horizon and investment size, you can then proceed to detailed trading based on chart analysis and indicator movements.
Therefore, it's best to keep chart analysis as short as possible.
This is because prolonged chart analysis increases the likelihood of your subjective opinions incorporating them into your analysis, which can result in inaccurate chart analysis.
Furthermore, prior to chart analysis, if you first review non-chart-related issues (such as company news, politics, or the economy) and then analyze the chart based on those, you may end up basing your analysis on your own subjective opinions. Therefore, it's important to be mindful of this.
It's important to remember that over-information can actually be detrimental to your trading.
-
When developing a detailed trading strategy, I outlined the basic trading strategy of buying in the DOM(-60) ~ HA-Low range and selling in the HA-High ~ DOM(60) range.
By adhering to this principle, even if you don't achieve significant returns, I believe you'll be able to ensure consistent profits.
Looking at the basic trading strategy broadly, it follows a trading pattern within a box range.
However, the length of that box range is unknown.
To achieve significant profits, it is necessary to break beyond the box range.
Therefore, if the price rises within the HA-High ~ DOM(60) range, a stepwise upward trend is likely, transitioning into a trend trade.
Conversely, if the price falls within the DOM(-60) ~ HA-Low range, a stepwise downward trend is likely, transitioning into a trend trade.
However, it's important to note that a stepwise upward trend ends in a decline, while a stepwise downward trend ends in a rise.
In other words, while a stepwise upward trend is likely to lead to a significant upward trend, it also means a significant downward trend.
Therefore, when entering a trade during a stepwise upward trend, it's important to respond quickly to minimize losses.
Failure to do so could result in a significant decline, resulting in losses that are difficult to recover from.
Conversely, a continuous step-down trend is more likely to lead to a significant decline, but it also carries the potential for a significant rise.
Therefore, we must consider how to implement tranche purchases during a step-down trend to lower the average purchase price or secure more stocks (coins).
Therefore, we should execute more trades during a step-down trend.
However, in the stock market, tranche purchases during an actual downtrend can lead to a loss of purchases, so caution is advised.
In the coin market, transactions are processed in decimals, reducing the burden of trading.
This means that trades can be organized by purchase price and executed at each purchase price.
Therefore, in a step-down trend, it's important to execute trades at each purchase price to retain a profit-making number of coins (tokens). This can lower the average purchase price or increase the number of coins (tokens).
There are two ways to retain a profit-making number of coins (tokens): buying and then selling, or selling and then selling.
Any method is fine, but if possible, it's best to trade using a buy-then-sell method.
This is because a cascading downtrend ends in an uptrend.
Therefore, in a cascading downtrend, you should trade less aggressively and execute more trades.
Downtrends are more likely to exhibit volatility than uptrends, so buying and then selling may actually feel easier.
However, you should avoid being greedy.
The root cause of all losses stems from greed.
-
If you can consistently generate profits, regardless of the trading method, then that's the best trading method.
We invest a lot of time and money in finding this, and remain in the investment market.
Charts ultimately represent the movement of money.
Therefore, charts should always be the top priority.
The main problem with the stock market is that issues outside of the charts dominate the market.
This problem prevents investors from seeing the movement of money, and they are constantly being misled by things outside of the charts.
As the coin market is being incorporated into the stock market, I believe that many people are dragging the main problems of the stock market into the coin market, leading to a rise in new losses.
The biggest difference between the stock and coin markets is that coins are relatively unusable in real life.
Therefore, I don't think analyzing them like the stock market is appropriate.
In the stock market, too, capital movements are often reflected in charts, so it's best not to check news outside of the charts first.
Such news can be toxic to individual investors who lack the ability to gather and analyze information.
-
Thank you for reading.
I wish you successful trading.
--------------------------------------------------

LTCUSDT - Retest of the liquidity zone on a downtrendBINANCE:LTCUSDT.P is forming a local rally after breaking through resistance at 78.0. The market is bearish, but within the bullish run, the altcoin may test liquidity at 79.4 - 81.0.
Bitcoin looks weak, a rebound from resistance is forming, and Friday's daily bar indicates strong bearish dominance. A fall in the flagship currency could trigger a fall in LTC after a local rally...
LTC looks slightly stronger than the market. The target of such a rally may be hidden behind 79.4 - 81.0. In the current situation: global downtrend, low market liquidity, I see this as a manipulative hunt for liquidity before a decline.
Resistance levels: 79.4, 81.0
Support levels: 78.0, 77.0, 75.4
A retest of this resistance cluster could end in liquidity capture and a false breakout. Consolidation below 79.4 could trigger a reversal and a decline.
Best regards, R. Linda!

TradeCityPro | Bitcoin Daily Analysis #251👋 Welcome to TradeCity Pro!
Let’s move on to Bitcoin analysis. Bitcoin is still ranging, and the longer this ranging continues, the higher the probability of a move starting.
⏳ 1-hour timeframe
Yesterday, Bitcoin was supported from the support zone that had formed between 86,855 and 87,355, and currently, with increasing volume, it is moving upward.
✔️ Yesterday, with the break of 87,345, we could open a risky short position on Bitcoin, but the price was supported from 86,855 and started an upward move.
✨ Currently, the price is still inside the same range box between 86,855 and 90,221, with the difference that volume has increased with the start of the new week.
🔔 Bitcoin’s triggers have not changed yet, and we can still open a short position with the break of 86,855 and a long position with the break of 90,221.
🧩 For now, whatever trigger the market gives, I open short-term positions with it and take profits quickly.
🎯 If, along with the break of triggers, volume also increases, the probability of the move continuing increases, and we can open long-term positions as well by breaking the next triggers.
❌ Disclaimer ❌
Trading futures is highly risky and dangerous. If you're not an expert, these triggers may not be suitable for you. You should first learn risk and capital management. You can also use the educational content from this channel.
Finally, these triggers reflect my personal opinions on price action, and the market may move completely against this analysis. So, do your own research before opening any position.

Silver Already Showed The Playbook – Bitcoin Might Be Next!When you compare OANDA:XAGUSD and COINBASE:BTCUSD side by side, the similarity in structure is hard to ignore. Silver spent time consolidating, respected its higher lows, absorbed supply, and then expanded aggressively once the structure was confirmed. Bitcoin now appears to be in a very similar phase.
At the moment, Bitcoin is trading around $88,000. The previous all-time high sits near $126,000. The most recent major November low was formed around $80,700.
Importantly, price has not violated the $74,000 macro support, which remains a key level. This alone keeps the higher-timeframe structure intact and bullish.
What we are seeing right now is not panic or distribution. Pullbacks are corrective, momentum remains controlled, and price continues to hold above key demand zones. This behavior suggests compression and energy build-up, not exhaustion.
Silver already executed this sequence cleanly. Bitcoin has not broken down yet, and structurally, it is still behaving like an asset preparing for continuation rather than reversal.
There is, however, a macro risk that cannot be ignored. Rising geopolitical tensions, especially the risk of escalation between Iran and Israel with potential U.S. involvement, could change market dynamics very quickly. Events like these can override any technical structure.
That said, this analysis is based strictly on current price action and confirmed data, not on hypothetical scenarios. As long as price respects structure, the technical bias remains valid.
From a long-term perspective, if Bitcoin continues to respect its macro supports and resumes expansion, the broader upside zone I am watching lies between $200,000 and $280,000.
This is not a buy or sell signal. This is a structural comparison and a technical roadmap.
The market often looks uncertain right before the next major leg begins.
The real question is simple:
Does Bitcoin follow Silver’s playbook, or does macro risk step in first?
Let me know your view below.

UNI/USDT – Bullish Momentum Builds But Resistance Looms at $6.26Uniswap (UNI) has surged nearly 35% from its December 18th low, igniting stop-loss runs above prior swing highs and establishing clear upside momentum.
The rally left behind a bullish daily gap between $6.06 and $5.38, which now serves as a key support zone.
🗳️ This price action coincides with the start of a new governance vote, adding fundamental interest. However, $6.26 – where sellers last pushed back on Dec 20th – remains the critical resistance bulls must flip for continuation.
🔼 Bullish Targets (if $6.26 breaks):
$6.57 – Prior distribution zone (week of Nov 10).
$6.73 – Bearish daily gap (Nov 20).
$7.18 – Major resistance (week of Nov 17), where bears previously regained control.
🔽 Bearish Scenarios (if support fails):
$5.20 – December 17 open; key line of defense.
Below that: $4.86 (Dec 18 swing low) becomes vulnerable.
These levels also align with the mid-point of last week’s long wick, adding further confluence.
📊 Momentum favors bulls for now, but watch how UNI reacts at $6.26—it's the gate to further upside or potential rejection.

Bitcoin, LOcal long and after big drop!Bitcoin, Local long and after a big drop!
I still think that big drop is coming but before i woul be happy to sell bull trap at 95k -100k area and after drop below 74k
what's your thought abotu this idea?
