IREN Bear Divergence on the Daily, Deeper Pullback Ahead?NASDAQ:IREN appears to be pulling back locally in wave 4, filling the gap, with eyes on testing the daily pivot as support before continuing higher.
Price is significantly away from mean and catching continued momentum but this will fade as more people take profit.
Bearish divergence persists in the daily RSI and has been confirmed with the close below the signal line. If these signals fail it shows the strength of the momentum trend.
Continued upside target is playing the pivots to $40 and initial downside taregt is the previous all time high at $18.50
Safe trading
BTC-M

NFP Jobs Data Could Trigger $116K or $105K Bitcoin MoveBitcoin is testing a critical breakout above $112,168 as markets prepare for tomorrow’s Non-Farm Payrolls report. The 4-hour chart has shown positive momentum, with BTC clearing resistance at $110,918 and pushing toward $112,856. If bulls can hold above $112K, the roadmap opens to $114,189 and $116,072. But if Bitcoin loses momentum, supports sit at $110,918, $108,592, and the deeper zone near $105,320.
The jobs report could be the catalyst that decides Bitcoin’s next big move. Consensus is around 75,000 jobs, just above last month’s 73,000. A weaker report could boost risk assets like Bitcoin as traders price in more Fed cuts. But a stronger print could cool risk sentiment and pressure BTC back into support. Either way, volatility is coming, and these levels will be key.

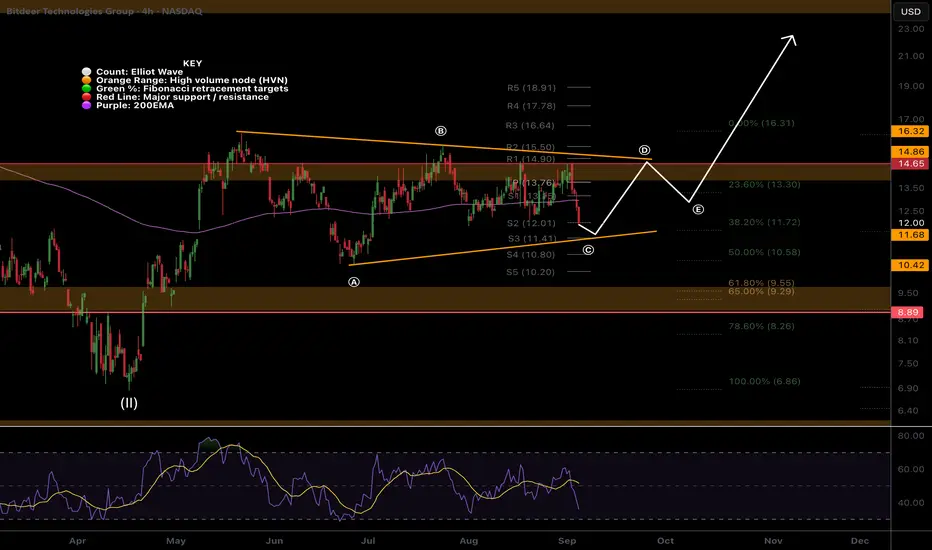
BTDR Still in a triangle, Wave c of (C) downNASDAQ:BTDR Bitdeer was rejected harshly on the 4th test of the High Volume Node (HVN) resistance, each test weakening the Node and adding probability to a breakout.
Wave c of an ABC within a triangle wave (C) appears to be underway with price closing below both the daily pivot and 200EMA. RSI has slight bullish divergence.
Until we get a break below wave (A) or a above wave (B) the analysis is good. Will readjust and update if anything changes. A breakdown below the triangle has a wave 2 target of the golden pocket Fibonacci retracement and HVN support at $9.63 and may offer a great buying opportunity.
Breakout target is the R5 daily pivot at $21.84
Safe trading
Bitcoin (BTCUSD) –> Retest Before the Next Drop?Hello guys!
After a strong run inside the ascending channel, Bitcoin has finally broken its trendline support. This is often the first warning that momentum is shifting from bullish to bearish.
Right now, price action is pulling back and looks ready to retest the broken trendline around the 111,300–111,400 zone. This level also aligns with a small supply area, making it an important zone to watch.
From a technical perspective, this retest could serve as the perfect setup for sellers to re-enter the market. If price gets rejected here, the next logical target sits at 109,857 , which is the nearest major support.
Scenario Outlook
🔼 Upside: Limited unless Bitcoin can reclaim 111,500 and hold above it.
🔽 Downside: A rejection at the retest zone opens the path for a move toward 109,857.
This makes the current structure look like a classic bearish retest setup: break → pullback → continuation.
📌 Scenario: Price touches the broken trendline, finds resistance, and then moves down toward 109,857 support.
Disclaimer: As part of ThinkMarkets’ Influencer Program, I am sponsored to share and publish their charts in my analysis.

Sine line methodHere im presenting you my personal "Sine line-method".
You go long or short at the peak of every sine line(bear market or bull market depending of course).
I also drew the log. trend curves to see potential bottoms/tops of the markets.
In ~3 years we will see the result.

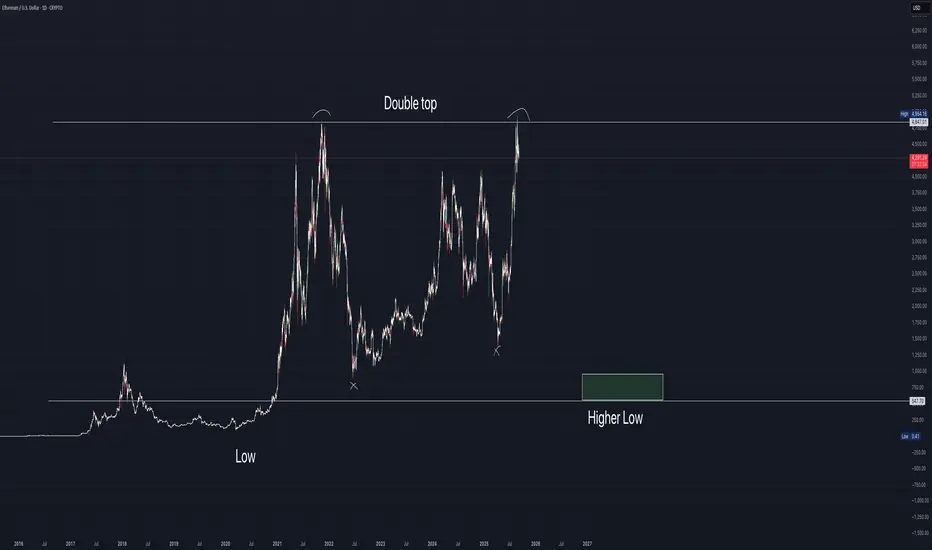
Ethereum ENDS all meme coins?We have a double top pattern here on eth the should end life of all memecoins and wash away the most if not all worthless projects from the blockchain even the first Defi project MKR is starting to be delisted. be careful out here
TradeCityPro | Bitcoin Daily Analysis #169👋 Welcome to TradeCity Pro!
Let’s move on to analyzing Bitcoin. It has had a very important reaction to the resistance zone we had, and we need to see which direction its next move will be. So stay with me as we review it.
⏳ 4-Hour Timeframe
After breaking its descending trendline, Bitcoin made a short upward move and reached the resistance zone.
🔍 However, once it touched this zone, the price was rejected and corrected down to 109577. This correction can extend further as a pullback to the trendline or even to the 107467 zone.
💥 If this deeper correction occurs and selling volume increases at the same time, the probability of breaking 107467 rises. This would not be favorable for Bitcoin’s bullish trend, and it would be better for this zone not to be lost.
📊 In case 107467 breaks with higher volume, we can open a short position. This would be considered a very risky trade, and I would personally put very little risk into it.
📈 On the other hand, if an upward move resumes and the resistance zone breaks, the price could begin a new bullish move toward higher resistances such as 117048, 119096, or even 122545.
📰 Tomorrow, the U.S. unemployment rate report will be released, which can significantly affect the market. The probability of a new wave beginning after this news is high, so make sure you’re on alert to have an open position if the market decides to move.

ETH/USDT | Hits $4950 ATH After 130% Rally – More Gains Ahead?By analyzing the Ethereum (ETH) chart on the weekly timeframe, we can see that, as expected, price has continued its bullish rally since our last analysis — successfully hitting all three targets at $4000, $4400, and $4900. With a remarkable 130% growth in just 77 days, Ethereum finally printed a new ATH at $4950!
Currently, ETH is trading around $4300, and as long as the price holds above the $3330–$3950 support zone, we can expect another strong bullish wave in the near future.
This analysis will be updated — stay tuned for the next move!
Please support me with your likes and comments to motivate me to share more analysis with you and share your opinion about the possible trend of this chart with me !
Best Regards , Arman Shaban

BTC Analysis 1H - Key Triggers Ahead | Day 32💀 Hey , how's it going ? Come over here — Satoshi got something for you !
⏰ We’re analyzing BTC on the 1-hour timeframe timeframe .
👀 On the 1H timeframe of Bitcoin, we can see that after yesterday’s news BTC moved upward but got rejected at the $112,300 zone. It then found support at the bottom of its ascending channel. Bitcoin is now waiting for tomorrow’s NFP release. The key level that price reacted to is $112,300 — a breakout above this zone could trigger another move to the upside. The current support is around $110,340, and if this level breaks, the next major support lies near $107,500.
⚙️ RSI key zones are at 36 and 70. If momentum breaks through these areas, Bitcoin could start a stronger move.
🕯 The size and volume of the recent red candles indicate selling pressure. However, when price bounced from the channel bottom, the bearish momentum weakened. If selling pressure increases and the support is lost, red candles may grow even larger.
📊 Looking at the 1H Tether dominance (USDT.D), after the recent drop it shows signs of a rebound and is completing its pullback on this timeframe. The key zones to watch are 4.39% and 4.47%. A breakout above these levels could bring significant trading volume into Bitcoin.
🔔 Alert zones for Bitcoin are set at $110,340 and $112,334. A breakout of either zone could provide us with trade opportunities. Keep in mind that the current structure is ranging and compressed, so it’s better to trade with lower risk.
❤️ Disclaimer : This analysis is purely based on my personal opinion and I only trade if the stated triggers are activated .

BITCOIN 4H Bullish Cross formed. Can it sustain a rally to 124k?Bitcoin (BTCUSD) just completed its first Bullish Cross on the 4H time-frame between the MA20 (red trend-line) and the MA50 (blue trend-line). Following a rejection after marginally breaching above the 4H MA100 (green trend-line), this pattern looks very similar to the Bullish Cross of June 25.
Both took place after a strong medium-term correction is the form of Channel Down patterns, with the Bullish Crosses getting formed after a Lower Highs break-out. If fact even the August 07 MA20/50 Bullish Cross led to a strong rally.
As a result, if BTC manages to turn its 4H MA100 into a Support, we expect it to initiate a new rally to test at least the previous High above $124k, similar to the July 03 High test. The 0.786 and 0618 Fibonacci levels can be used as Resistance and Support levels upon break-outs and pull-backs respectively.
So do you think this 4H MA20/50 Bullish Cross can kickstart a new rally? Feel free to let us know in the comments section below!
-------------------------------------------------------------------------------
** Please LIKE 👍, FOLLOW ✅, SHARE 🙌 and COMMENT ✍ if you enjoy this idea! Also share your ideas and charts in the comments section below! This is best way to keep it relevant, support us, keep the content here free and allow the idea to reach as many people as possible. **
-------------------------------------------------------------------------------
💸💸💸💸💸💸
👇 👇 👇 👇 👇 👇

Bitcoin at Decision Point: Will BTC Break 112K?Bitcoin remains range-bound on the 4-hour chart. The bullish case depends on holding support near 110,920 and eventually reclaiming resistance around 112,170 to open the path higher toward 114,200 and beyond. On the downside, losing 110,920 would shift focus to the 109,800–108,600 area, and a break below there could expose deeper supports near 105,300–104,800.
The main bias is still for more upside, but confidence comes only if resistance is reclaimed and momentum shifts back in favor of the bulls.

bitcoin's Situation (daily) !!!The price is at the channel's bottom, and if it follows the previous Pump from bottom of thechannel pattern, the price could reach the channel's top.
Best regards CobraVanguard.💚

Bitcoin New Analysis (4H)It seems that Bitcoin’s correction is not yet complete. After a slight upward retracement, the price is expected to drop again and move toward lower levels.
The bearish structure is still well intact.
For now, it’s better to track Bitcoin step by step while also paying attention to nearby support zones.
The expected path for Bitcoin’s next move has been outlined on the chart.
For risk management, please don't forget stop loss and capital management
When we reach the first target, save some profit and then change the stop to entry
Comment if you have any questions
Thank You

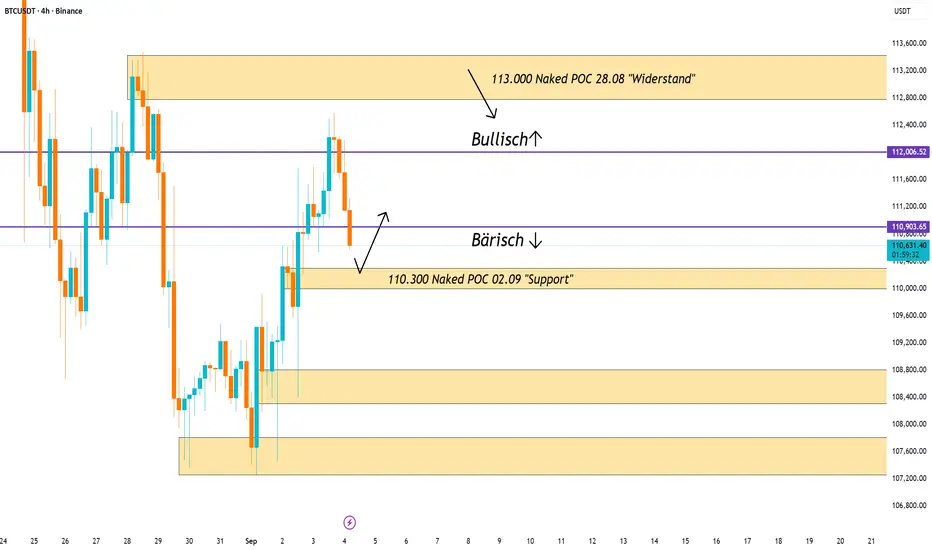
Bitcoin in the decisionBitcoin opened bearish today, and this outlook remains as long as we trade below 110,900.
At 110,300 we still have a naked POC from September 2nd, which should act as support. Since this level often acts like a magnet, I expect we might revisit it. It is important that this level holds – otherwise, a quick move down toward 108,600 could follow, which I see as the next real support.
If we somehow manage to reclaim 112,000, the picture flips back to bullish. In that case, a test of the naked POC at 113,000 would be the target, where I expect strong rejection.
BTCUSD BUY NOW 110650BTCUSD Long Setup
📈 Entry: 110700
🛡️ Stop Loss: 110400
🎯 Take Profit: 111600
Bullish momentum spotted near support zone. Targeting short-term breakout with tight risk control. Ideal for intraday scalpers and momentum traders.

Bitcoin pumps again!!Bitcoin is holding above the weekly 20MA and yellow trendline. With bullish divergence on the weekly RSI, it could surge in the coming weeks.

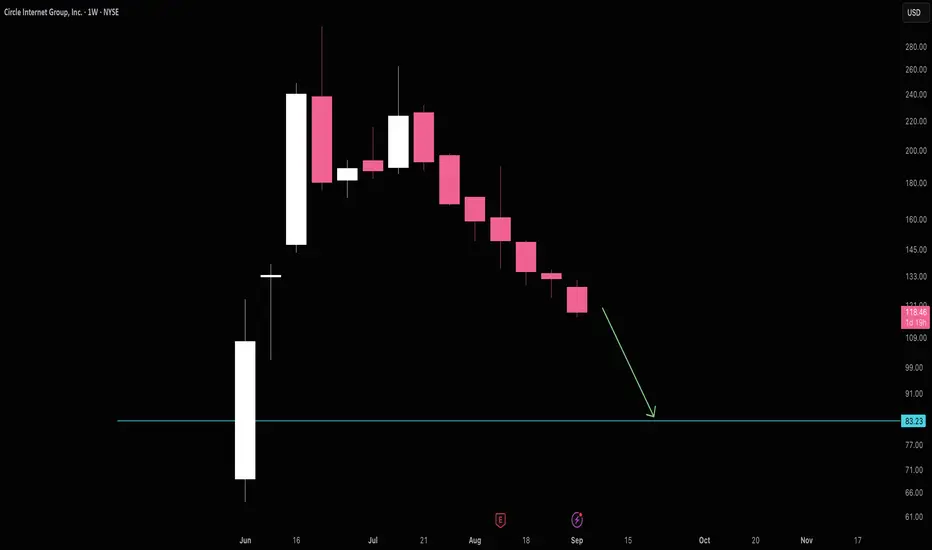
Circle appears to be heading to $83Circle seems to be in a steady decline towards $83. It's hard to say if it will hold there and find true support, but it's a good place to close shorts.
Good luck!
Check for support near 111696.21
Hello, traders!
Follow us to get the latest information quickly.
Have a great day!
-------------------------------------
(BTCUSDT 1D chart)
The TC (Trend Check) indicator appears to have risen above the 0 level.
Accordingly, the key question is whether support can be found around 111696.21.
For the uptrend to continue, the OBV indicator must rise above the High Line and remain so.
-
The volatility period in September is expected to occur around September 9th, September 19th, and September 28th.
-
Thank you for reading.
I wish you successful trading.
--------------------------------------------------
- This is an explanation of the big picture.
(3-year bull market, 1-year bear market pattern)
I will explain in more detail when the bear market begins.
------------------------------------------------------

BITCOIN SHORT FROM RESISTANCE|
✅BITCOIN is retesting a key resistance level of 113k$
So I think that the pair will make a pullback
And go down to retest the demand level below at 111k$
SHORT🔥
✅Like and subscribe to never miss a new idea!✅

BTCUSD 4h short-term📊 Trend and structure
• You can see the price output from the downward channel (orange trend lines). This is a signal of a potential change of trend.
• The price currently oscillates around USD 112,200, i.e. above several key supports (109,000 - 111,000).
• The nearest strong resistance is around 113,450 - 114,955 USD (marked with green lines and average SMA).
⸻
📈 indicators
• MacD: MacD (blue) line pierces above the signal (orange) and the histogram grows in the plus → it is a growth signal.
• RSI: ~ 60, i.e. it grows, but is not yet entering the purchase zone (> 70). There is still room for increases.
• SMA:
• Price has pierced short -term medium (red and green lines, ~ 109–112k), which works as support.
• The next key test is SMA around $ 114,955 - a puncture could open the road to 116–118k.
⸻
🔑 key levels
• Support:
• 111.014
• 109.023
• 107.580
• resistance:
• 113,450
• 114,955
• 116,000+
⸻
📝 Summary
• short -term (4h) - signals are upward: breaking from the downward channel, positive MacD, RSI is growing healthy.
• Bull scenario: Breaking above 114,955 opens the way to 116–118k.
• Bear scenario: unsuccessful puncture 113,450/115K → possible retest support at 111K and 109k.

TradeCityPro | Bitcoin Daily Analysis #168👋 Welcome to TradeCity Pro!
Let’s move on to the Bitcoin analysis. Yesterday Bitcoin made an upward move and has now reached an important zone. Let’s see how the market wants to react to this resistance.
⏳ 1-Hour Timeframe
Yesterday Bitcoin briefly faked a breakout of its trendline but then broke it again and also activated its trigger.
🔍 Currently, the price has reached the resistance zone and is trying to penetrate it. The volume has increased throughout this upward move, which shows the strength of the buyers.
📊 If you opened a position with the triggers we had, now is not a bad time to take some profit and secure your position. But definitely leave a portion of it open so that in case the zone breaks, you won’t be left without a position.
🔔 Even with the breakout of this zone, a new long position can be opened. This zone has a lot of sell orders, and if the price manages to push through them, it can begin a sharp upward move.
💥 The RSI oscillator is stabilizing above the 64.09 level, which is a very good sign for buyers and increases the probability of breaking the zone.
✔️ However, if this RSI level fakes out, the chance of rejection from the zone rises, and in that case, the price correction can continue down to the 110721 and 109577 levels.
❌ Disclaimer ❌
Trading futures is highly risky and dangerous. If you're not an expert, these triggers may not be suitable for you. You should first learn risk and capital management. You can also use the educational content from this channel.
Finally, these triggers reflect my personal opinions on price action, and the market may move completely against this analysis. So, do your own research before opening any position.

Ethereum 4H Range As we approach nearly a month in the range from $4000-4800 it looks like ETH is making a move once again.
Previously once hitting $4800 price gradually sold off back towards range low creating a bearish trendline, once the price broken above that level a rapid move up to range high within two candles.
Now looking at the chart we have a similar setup, strong breakout from the bearish trendline up into midpoint. Bitcoin currently retesting a key level of $112,000, should BTC flip this level I could see alts getting the greenlight to move up and Ethereum up to the highs.
Should BTC reject from $112,000 it makes sense that ETH range midpoint would be strong resistance, rejection could lead to a range low retest. Anything else that isn't either range high, range low or midpoint is noise and for me no action required, no need to over complicate it.

Ethereum - Eyes 5,600–5,800 After Holding Strong Near HighsEthereum (ETHUSD) remains in a clear uptrend, consolidating just beneath its all-time highs. After printing a record high in recent weeks, ETH has shown strength by holding its gains—a typical behavior in a trending market.
🔍 Technical Breakdown:
Trend: Bullish structure intact with higher-highs and higher-lows.
Price Action: ETH is coiling within a key resistance zone (4800–5000)—often a precursor to a breakout.
Momentum: One of the top-performing assets since the April 7 market low.
📈 Targets:
Short-term: 5,600–5,800 zone is the next potential target if the breakout materializes.
Medium-term: Eyes on 7,000, with an extended move to 8,000 still on the table if momentum accelerates.
⚠️ Macro Perspective:
As price moves higher, sentiment and targets naturally expand, fueling further speculative momentum. Caution is warranted—bull markets can persist longer than expected, but parabolic moves often end abruptly.
