BTC is Still Bullish (4H)After completing the X wave at the bottom of the chart, it appears that Bitcoin has formed a bullish diamond-shaped diametric pattern and is now at the beginning or middle of wave E within this diametric.
It is expected that, by holding the green-marked zone, the price will soon move toward the next targets.
We have set three targets for wave E, which are marked on the chart.
A daily candle close below the invalidation level will nullify this analysis.
For risk management, please don't forget stop loss and capital management
When we reach the first target, save some profit and then change the stop to entry
Comment if you have any questions
Thank You
BTC-M

BTC.DChart Overview (1D TF – BTC Dominance):
1. Pattern in Play: Rising Wedge (Bearish Bias)
The chart shows a rising wedge pattern forming with:
Support line (PA (D)s) in blue, sloping upwards.
Resistance line (PA (D)r) in red, also sloping up, but less steep.
This pattern typically has a bearish outcome, especially when formed during a downtrend as we see post-June.
Price is nearing the apex of the wedge, meaning a breakout (likely down) could be imminent.
2. Key Horizontal Support and Resistance Levels
Support at 60.27%: Price previously bounced from this level—very significant zone.
Resistance at 61.89%: Acting as a key ceiling; price got rejected here recently.
66.03% (Top Black Line): Major macro resistance and the 2025 peak trendline intersects near that level around October.
3. Trendlines and Long-Term Context
Macro Uptrend Support in red intersects around the 61.89%–62% zone in early October. If dominance holds this zone and bounces upward from the rising wedge, this trendline becomes crucial support.
Previous Uptrend Line (purple) was broken significantly in June, which triggered the sharp drop. BTC dominance lost momentum and is now in recovery/decision zone.
Interpretation:
Short-Term Bias: Neutral to Bearish
As price is within a rising wedge post-downtrend, the probability of breakdown is higher.
Failure to break above 61.89% again and maintain momentum suggests downside towards 60.27% or even 58.60%.
Medium-Term Possibility:
If price breaks down from the wedge, support zones are:
60.27%
Then 58.60%
If price breaks up, it will need to reclaim 61.89% cleanly, then test toward 64%–66%.
Macro Trendline Intersection (~Oct 13): Could be a major decision point aligning with fundamental crypto market catalysts. Dominance could break sharply above or below that time depending on broader crypto cycles.

BTC PA📊 Price Action Analysis
Rejection at Major Supply Zone ($120K)
Price reached a strong supply/sell zone between $120K and $123K, marked in red.
$120,000: Psychological round number — major supply area.
Price got rejected after multiple days of consolidation under this level.
Support, Resistance Levels and Trendlines
$116,010: Horizontal S/R — acted as temporary support, now resistance.
$111,999.79: Key horizontal support.
Blue PA (D)s trendline has been broken bearishly — indicating a change in short-term market structure.
Momentum is currently in a pullback/retracement phase after strong rally from late June to mid-July.
Volume Analysis
Volume is declining during the pullback — typical of retracements and not full-blown reversals.
No major volume spike indicating panic selling.
Fibonacci Retracement Analysis (Recent Swing High to Swing Low)
Key levels:
0.786: $117,820.25 — Rejected here.
0.618: $113,626.61 — Currently testing this level, price slightly above.
0.5: $110,681.08 — Next support if rejection at 0.618 persists.
0.382: $107,735.54
0.236: $104,091.07
0%: $98,200.00 — Full retracement base.
Price is showing hesitation at the 0.618, which is a crucial level in Fibonacci theory. A break and hold below this could accelerate the drop toward $110.6K and beyond.
RSI Analysis (Daily)
RSI is around 46.46 — moving below midline (50), showing weakening momentum.
Bearish divergence confirmed: price made a higher high while RSI made a lower high → bearish reversal signal.
Bullish if:
BTC reclaims $116K, closes above $120K — invalidates rejection.
RSI bounces from current level with volume support.
Bearish Bias:
Currently, structure broke down.
Testing 0.618 Fib level; failure here likely brings price to: $110,681

Bitcoin Dominance Hits Channel Floor – Altcoin Storm Incoming?Bitcoin dominance has been sliding within a well-structured descending channel since early August. Now, it’s touching the channel’s lower boundary — a level that has previously sparked strong reversals.
A bounce from here could ignite a short-term uptrend in BTC dominance, targeting the channel’s midline and possibly its upper boundary.
If this happens, capital is likely to rotate back into Bitcoin, applying pressure on altcoins and triggering a corrective phase in the broader altcoin market.
Key Takeaway: Watch for bullish price action at the channel’s floor. A confirmed breakout in dominance could mark the start of an “altcoin cooldown” phase.

ETHUSDT ShortThese are the key areas we are looking for on ETH 4H
Risk per entry 0.25%
Entry 1: 4250
Entry 2: 4450
TP 1: 3900 or Pivot 4050
TP 2: 3620
Full TP: 3320
SL: 4580
Always manage your own risk. None of the above is financial advice.

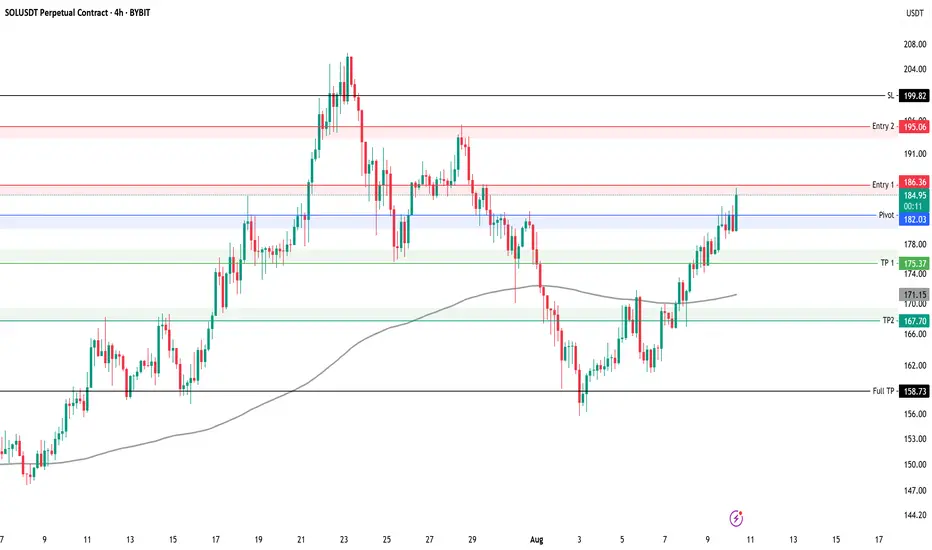
SOLUSDT Short Key levels to watch for SOLUSDT 4H
We have taken first entry on this setup using 0.5% risk
Risk per entry 0.5%
Entry 1: 186
Entry 2: 195
TP 1: 175
TP 2: 167
Full TP: 158
SL: 199
Always manage your own risk. None of the above is financial advice.
LDO Coin | Swing Long IdeaLDO | Swing Long Idea
📊 Market Sentiment
Overall sentiment remains bullish, supported by expectations of a 0.25% rate cut in the upcoming FOMC meeting. A weakening USD and increased risk appetite across global markets continue to create favorable conditions for further upside in crypto assets.
LDO is closely correlated with Ethereum’s price action. As ETH approaches all-time highs, fueled by a $1B single-day ETF inflow, LDO is also showing strong upside potential.
Additionally, market rumors suggest that the SEC may approve Ethereum staking policy soon — a move that would directly increase the utility of LDO in the future. This adds strong conviction to a long bias.
📈 Technical Analysis
Price has gained strong momentum alongside Ethereum’s bullish run.
We are approaching a HTF bearish trendline that has capped price for a while.
A breakout and close above this level would be a significant bullish signal.
📌 Game Plan
Wait for a clean break and close above the HTF bearish trendline.
Look for long entries on a retest of the breakout level.
🎯 Setup Trigger
After retest, wait for a 4H break of structure to confirm bullish continuation.
📋 Trade Management
Stoploss: 4H swing low that caused the break of structure
Targets:
TP1: $1.95
TP2: $2.43
Trail stops to secure profits as price moves in favor.
💬 Like, follow, and comment if you find this setup valuable!

$BTC - Trouble ZoneCRYPTOCAP:BTC | 4h
We cleared all buy-side liquidity on the left.
Now the question is whether we break through the 121k trouble zone or we see another rejection.
Key support: 118k
Key resistance: 121k — if it breaks, looking for 126–127k

BITCOIN H4 | Bullish bounce off 50% Fib supportBTC/USD is falling towards the buy entry whihc acts as a pullback support that aligns with the 50% Fibonacci retracement and could bounce to the take profit.
Buy entry is at 117,165.96, which is a pullback support that lines up with the 50% Fibonacci retracement.
Stop loss is at 113,331.94, which is a swing low support.
Take profit is at 122,526.14, which is a multi swing high resistance.
High Risk Investment Warning
Trading Forex/CFDs on margin carries a high level of risk and may not be suitable for all investors. Leverage can work against you.
Stratos Markets Limited (tradu.com ):
CFDs are complex instruments and come with a high risk of losing money rapidly due to leverage. 65% of retail investor accounts lose money when trading CFDs with this provider. You should consider whether you understand how CFDs work and whether you can afford to take the high risk of losing your money.
Stratos Europe Ltd (tradu.com ):
CFDs are complex instruments and come with a high risk of losing money rapidly due to leverage. 66% of retail investor accounts lose money when trading CFDs with this provider. You should consider whether you understand how CFDs work and whether you can afford to take the high risk of losing your money.
Stratos Global LLC (tradu.com ):
Losses can exceed deposits.
Please be advised that the information presented on TradingView is provided to Tradu (‘Company’, ‘we’) by a third-party provider (‘TFA Global Pte Ltd’). Please be reminded that you are solely responsible for the trading decisions on your account. There is a very high degree of risk involved in trading. Any information and/or content is intended entirely for research, educational and informational purposes only and does not constitute investment or consultation advice or investment strategy. The information is not tailored to the investment needs of any specific person and therefore does not involve a consideration of any of the investment objectives, financial situation or needs of any viewer that may receive it. Kindly also note that past performance is not a reliable indicator of future results. Actual results may differ materially from those anticipated in forward-looking or past performance statements. We assume no liability as to the accuracy or completeness of any of the information and/or content provided herein and the Company cannot be held responsible for any omission, mistake nor for any loss or damage including without limitation to any loss of profit which may arise from reliance on any information supplied by TFA Global Pte Ltd.
The speaker(s) is neither an employee, agent nor representative of Tradu and is therefore acting independently. The opinions given are their own, constitute general market commentary, and do not constitute the opinion or advice of Tradu or any form of personal or investment advice. Tradu neither endorses nor guarantees offerings of third-party speakers, nor is Tradu responsible for the content, veracity or opinions of third-party speakers, presenters or participants.

Bitcoin Near $125K Resistance — Is the Rally Over?Bitcoin ( BINANCE:BTCUSDT ) increased to $120,000 after breaking resistances , as I expected in my previous idea .
Bitcoin has already managed to break the Resistance zone($121,000-$119,000) and is moving near the Potential Reversal Zone(PRZ) .
According to Elliott Wave theory , Bitcoin is completing the 5th major impulse wave . In my opinion, this is the last bullish wave of Bitcoin, and after that we should wait for the main correction of Bitcoin . Do you agree with me that it is time to run and take profit!?
To get a better view of the main waves , I suggest you look at the idea below .
Also, since Bitcoin is correlated with the S&P500 Index ( SP:SPX ) and since I also foresee the possibility of a correction in the S&P500 Index, it is also possible to expect a decrease in the price of Bitcoin based on the S&P500 Index analysis .
I expect Bitcoin to start declining after entering the Cumulative Short Liquidation Leverage($125,000-$122,580) and Potential Reversal Zone(PRZ) and at least fill the CME Gap($119,100-$117,425) .
Note: There are heavy sell orders around $125,000.
Cumulative Long Liquidation Leverage: $120,866-$119,442
Cumulative Long Liquidation Leverage: $117,743-$115,452
What is your opinion on Bitcoin and its trend? Can it see $130,000, or will a main correction begin?
Please respect each other's ideas and express them politely if you agree or disagree.
Bitcoin Analyze (BTCUSDT), 2-hour time frame.
Be sure to follow the updated ideas.
Do not forget to put a Stop loss for your positions (For every position you want to open).
Please follow your strategy and updates; this is just my Idea, and I will gladly see your ideas in this post.
Please do not forget the ✅' like '✅ button 🙏😊 & Share it with your friends; thanks, and Trade safe.

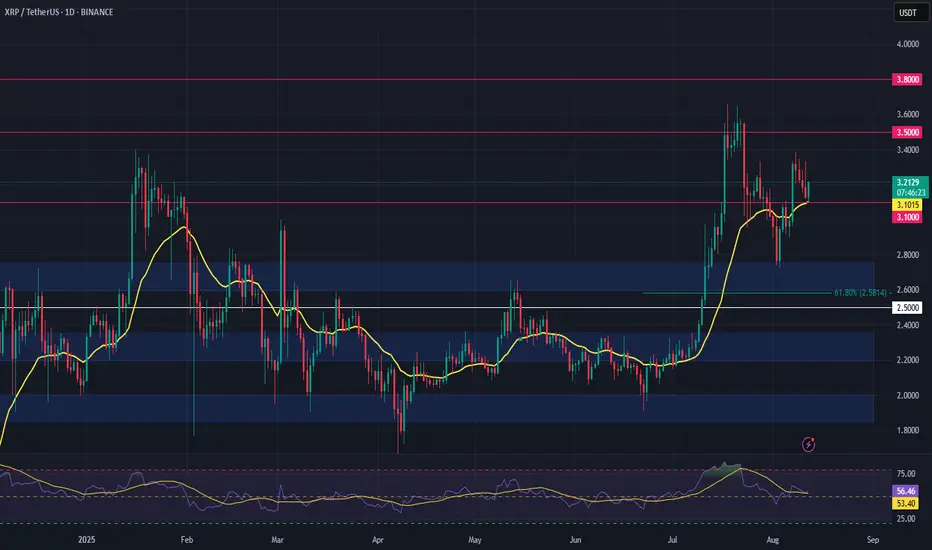
XRP Setup – Confluence Support Holding StrongXRP is holding above a major confluence zone, combining the 21-day EMA, the 61.8% Fibonacci retracement, and a flipped prior range high. This cluster often acts as a strong defense for buyers.
Trade Setup:
• Entry Zone: $2.60 – $2.75
• Take Profit Targets:
🥇 $3.10
🥈 $3.50
🥉 $3.80
• Stop Loss: $2.50
BTC 1H Analysis – Key Triggers Ahead | Day 9💀 Hey , how's it going ? Come over here — Satoshi got something for you !
⏰ We’re analyzing BTC on the 1-hour timeframe after today’s CPI release .
👀 Following the CPI news, Bitcoin broke through key areas — including the descending channel and the $117,000 resistance — and moved higher. It then faced rejection from the previous high, pulling back to around $118,000, which aligns with a multi-timeframe 4H SMA25 bounce. After that, it broke the $119,000 level and is now heading toward its key resistance at $120,000.
🎮 Fibonacci drawn from the current high to the price jump zone shows our current key level at 0.61, which is a relatively strong resistance. Breaking above this Fibonacci level could send BTC toward its current high and potentially lead to a new ATH.
⚙️ On the RSI oscillator, the key level is 70. Entering the overbought zone could push BTC toward its current high.
👑 The 99 MA is forming a strong base below the 0.37 level, while the 25 MA is working to break resistance and push price upward. On the 4H multi-timeframe view, the 0.23 area acts as a rebound zone after touching the 25 MA.
🕯 Volume and trade count are increasing, with solid consolidation above zones where whales have been buying and accumulating. Following today’s CPI results, fresh capital has flowed into risk assets like Bitcoin. This could be highly attractive for other coins, especially BTC pairs that are bullish in these conditions.
🔔 You can set an alert at the $120,000 area to watch price action when it reaches this level. If it matches your setup confirmations, you can open a position. Personally, I have a profitable long position on Ethereum, which is considered a BTC pair.
📊 On the 1H timeframe for USDT.D, we can see that after reacting to 4.20%, it faced a drop, and with a break below 4.10%, BTC could set a new high.
🖥 Summary: Bitcoin is moving toward its $120,000 resistance, where we could consider opening positions. The most important factor will be holding and confirming above this level.
❤️ Disclaimer : This analysis is purely based on my personal opinion and I only trade if the stated triggers are activated .

Bitcoin Dominance · Downtrend Continues (Bullish Bitcoin)The uptrend ended 27-July 2025 with the highest reading on BTC.D since January 2021. Back in January 2021 BTC.D was also bearish, dropping, and this bearish period in this index matched the strongest bullish action ever, the 2021 bull market.
Now, the bearish phase on BTC.D is intensifying. I am bullish on Bitcoin and the altcoins market.
Bitcoin Dominance being bearish does not mean Bitcoin is bearish, it means the altcoins are rising. When the altcoins are rising, Bitcoin is already high and will continue rising.
Two days closed green on BTC.D and today back red. A few days green, many days red. A new low each time, lower low. A lower high shows up each time... This is only the start.
A reading of 60% is nothing to be proud of if you are a bear. The truth is that Bitcoin Dominance being at 60% simply means that the altcoins market has still plenty of room for growth. For example, Ethereum can hit $11,111 and Bitcoin $200,000+. Targets need to be updated because we will have an extraordinary bull market.
» Many pairs have been growing for months, since April.
» Other pairs have been sideways for months, since April.
» While still others continued lower.
Soon, the entire market will move in one rhythm, one flow. And this flow is an up-wave. Rising prices for the long haul. The best scenario possible if you love Crypto. The strongest bullish cycle since 2021. Possibly the strongest ever.
Prepare for higher prices.
» Bitcoin Dominance (BTC.D) is going down.
» Bitcoin and the altcoins are going up.
Namaste.

THETA – Resistance Rejection, Targeting Accumulation Rang LowTHETA is currently showing signs of rejection at resistance from a lower high, indicating a potential move to the downside. This pullback could drive the price toward the bottom of its current accumulation range, where stronger support may be found.
📌 Trade Setup:
• Entry Zone: $0.70 – $0.75
• Take Profit Targets:
o 🥇 $0.95 – $1.00
o 🥈 $1.60 – $1.72
o 🥉 $2.13 – $2.25
• Stop Loss: Below ~$0.50

Btc anticpated downside - short term price action explainedHere is a 15 min chart to follow up on the daily chart below (chart originated Aug 9th)
Now that my uspide has hit (within 1% and within the expected timeframe)... I have outline the anticipated path down to my lower target (red) T1.
I will turn very bullish after my red target gets hit.
May the trends be with you.

TradeCityPro | Bitcoin Daily Analysis #151👋 Welcome to TradeCity Pro!
Let’s dive into today’s Bitcoin analysis. Earlier today, the highly anticipated U.S. inflation data was released — let’s see how it has impacted Bitcoin.
⌛️ 4-Hour Timeframe
Bitcoin continued its correction yesterday, and remained in a corrective phase until today’s U.S. inflation news hit the market.
✔️ The news came out in Bitcoin’s favor, and we are now seeing a bullish engulfing candle on the 4-hour chart with solid volume. If this candle can close with a slightly larger body, it would be a strong signal for a potential continuation of the uptrend.
📊 As long as the price holds above the 116,829 level, I consider Bitcoin’s trend in LWC to be bullish. On the MWC, we are still ranging, and on the HWC, Bitcoin remains bullish.
🔔 Currently, there’s a resistance level at 120,041, which was previously faked out from above. We need to wait for the next tests to identify the precise resistance line.
✨ If this resistance at 120,041 breaks, a long position could be considered. The main trigger for confirming an MWC uptrend would be a breakout above 122,733. However, I recommend aiming to enter on the 120,041 breakout instead, as waiting for 122,733 might be too late — the move would likely be sharp, with no ideal entry candle.
🔽 On the other hand, if the current candle turns into a wick and closes red, Bitcoin could enter a deeper correction toward the 116,829 and 115,364 zones.
💥 If RSI closes below 50, that would give a momentum-based confirmation of bearish conditions, increasing the likelihood of a corrective scenario as selling momentum builds in the market.
❌ Disclaimer ❌
Trading futures is highly risky and dangerous. If you're not an expert, these triggers may not be suitable for you. You should first learn risk and capital management. You can also use the educational content from this channel.
Finally, these triggers reflect my personal opinions on price action, and the market may move completely against this analysis. So, do your own research before opening any position.

Btc hit my upside target perfectly. Now retrace to downside T1?On Aug 9th, I suggested that Btc would break the downward trend and head up to my upside target (green T1). It did so the next day. I then anticipated a retrace to either T1 or T2 based on historical data (see chart below)
My upside target hit within 1%. So now...with the highest probability, Btc may now retrace into T1 (1st red box). There's always a chance it can go lower, but based on price action I expect a bounce at T1. We may not get T2 (even though there is a higher historical probability).
There is still that 12% chance Btc is just up only from here (with NO retrace into T1).
***Let me know what target you think will be hit (T1 or T2), or if you think up only from here.
May the trends be with you

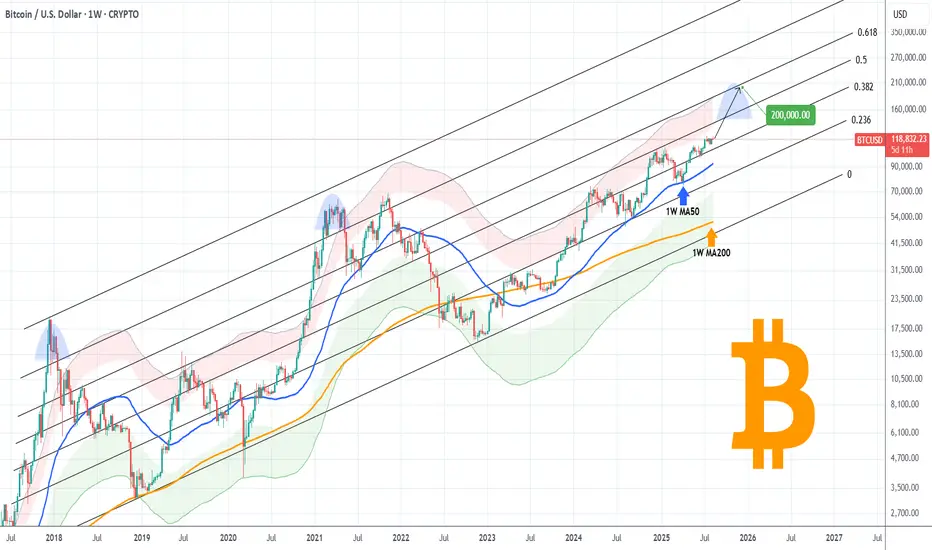
BITCOIN Can it break above this 3-year Resistance and hit $200k?Bitcoin (BTCUSD) is extending its main 1W MA50 (blue trend-line) fueled rebound, which only recently confirmed the continuation with a short-term bounce on the 1D MA50. The short-term setting is transferred now back to the long-term and the next Resistance, which is the middle (0.5 Fibonacci level) of the macro Channel Up, that has been dominating BTC's price action since late 2017.
The 0.5 Fib has made its last rejection/ failed attempt to break on December 16 2024. It's been holding as a Resistance since May 02 2022. The last two Cycle Tops however haven't only been priced above the 0.5 Fib but above the 0.786 level too (obviously as close to the Channel Top as possible).
As a result, if BTC does break above the 0.5 level, a 'mere' test of the immediate upper Fib (the 0.618) could be translated by the end of the year (timing of Cycle Top) to a $200k test. That would also be a test of the Top of the 1st SD above (red Zone) of the Mayer Multiple Bands (MMBs), which is technically still within high tolerance levels.
So do you think we can get near $200k by the end of the year if the 0.5 Fib breaks? Feel free to let us know in the comments section below!
-------------------------------------------------------------------------------
** Please LIKE 👍, FOLLOW ✅, SHARE 🙌 and COMMENT ✍ if you enjoy this idea! Also share your ideas and charts in the comments section below! This is best way to keep it relevant, support us, keep the content here free and allow the idea to reach as many people as possible. **
-------------------------------------------------------------------------------
💸💸💸💸💸💸
👇 👇 👇 👇 👇 👇
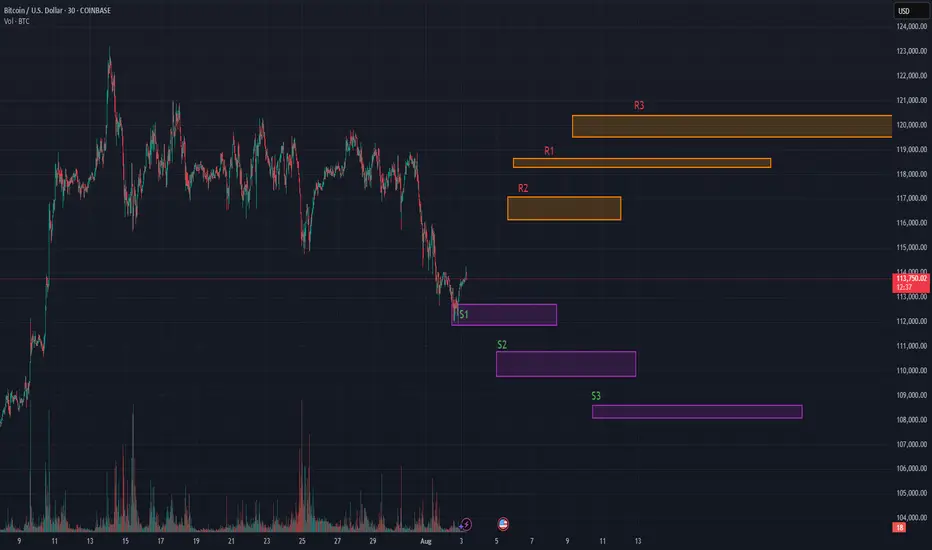
$BTC Breaking Down. Price bleeds, conviction doesn’t.Price bleeds, conviction doesn’t.
This was originally posted previously <24hrs but was hidden due to a link. Here is the pic of the original so you can see S1 bounced perfectly, lets see how much momentum we can get.
OG Thread continued..
Is this the dip worth buying?
BTC is retesting key quant support zones after a high-volume rejection near $116K. Despite the short-term dip, structure remains bullish from a mid-term lens.
• Quant Support Levels
• S1: $112,412
• S2: $110,935
• S3: $108,711
• Resistance Levels:
• R1: $116,113
• R2: $118,337
• R3: $119,814
On chain metrics:
• On-chain data confirms short-term holder capitulation into high-ownership clusters at $112K–$110K.
• Volatility contraction suggests a base-building phase, not a breakdown.
• Cup-and-handle formation remains valid on higher timeframes.
• Institutional Context:
• Accumulation increasing below $115K.
• Analysts projecting breakout potential to $129K–$133K if BTC can reclaim the $116.1K pivot.
Quant traders are eyeing this pullback as a healthy setup — not a breakdown.
I believe these are perfect accumulation levels anywhere in the blue square should be fine for a play to the upside.
Want Quant levels? Let me know!
$BTC Daily UpdateCRYPTOCAP:BTC #Bitcoin $122,809 resistance test rejected, $118,168 current support, 1D closed with bearish pin bar, Previous 4h also bearish with current 4H forming bearish engulfing, $116,908 next support from here, Current support test likely, if followed thru on a bearish engulfing then expect next support test.

Bitcoin Monthly Update + Top Altcoins Choice, Your PickThis is a monthly Bitcoin chart and is really interesting, it supports without a shadow of doubt a strong continuation and bullish bias.
First, the month started red but is now green. This is always a strong signal when the action starts bad but recovers quickly during the month just to end up good. Starts red to end up closing green.
Bitcoin also closed four consecutive months green. This one will be the fifth month. Since the bears already gave everything trying to push prices lower and failed, we know higher prices are guaranteed next.
We also know this because Ethereum just hit its highest price since December 2021, near the top of the last bull market. Now we have Bitcoin, XRP and Ethereum, the top three Cryptos and the biggest projects, moving forward and doing great.
It is only natural. It is the logical sequence, the smaller pairs/projects will do the exact same.
Just as XRP gained in bullish momentum and hit a new all-time high, to follow Bitcoin, Ether did the same. Then we have Solana and Cardano, Dogecoin, Toncoin, Polkadot, Shiba Inu, Avalanche, Notcoin, Chainlink, Bitcoin Cash, Uniswap and the rest.
They are preparing to grow now and are bullish now. Ready to grow and strong.
No more retraces, no more corrections; the 2025 bull market wave & bull run is getting close.
The next immediate target is $137,206. Notice how the $122,630 target on this chart was hit perfectly. So these numbers are good and work long-term.
» After $137,206, Bitcoin is set to hit $155,000.
(Leave a comment with your Top Altcoins Choice, I will do an analysis for you!)
Thank you for reading.
Namaste.

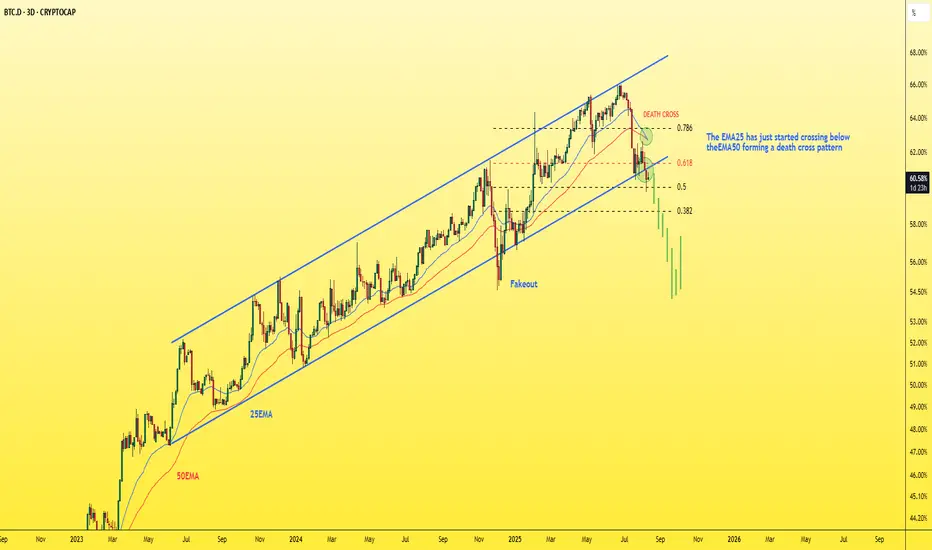
Dominance - Deep dive into Dominance chart!Did you know that dominance is on the verge of collapsing in the coming days? Let me tell you why.
🔸On the 3-day dominance chart:
- We have the beginning of a break of the ascending channel, a close below it, and a retest.
- There’s also a break of an important support level at 0.618 Fibonacci, followed by a retest, and it’s currently trading below it.
- Plus, we have a death cross where the EMA25 crossed below the EMA50.
That’s three confirmations on one chart — can you imagine?
The coming days will likely see a strong pump in altcoins. Remember my words.
Best Regards:
Ceciliones🎯
BTC Bitcoin Among My Top 10 Picks for 2025 | Price TargetIf you haven`t bought BTC Bitcoin before the recent breakout:
My price target for BTC in 2025 is $125K, driven by the following fundamental factors:
Regulatory Developments Favoring Adoption:
The anticipated regulatory shifts in the United States are expected to create a more favorable environment for cryptocurrencies. With the potential for pro-crypto policies under a new administration, including the establishment of Bitcoin as a strategic reserve asset by major nations, investor confidence is likely to increase significantly. Analysts suggest that such developments could drive the total cryptocurrency market capitalization from approximately $3.3 trillion to around $8 trillion by 2025, with Bitcoin poised to capture a substantial share of this growth.
Increased Institutional Demand through ETFs:
The launch of Bitcoin exchange-traded funds (ETFs) has already begun to transform the investment landscape for Bitcoin, making it more accessible to institutional and retail investors alike. Following the successful introduction of multiple Bitcoin ETFs in 2024, analysts project that inflows could exceed $15 billion in 2025, further boosting demand for Bitcoin. This increased accessibility is expected to drive prices higher as more investors seek exposure to the asset class.
Supply Constraints from Halving Events:
Bitcoin's supply dynamics are fundamentally bullish due to its halving events, which occur approximately every four years and reduce the rate at which new Bitcoins are created. The most recent halving in April 2024 has led to a significant reduction in supply inflation, creating scarcity that historically correlates with price increases. As demand continues to rise while supply becomes more constrained, this fundamental imbalance is likely to support higher prices.
Growing Adoption as a Store of Value"
As macroeconomic conditions evolve, including persistent inflationary pressures and potential monetary policy easing, Bitcoin is increasingly viewed as a viable store of value akin to gold. This perception is bolstered by its finite supply and decentralized nature, making it an attractive hedge against inflation. Analysts suggest that as more investors turn to Bitcoin for wealth preservation, its price could see substantial appreciation
