Bitcoin (BTC/USD) – Key Resistance Test AheadBTC is approaching resistance around 117,200 – 117,600 after a strong rally. A rejection from this zone may trigger a pullback into the 114,000 demand area before continuation higher.
🔑 Key Levels:
Resistance: 117,200 – 117,600
Support: 114,000 zone
Upside target: New highs if 117,600 breaks
⚠️ This is technical analysis, not financial advice. Always manage your risk accordingly.
BTC-M

Bitcoin will reach resistance line of channel and then dropHello traders, I want share with you my opinion about Bitcoin. The current market structure for Bitcoin is defined by a well-established upward channel that was formed after the price broke out of a prior triangle consolidation. This bullish pattern has been guiding the price action of BTC higher through a clear sequence of higher highs and higher lows between its dynamic support and resistance lines. The market has just completed another full upward rotation within this structure and is now positioned at a critical inflection point. Currently, the price is directly testing the upper boundary of the channel, which forms a powerful confluence of resistance with the horizontal 113500 - 114000 seller zone. This area has historically been a strong barrier where price has reversed on previous occasions. The primary working hypothesis is a short, rotational scenario, based on the expectation that sellers will once again defend this significant resistance confluence. A confirmed rejection from this seller zone would validate the integrity of the upward channel and likely initiate a new corrective swing to the downside, which would first need to break the current support level at 113500. Therefore, the TP is logically placed at 112400 points, a target that aligns perfectly with the ascending support line of the channel. Please share this idea with your friends and click Boost 🚀

EIGEN SHORT TERM be careful for trigger if it not triggered do not enter cause here is a bit critical under that line we may see a bearis movement Above white support eigen still chance to rise but my main target feels like a bit far so you may want to close some at tp 1
Always manage your own risks this is not a investment advise I am not responsible neither your loss nor profit.

BITCOIN PREDICTION: NEXT MASSIVE MOVE TO HERE - INCOMING!!!!!!!Yello Paradisers! In this video, we have been going through multi-time frame analysis as professional traders using Elliott Wave Theory and other advanced technical indicators and analysis techniques.
On the ultra-high time frame, we have been going through the Elliott Wave price section since 2023. We have taken a look at the Moving Average Trendline Touch, which worked perfectly, the Channel Retest that is incoming, and the Bearish Divergence with Bearish Cross.
On medium and high timeframe charts, I have been sharing with you the completed zigzag and first wave. We are currently in the secondary wave, waiting for it to finish, along with resistances and bullish and bearish divergences.Together with that, there are shooting star patterns, and on a low timeframe, I have been sharing with you the triple top reclaim and the next possible resistances, and what the next resistance and target are from a multiple timeframe perspective.
Paradisers! Keep in mind to trade only with a proper professional trading strategy. Wait for confirmations. Play with tactics. This is the only way you can be long-term profitable.
Remember, don’t trade without confirmations. Wait for them before creating a trade. Be disciplined, patient, and emotionally controlled. Only trade the highest probability setups with the greatest risk to reward ratio. This will ensure that you become a long-term profitable professional trader.
Don't be a gambler. Don't try to get rich quick. Make sure that your trading is professionally based on proper strategies and trade tactics.

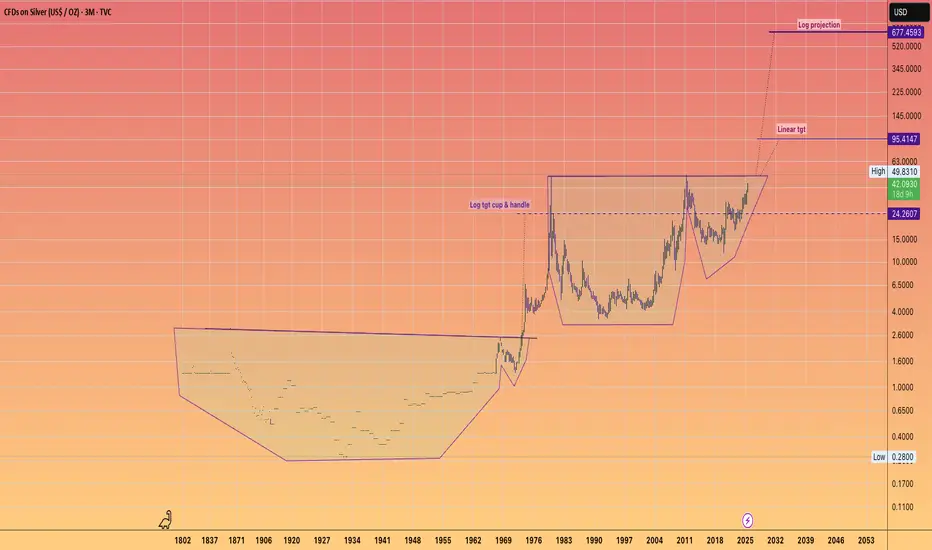
SILVER Accelerating to $95This is the full history of Silver.
With it's two GIANT Cup & Handle Patterns.
Big Patterns = Big Moves !!!
I find myself uncertain about the kind of world we would inhabit if Silver were to achieve the LOG projections in a chaotic disorderly manner.
We are undoubtedly stepping into a period of significant transformation across various sectors for global society in the coming decade or two.
Finance. Governance, Technology—let's seize the moment and take full advantage of the incredible opportunities available to us.
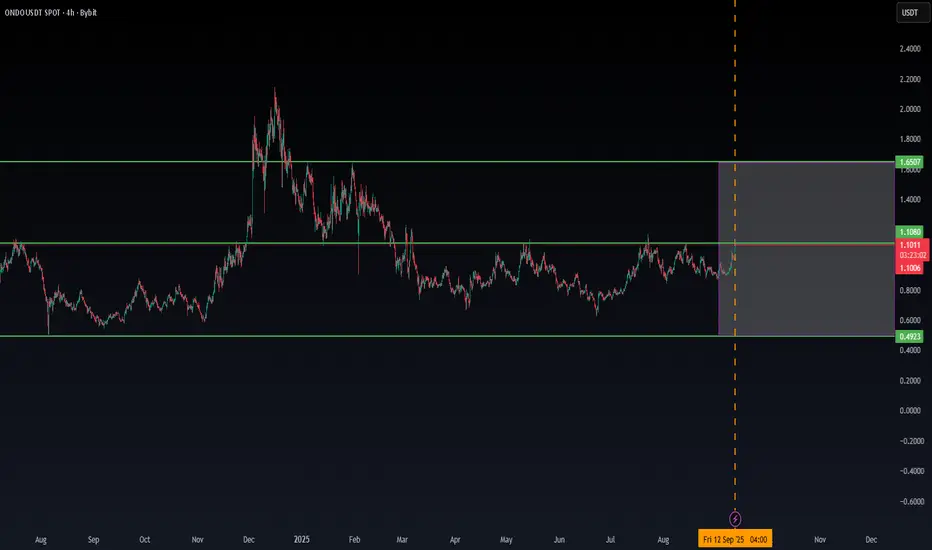
ONDO/USDT NEW INCREASE VOLUME💎Last data show that ONDO has the chance to break in the coming time on the low time frame.
We will follow up on this reason, ONDO to check for confirmations.
PPI Shock Pushes Bitcoin Higher – Fake Pump Before Drop?Bitcoin ( BINANCE:BTCUSDT ) has been making high momentum Sharpe moves over the last few days , which has made it a little difficult to trade, which is why I am still sticking to my previous analysis , and this analysis is an update of targets and even new entry points .
Bitcoin is currently moving near the Resistance zone($114,720-$113,580) , Reversal Zone(PRZ) , Cumulative Short Liquidation Leverage($114,510-$113,771) , Monthly Pivot Point , and Resistance lines = a set of Resistances
A few minutes ago, the US Core PPI m/m and PPI m/m data were released, which triggered a pump in Bitcoin . In my view, we should wait for Bitcoin to digest this shock and then continue its real trend .
Do you agree with me?
In terms of Elliott Wave theory , it seems that Bitcoin has completed microwave 5 of microwave C of the main wave Y , and we can expect a downtrend .
I expect Bitcoin to drop again to at least $111,600(First Target) .
Second Target: $110,883
Third Target: $110,000 and more dumps.
Stop Loss(SL): $114,923(Worst)
CME Gap: $117,235-$113,800
Cumulative Long Liquidation Leverage: $110,822-$109,752
Note: Be sure to follow capital management and do not take risks.
Please respect each other's ideas and express them politely if you agree or disagree.
Bitcoin Analysis (BTCUSDT), 1-hour time frame.
Be sure to follow the updated ideas.
Do not forget to put a Stop loss for your positions (For every position you want to open).
Please follow your strategy and updates; this is just my Idea, and I will gladly see your ideas in this post.
Please do not forget the ✅' like '✅ button 🙏😊 & Share it with your friends; thanks, and Trade safe.

$BTC The Correction is OVER - IH&S 50DMA Reclaim.VERY CONFIDENT THE ₿ITCOIN CORRECTION IS OVER 🤓
In other words, WE'VE SEEN THE SEPTEMBER LOWS.
Inverse Head & Shoulders reversal pattern closed outside of the Danger Zone and CRYPTOCAP:BTC reclaimed the 50DMA.

Bullish momentum to extend?The Bitcoin (BTC/USD) has bounced off the pivot which has been identified as a pullback support, and could rise to the 61.8% Fibonacci resistance.
Pivot: 113,062.07
1st Support: 110,869.14
1st Resistance: 118,296.79
Disclaimer:
The above opinions given constitute general market commentary, and do not constitute the opinion or advice of IC Markets or any form of personal or investment advice.
Any opinions, news, research, analyses, prices, other information, or links to third-party sites contained on this website are provided on an "as-is" basis, are intended only to be informative, is not an advice nor a recommendation, nor research, or a record of our trading prices, or an offer of, or solicitation for a transaction in any financial instrument and thus should not be treated as such. The information provided does not involve any specific investment objectives, financial situation and needs of any specific person who may receive it. Please be aware, that past performance is not a reliable indicator of future performance and/or results. Past Performance or Forward-looking scenarios based upon the reasonable beliefs of the third-party provider are not a guarantee of future performance. Actual results may differ materially from those anticipated in forward-looking or past performance statements. IC Markets makes no representation or warranty and assumes no liability as to the accuracy or completeness of the information provided, nor any loss arising from any investment based on a recommendation, forecast or any information supplied by any third-party.

Bulish continuation?The Bitcoin (BTC/USD) is reacting off the pivot and could potentially rise to the 1st resistance.
Pivot: 114,561.75
1st Support: 111,336.85
1st Resistance: 117,304.22
Disclaimer:
The above opinions given constitute general market commentary, and do not constitute the opinion or advice of IC Markets or any form of personal or investment advice.
Any opinions, news, research, analyses, prices, other information, or links to third-party sites contained on this website are provided on an "as-is" basis, are intended only to be informative, is not an advice nor a recommendation, nor research, or a record of our trading prices, or an offer of, or solicitation for a transaction in any financial instrument and thus should not be treated as such. The information provided does not involve any specific investment objectives, financial situation and needs of any specific person who may receive it. Please be aware, that past performance is not a reliable indicator of future performance and/or results. Past Performance or Forward-looking scenarios based upon the reasonable beliefs of the third-party provider are not a guarantee of future performance. Actual results may differ materially from those anticipated in forward-looking or past performance statements. IC Markets makes no representation or warranty and assumes no liability as to the accuracy or completeness of the information provided, nor any loss arising from any investment based on a recommendation, forecast or any information supplied by any third-party.

$BTC 2013\2017 vs. 2021\2025bitcoin is exactly repeating the reflection of the 2013-2017 period
zoom out!

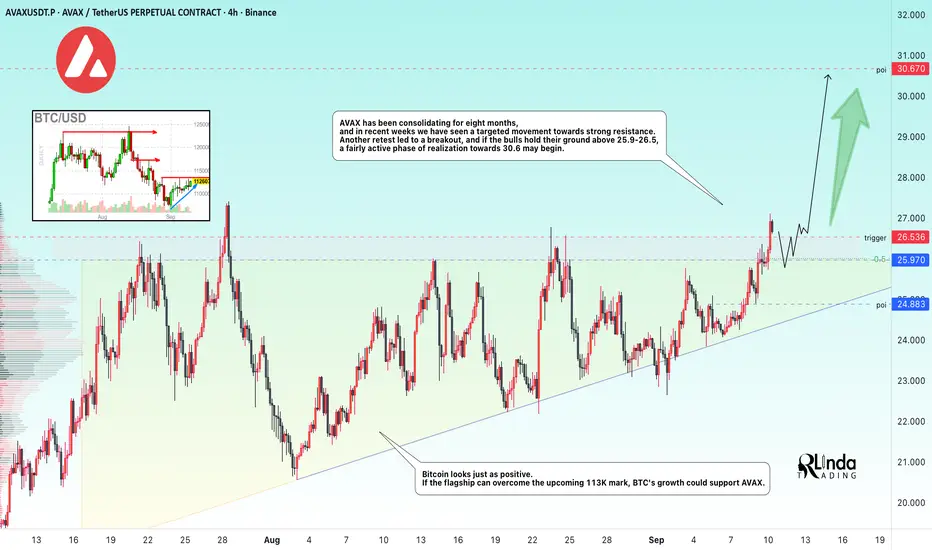
AVAXUSDT → Distribution of 8-month accumulationBINANCE:AVAXUSDT is testing the resistance of an 8-month consolidation. The market is showing positive signs that may indicate a possible rally...
Bitcoin looks positive. If the flagship can overcome the upcoming 113K mark, BTC's growth could support altcoins, including Avalanche.
AVAX has been consolidating for 8 months, and in the last few weeks, we have seen a directed movement towards strong resistance. Another retest led to a breakout, and if the bulls hold their defense above 25.9 - 26.5, a fairly active phase of realization towards 30.6 may begin.
Resistance levels: 26.550
Support levels: 25.97, 24.88
I do not rule out the possibility of a retest of the local support and liquidity zone, but a return to the zone of interest (above 25.97 - 26.55) and consolidation above the specified border could provoke a distribution towards 30.0 - 45.0.
Best regards, R. Linda!
BITCOIN Growth Ahead! Buy!
Hello,Traders!
BITCOIN is going up now
And the coin made a bullish
Breakout of the key horizontal
Level of 113k$ so we are
Bullish biased and we will
Be expecting a further
Bullish move up
Buy!
Comment and subscribe to help us grow!
Check out other forecasts below too!
Disclosure: I am part of Trade Nation's Influencer program and receive a monthly fee for using their TradingView charts in my analysis.

BTC - The Head and Shoulders of the Year?Bitcoin is shaping one of the most powerful reversal patterns traders could ask for: the inverse head and shoulders. After holding the ascending channel’s lower bound and bouncing from the key structure zone, BTC is signaling that bulls may soon take over.
Here’s what stands out on the chart:
🟢 Bullish Channel: Price continues to respect the rising channel, maintaining its long-term bullish outlook.
🛡️ Structure Zone: The $110,000 – $113,000 region is acting as a crucial pivot, flipping from support to resistance.
🔄 Inverse Head and Shoulders: A textbook reversal setup is forming, with the neckline aligning perfectly with structure.
🚀 Bullish Breakout: A confirmed break above this neckline could trigger the next major impulse move, putting BTC back on track toward higher channel targets.
Bulls need a clean daily close above the neckline for full confirmation — until then, the setup is in play but not yet validated.
📌 Will this become the pattern of the year that propels Bitcoin to new highs?
This is for educational purposes only, not financial advice. Always manage your risk before entering any trade.
📚 Stick to your trading plan regarding entries, risk management, and trade execution.
Good luck!
All Strategies Are Good; If Managed Properly!
~Richard Nasr

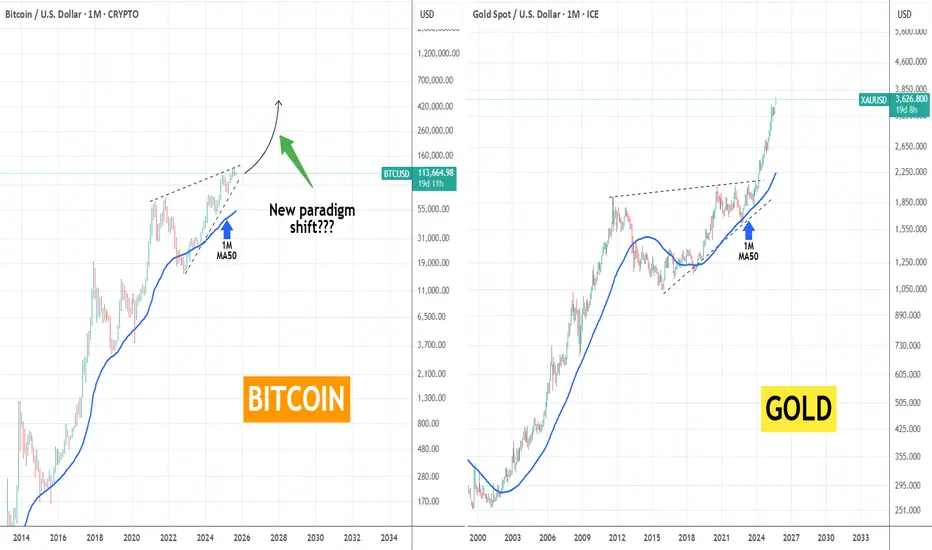
BITCOIN vs GOLD Is something like that inevitable?Bitcoin (BTCUSD) has been often described as the digital Gold, mainly due to its scarcity (fixed supply), compared to Gold's value as a safe haven asset. So what's the deal with this comparison chart?
If you follow us for long, you should know that we are strong believers of BTC's 4-year Cycle theory, which has served us so well and helped us buy and sell near cyclical bottoms and tops respectively.
However, as the market matures (remember Bitcoin is 'only' 16 years old), it could/ should eventually break this pattern upwards into aggressively higher valuations, which could be the shift to a new paradigm as mass adoption kicks in.
As a result, could it make a vicious bullish break-out above this Triangle in a similar way as Gold past 2024? Essentially, can we argue that Gold is leading the way as the traditional asset? Or the 4-year Cycle will go on for much longer than many think?
We are very interested in your thoughts. Feel free to let us know in the comments section below!
-------------------------------------------------------------------------------
** Please LIKE 👍, FOLLOW ✅, SHARE 🙌 and COMMENT ✍ if you enjoy this idea! Also share your ideas and charts in the comments section below! This is best way to keep it relevant, support us, keep the content here free and allow the idea to reach as many people as possible. **
-------------------------------------------------------------------------------
💸💸💸💸💸💸
👇 👇 👇 👇 👇 👇
BTC 1H Analysis - Key Triggers Ahead | Day 39😃 Hey , how's it going ? Come over here — Satoshi got something for you!
⏰ We’re analyzing BTC on the 1-Hour timeframe.
👀 On the 1H timeframe for Bitcoin, we can see that BTC has been ranging since yesterday’s news. A breakout and confirmation above the range high or below the range low will give us a trading setup. The key levels are $114,407 on the upside and $113,528 on the downside.
Today’s hot topic is the US CPI inflation data, which is a high-impact event at the very top tier of importance.
⚙️ On the RSI, Bitcoin is moving between the 50–70 zone. A breakout beyond these values, in alignment with a price breakout, could generate strong trade entries.
🕯 Candle structure shows that green candles are getting larger with more volume, while red candles are more frequent but smaller each time—so much that the market is starting to ignore them. The range high is very critical; it could break with a whale candle or even an indecision candle right before the move. Order type matters here—whether you use a trigger order or market entry on candle open will impact the trade.
📊 On the 1H Tether dominance, we’re also seeing a range—opposite in behavior to Bitcoin—with a range high at 4.37% and low at 4.32%. With BTC’s underlying trend on the 1H still bearish, there’s a decent probability of a downside break in USDT dominance while BTC breaks the upside of its range.
📊 On the 1H BTC.D , after a strong leg down, BTC.D has dropped below the 0.618 retracement level of its previous range and failed to hold support. We might see a small bounce/retest of that area, but unless today’s CPI causes major volatility, the broader expectation remains further downside in dominance.
🔔 The CPI report could bring serious volatility today. Yesterday’s news triggered nearly $750M worth of Bitcoin buys, sparking a strong rally with only minimal compression-style pullbacks. If today’s inflation data triggers a breakout above $114,407, and we see dominance dropping at the same time, large-cap projects are likely to pump even harder than Bitcoin itself.
❤️ Disclaimer : This analysis is purely based on my personal opinion and I only trade if the stated triggers are activated .

ADA – Cardano Swing Long IdeaADA – Cardano Swing Long Idea
📊 Market Sentiment
Market sentiment remains strongly bullish as the FED is expected to deliver a 0.25% rate cut, with speculation building for a possible 0.5% cut in September. Monetary policy shifts are being driven by both inflation trends and weakening labor market data. The latest August and September job reports were soft, signaling that the economy is cooling rapidly. This environment continues to fuel expectations for a major bullish run in the weeks ahead.
📈 Technical Analysis
Price found support on September 1st at the bullish HTF trendline and has been moving upward since.
Price is currently at the HTF Key Resistance level, showing accumulation rather than sharp rejection, with deviations pushing upward. This indicates strength and a bias toward higher prices.
📌 Game Plan
1)Watch for a daily close above the bearish trendline.
2)Look for the HTF Key Resistance to be broken and confirmed with a daily close above.
🎯 Setup Trigger
Entry after the retest of the HTF Key Resistance level ($0.885).
📋 Trade Management
Stoploss: Daily close below HTF Key Level ($0.85 area)
Targets:
TP1: $0.96
TP2: $1.02
💬 Like, follow, and comment if you find this setup valuable!
⚠️ Disclaimer: This content is for informational and educational purposes only and does not constitute financial, investment, or trading advice. Always do your own research before making any financial decisions.

BTCUSDT - Short-Term Pullback Opportunity?Hello everyone, today let's analyze BTCUSDT in the current market context. The 3-hour chart shows that BTCUSDT has been on a strong uptrend, but it has now encountered strong resistance at the 114,800 USD level. If this level is not broken, a short-term pullback is highly likely.
Currently, a pullback seems necessary after a significant rally. The nearest support level is 112,200 USD, and if this is broken, the price could decline further. This correction could be temporary before the uptrend resumes, but if the support is not maintained, BTCUSDT could face a deeper drop.
Trading Strategy:
Sell if the price continues to face resistance at 114,800 USD.
Watch key support levels, especially 112,200 USD, for a potential entry point.
In conclusion, BTCUSDT may experience a pullback in the short term. If the key support is broken, the downtrend could continue. Stay alert for clear signals before entering the trade!

Altcoins we are so back.Toyal2 \ After the major downward trend break in the bitcoin parity cycle, the altcoin bull run has started again.

116.15K is the next BTC TARGETMorning folks,
So, after two solid pullbacks out of 113.5K resistance area, BTC is decided to break it on a background of 50bp cut from the Fed next week. So, both Thu setups has worked nice. You either hold longs or out at breakeven with shorts that we have taken last week...
Anyway, we consider 116.15K as the most probable target for now, because price shape doesn't show signs of acceleration and looks more like AB=CD pullback out from 105-108K support area.
Thus, for short entry we prefer to wait when this target will be met. Long entry now theoretically could be possible, but we do not see good stop order placement that let us to turn probability in our favor. That's why, if you have longs - keep it, but price possession is not perfect for a new one, especially at the eve of CPI release...

BTCUSD POSSIBLE BUY SETUP -----118K Break of Structure (BOS): Multiple bullish BOS indicate a trend reversal from bearish to bullish.
Change of Character (CHoCH): Confirmed trend shift early on.
Descending trendline broken: Signaling the end of bearish momentum.
Price broke above resistance (~$113,250): Now acting as a support zone (highlighted in green).
Current price: ~$114,272
Bullish target zone: Between $116,000 – $118,000, marked in maroon.

BITCOIN passed the PIVOTOn the daily timeframe, Bitcoin broke above the monthly pivot at 113,350 with a strong green candle yesterday, surpassing the resistance area at 112,700. The next resistance is around 119,380, the first pivot resistance.

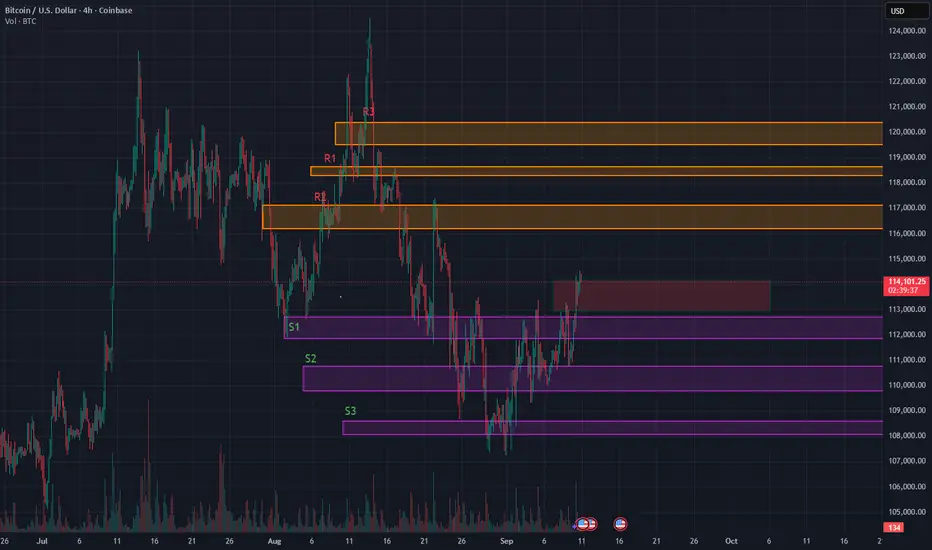
Range-Bound Rocket: BTC’s Coiled Spring Between S1 and R3-ATHRange Bound Rocket: BTC Loaded and Coiled for $120k Retest
Description:
BTC is now trading around $114,260, still inside the range I’ve flagged earlier. We reloaded at our previously posted support zones between $110k and $111k. That gives us a strong base.
I’m watching for acceptance above the $113k to $114k red box, which overlaps with the neckline of a potential reverse Head & Shoulders on the 4‑hour chart. It hasn’t triggered yet but we are in validation mode. (expecting a retest to 113k and then a break up) If we get a breakout with volume expansion and wide‑bodied candles, I’ll treat that as a valid activation. Target remains $119k and above.
This table shows how likely BTC is to stay above certain price levels over the next two weeks based on current volatility. These are not predictions, they represent statistically expected ranges based on price behavior.
2WK/Probability, Price Level, Meaning
90%, ~$96,700 BTC is very likely to stay above this level
75%, ~$103,200 BTC has a strong chance of staying above here
50%, ~$111,000 This is the midpoint, BTC has equal chance of being above or below
25%, ~$119,400 BTC has a one in four chance of closing higher than this
10%, ~$127,400 Only a small percentage of outcomes put BTC above this level
Key takeaways:
BTC is currently trading around $114,260, sitting just above our red resistance zone at $113,000 to $114,000.
Our first upside target, $118,000, lines up with the top 25 to 30 percent range of expected outcomes. This is reachable if the broader market stays supportive.
$120,000 sits closer to the top 20 percent threshold. BTC would need strong momentum and favorable macro data to push there in the next two weeks.
Downside probabilities
While the structure looks bullish, we should still consider these potential retracement levels:
Around 46 percent chance BTC dips below $110,000
Approximately 43 percent chance it drops under $109,000
Roughly 30 percent chance BTC trades below $105,000
These downside paths are consistent with our S2 and S3 support zones, which were successfully defended during the last major pullback.
What I'm doing and suggest :
Breakout confirmation:
I’m looking to add above $113k to $114k only if volume expands and candles show conviction, meaning minimal wicks and strong closes. Weak volume or upper wicks mean the breakout could fail. Main stop is back inside the range. Scalpers can use a tighter invalidation below $112.2k.
Reload zone:
A move into $110k to $109k is a statistically common retest. I’ll look for buyer defense and fading downside pressure to reload.
Volatility risk:
I'm already positioned long from our previously posted support zones around $110k to $111k, so I’m not actively adding or hedging right now. Into CPI and the Fed, I’m staying hands-off unless we get a clear breakout or strong market signal.
For those not in position:
Avoid chasing breakouts before the event
Look for confirmation or reaction post-data
If we get a volatility spike, retests of $110k to $109k are still statistically common and may offer a better entry
The goal is to avoid being overexposed heading into binary catalysts. I’m holding my current spot exposure and letting the trade breathe.
If no breakout forms:
I expect BTC to remain in a range between $111k and $118k. Support zones from prior posts maintained a bullish bias. If BTC consolidates below $114k but keeps forming higher lows, I’ll consider that ongoing accumulation.
Catalysts to monitor:
Nasdaq or NQ breakdown
• Tech strength: Nvidia up ~30% YTD on strong Blackwell Ultra demand, ADI and MX showing strength despite macro headwinds.
Jobless claims rising again
• U.S. jobless claims are rising to 237K, signaling labor market cooling. Continuing claims are easing but job additions in August were weak at just 22K. Recent wide downward revisions (~911K fewer jobs year-to-date) reinforce rate‑cut bets.
Geopolitical risk
• Geopolitical tensions remain tail‑risks.
Fed rate tone and CPI reaction
• Fed tone and CPI outputs are increasingly important as data is tilting soft and markets are pricing in easier policy.
• The USD’s trajectory matters. Further weakness helps BTC and tech space gain more cushion.
Tech remains a key driver. AI and semis continue to lead Nasdaq strength, and BTC still tracks equity moves closely. A soft dollar also reduces market drag and supports upside potential.