#BTC/USDT - Where the 2026 Bottom Might Actually Form ( Short) #BTC
The price is moving in a descending channel on the 1-hour timeframe. It has reached the upper limit and is heading towards breaking it. A retest of the upper limit is expected.
We have an upward trend on the RSI indicator, which has reached near the upper limit. A downward reversal is expected.
There is a key support zone in green at 944650. The price has bounced from this zone multiple times and is expected to bounce again.
We have a trend of consolidation above the 100-period moving average, as we are moving close to it. This supports a downward move towards touching this level.
Entry price: 93500
First target: 93006
Second target: 92509
Third target: 91866
Stop loss: Above the support zone in green.
Don't forget a simple thing: capital management.
For inquiries, please leave a comment.
Thank you.
Btc-usdt

#BTC/USDT Let Bitcoin make a new ATH#BTC
The price is moving in a descending channel on the 1-hour timeframe. It has reached the lower boundary and is heading towards a breakout, with a retest of the upper boundary expected.
We are seeing a bearish bias in the Relative Strength Index (RSI), which has reached near the lower boundary, and an upward bounce is expected.
There is a key support zone in green at 87300, and the price has bounced from this level several times. Another bounce is expected.
We are seeing a trend towards stabilizing above the 100-period moving average, which we are approaching, supporting the upward trend.
Entry Price: 87988
First Target: 88350
Second Target: 88722
Third Target: 89287
Remember a simple principle: Money Management.
Place your stop-loss order below the green support zone.
For any questions, please leave a comment.
Thank you.

BTC/USDT - Major Rejection from Supply Zone📝 Description 🔹 Setup Overview WHITEBIT:BTCUSDT
BTC/USDT has faced a strong rejection from the upper resistance / supply zone near the recent highs. Price has broken below the rising trendline, signaling a shift in short-term market structure from bullish to bearish. Failure to reclaim the trendline keeps sellers in control.
📌 Trading Plan📉 Bearish Scenario (Primary Bias )
Sell Zone: Below the broken trendline & previous support
Target 1: 89,030 (1st Support)
Target 2: 87,520 (2nd Support – liquidity area)
Confirmation: Weak bullish candles + rejection from trendline retest
#BTCUSDT #BitcoinAnalysis #CryptoTrading #BTC #PriceAction #TechnicalAnalysis #CryptoMarket #TrendlineBreak #TradingView #Kabhi_TA_Trading #SellBTC
⚠️ Disclaimer
This analysis is for educational purposes only.
Crypto markets are highly volatile — always manage risk and use stop-losses.
👍 Support the Analysis❤️ LIKE if this helped💬 COMMENT your BTC view
🔁 SHARE with fellow traders
Your support keeps the analysis coming! 🙏

usdt.d + BTCusdt.d + BTC
Capital Reservoir: In the Crypto market, when you sell BTC or ETH, most people don't immediately withdraw to fiat currency (because withdrawals are cumbersome), but instead exchange it for USDT. Seesaw Effect: Bull Market/High Risk Appetite: Traders buy BTC with USDT, $\rightarrow CRYPTOCAP:USDT.D decreases. Bear Market/Strong Risk Aversion: Traders sell BTC and buy back USDT, $\rightarrow CRYPTOCAP:USDT.D increases.

DXY EXTREME BEARISH DIVERGENCE > ABOUT TO COME STRAIGHT DOWN!DXY Has been on a tear but I think thats about to end and I think it will end very quickly. There is multiple very strong bearish divergences on the weekly, across multiple indicators showing that a major move down is coming. I think we have reached the top for the DXY for a while and its about to tank. Dont know whats around the corner as far as news but something big is about to come out thats going to kill the DXY. This is not trading or financial advice this is just my opinion. If you apprecaite my work please consider giving this chart a boost and follow me for more updates. Thank you and good luck my friends.

FireHoseReel | USDT Dominance & BTC Dominance Overview😄 Hey! How’s everything? Hope you’re doing great!
🍾 Welcome to FireHoseReel — make sure to follow and enjoy the analysis along the way.
If you ever want a custom chart breakdown, just leave a comment and I’ve got you.
😎 Let’s dive into the analysis of two major crypto dominances: USDT and Bitcoin.
✔️ USDT Dominance Technical Analysis
• On the 4-hour timeframe of USDT dominance, we can see that after repeatedly breaking through multiple resistance levels on the chart, USDT.D has reached a point of heavy overbought conditions. It’s now sitting at a strong resistance zone.
If this resistance breaks, USDT dominance could push even higher, which would bring additional downward pressure on the market, especially on Bitcoin and altcoins, leading to another wave of selling.
• If USDT dominance rejects from this zone and starts moving downward, the nearest support to be tested is around 6.148%. Losing this support would signal the beginning of the first bullish wave in the market, giving us a potential opportunity to start opening long positions once this level breaks down.
• Another key level is the resistance at 6.623%.
If USDT dominance breaks above this level, it could trigger an even stronger bearish wave compared to the previous one, causing a deeper correction across the market.
✔️ BTC Dominance Technical Analysis
• On the 4-hour timeframe of Bitcoin dominance, we can see that after the recent market drop, BTC.D also moved downward and went through a relatively deep correction.
What’s important here is that despite the decline in Bitcoin dominance, altcoins did not experience a heavy correction, and most of them held their levels without major downside movement.
• If Bitcoin dominance loses the 58.80% level, it could extend its correction even further.
However, the key reversal zone for the 4-hour trend lies at 59.31%. A breakout above this level can trigger a solid bullish wave in BTC.D.
• Our confirmation for this bullish wave would be the formation of a higher low above this resistance zone, signaling a potential upward trend continuation.
🛞 Risk Management & Disclaimer
Please remember to always use proper risk management and position sizing. Nothing in this analysis is financial advice. The market can change quickly, so always trade based on your own strategy, research, and risk tolerance. You are fully responsible for your own trades.

BITCOIN (BTC/USD): Can 100K Support Hold - A Pullback in SightBitcoin may experience a rebound from a significant daily historical support level.
Following its test, the price formed a double bottom pattern on an hourly timeframe and has successfully broken above its neckline.
I anticipate a bullish movement towards 104,000.

ETH Short Setup🚨 ETH Short Setup
Ethereum just confirmed a Break of Structure (BOS) after failing to hold above both EMAs. This rejection — together with a liquidity sweep near 4230 — signals potential continuation to the downside.
🎯 Trade Plan Overview:
Entry: 4020–4050
Stop: 4100–4120
Targets: 3960 → 3840
Risk/Reward: 1:3
📊 Key zones:
EMA short attention zone ✅
Support: 3920–3960 equilibrium
Watch for bullish divergence before reversal
🔔 Subscribe for daily ETH and BTC market updates, crypto trading strategies, and AI-powered technical analysis!

BTC USD (T)🟢 Main scenario (healthy correction and continuation of growth)
The price is pulling back to the EMA50 / EMA100 (around 113.4k–112.8k).
In this zone — especially near 112.8k — you can look for long confirmations such as a pattern, volume spike, or false breakout downward.
After a rebound, the next targets are: 115.5k → 116.3k (Weekly High),
If this level breaks — a possible move toward 117k–118k.
🔴 Less likely, but possible scenario (deep correction)
If the price consolidates below EMA100 (≈112.8k),
the move may deepen toward the Equilibrium zone (111.0–110.5k).
There will again be a chance for a strong long entry, but only after confirmation.

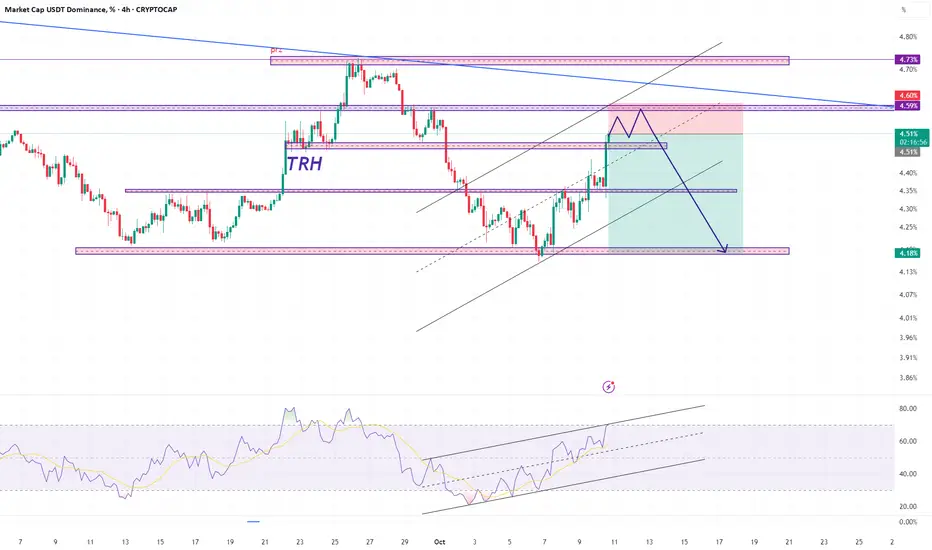
usdt.d 4hHello friends, I am Mehdi.
Given the area, we expect a price correction from this area trh.
Reasons:
We are in the area trh.
There is a possibility of approaching the channel ceiling and then correcting the price.
The resistance at 4.60 is a good place to buy.
I would like to thank you for supporting me by liking and commenting.
And please state your desired currency for analysis.
#BTCUSDT Let Bitcoin make a new ATH#BTC
The price is moving in a descending channel on the 1-hour frame and is expected to break and continue upward.
We have a trend to stabilize above the 100 moving average once again.
We have a downtrend on the RSI indicator that supports the upward move with a breakout.
We have a major support area in green that pushed the price higher at 121,500.
Entry price: 122,200.
First target: 122,800.
Second target: 123,400.
Third target: 124,200.
To manage risk, don't forget stop loss and capital management.
When you reach the first target, save some profits and then change your stop order to an entry order.
For inquiries, please comment.
Thank you.

usdt.dHello, I am Mehdi.
According to the previous analysis, the market has continued to the range we are waiting for. In this area, we should wait for the formation of a pattern to continue the path.
Therefore, it is recommended to keep an eye on the market with a 70% profit margin.

BTC Update📊 CRYPTOCAP:BTC Update
After forming a bearish Head & Shoulders pattern, BTC moved down and is now testing a new support level. ⚠️
If this support breaks, the next move could be a breakout of the blue support zone, with the first target at the green line level. 📉

BTCUSD Long: Awaiting Bounce from Channel SupportHello, traders! The prior price auction for BTCUSD was controlled by a downward wedge, which guided the price to the major 110000 DEMAND level. A strong bullish initiative from this demand zone caused a reversal and a breakout from the wedge, establishing the current bullish market structure and shifting control to buyers.
Currently, the price action is being guided by a new ascending channel. The auction has recently pushed up to test the significant horizontal supply at the 117600 level and is now in a corrective pullback phase, heading towards the lower support line of this channel for what I see as a critical test.
My scenario for the development of events is a continuation of this uptrend after the corrective dip completes. I believe the price will find strong support on the ascending demand line of the channel. In my opinion, a successful bounce from this dynamic support will confirm that buyers are still in control, triggering the next impulsive wave higher and breaking the 117600 supply level. The take-profit is therefore set at 120300, targeting the upper resistance line of the channel. Manage your risk!

WLD CAN DO IT AGAIN..It's been a long time since WLD showed a new increasing trend.
Following the coming hours to see if WLD is able to open a new cycle
Never enter any trend directly, wait for the confirmations, and trade only depending your setups.
WLD did show before at good cycle times, that it can do even 12 usd in short term

#Bitcoin Sunday Update#Bitcoin Sunday Update 📉
I’m still holding my short from the past 20 days. CRYPTOCAP:BTC is stuck near $111K, trading weak below the 50MA, and the structure remains bearish. If we get a CPI-driven spike into 115K–120K, I’ll look to add more short positions.
📌 Downside Targets:
105K → 100K → 95K → 90K

BTCUSDT (Daily)### 🔎 **Chart Context**
* Pair: **BTC/USDT**
* Exchange: **Binance**
* Timeframe: **1D (Daily)**
* Current price: \~**110,880**
* BTC has retraced from the **124,474 top** and is now stabilizing above the **111,920 support zone**.
* Projection points toward a **bullish continuation toward 138,000** after reclaiming mid-range resistance.
---
### 📊 **Key Observations**
1. **Market Structure**
* BTC printed a **higher high at 124,474** in August.
* Pullback into **111,920 support zone** has been defended.
* Structure remains **bullish** on daily timeframe as long as BTC holds above **100,000 – 111,000 range**.
2. **Support Zones**
* **111,920 – 110,530**: Immediate support, currently holding.
* **99,475 – 100,372**: Strong historical support cluster, high-volume node on VPVR.
* **88,765 – 90,500**: Deeper demand zone if broader correction occurs.
3. **Resistance Zones**
* **119,902 – 123,218**: First major resistance ahead.
* **124,474**: Swing high and liquidity cluster.
* **138,000 – 140,000**: Next big target & projected liquidity pool (aligned with chart’s TP).
4. **Volume Profile (VPVR)**
* Clear **volume gap above 120,000**, meaning once BTC reclaims **119,900**, price can accelerate toward **138,000**.
* Heaviest volume traded between **95,000 – 105,000**, forming a strong support base.
---
### 📈 **Bullish Scenario (Higher Probability)**
* Price sustains above **111,920 support**.
* Path:
* Retest 119,900 → Break 124,474 high → Rally into 138,000–140,000 zone.
* This aligns with projection, suggesting continuation after consolidation.
---
### 📉 **Bearish Scenario (Risk Case)**
* Breakdown below **111,920 – 110,530 support**.
* Next downside levels:
* **100,000 – 99,475** → Major support & volume shelf.
* **88,765 – 90,500** if selling accelerates.
* A daily close below **99,000** would shift structure to bearish mid-term.
---
### ⚡ **Trading Plan**
* **Long Setup (Preferred):**
* Entry: 111,920 – 110,530 support retest.
* TP1: 119,900
* TP2: 124,474
* TP3: 138,000–140,000
* Stop: Below 109,000
* **Short Setup (Countertrend):**
* Entry: Rejection from 119,900 – 124,474 zone.
* TP: 111,920 → 100,000
* Stop: Above 125,500
---
### ✅ **Conclusion**
BTC/USDT daily remains **bullish**, holding key support at **111,920**. The most probable scenario is **continuation toward 119,900 → 124,474 → 138,000**, with strong momentum if BTC reclaims **120K**. Only a breakdown below **100K** would invalidate the bullish trajectory.

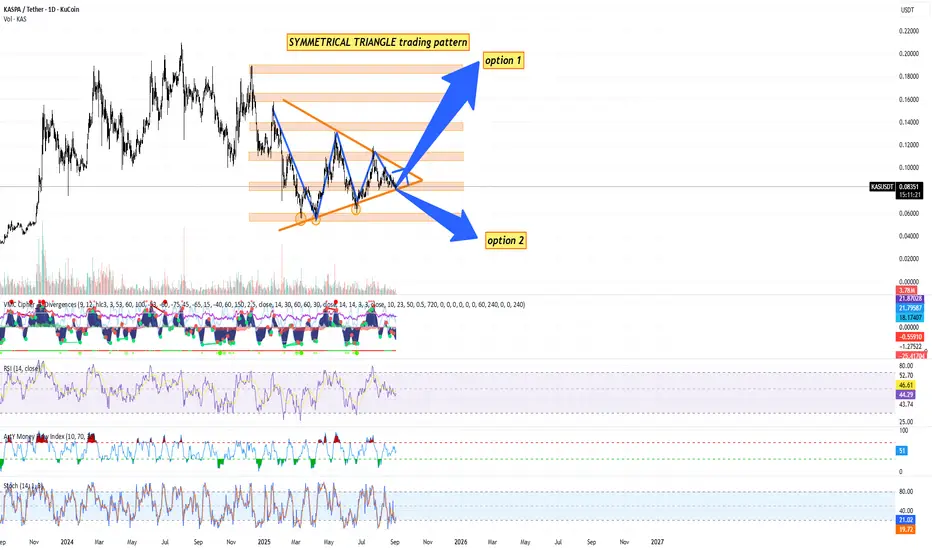
KASPA / USDT DAILY CHART KUCOIN - TA + TRADE PLANTechnical Analysis (Daily Timeframe) by Blaž Fabjan
Chart Pattern
The price is consolidating within a Symmetrical Triangle pattern.
This is a neutral continuation pattern – it signals that a major breakout (either upward or downward) is approaching as the apex is nearing.
Both higher lows and lower highs confirm the formation.
Key Support & Resistance Levels
Immediate support zone: $0.080 – $0.082
Strong support below: $0.070
Immediate resistance: $0.095 – $0.100
Major resistances above: $0.120, $0.140, $0.160, $0.200, $0.220
Indicators
Volume: Declining within the triangle – typical before a breakout.
RSI (14): ~46 → Neutral, no overbought/oversold signals.
Stochastic RSI: Oversold (~20), suggesting possible short-term upside bounce.
MFI (Money Flow Index): Neutral (~51), showing balanced inflows/outflows.
MACD/VM indicator: Bearish momentum has slowed, histogram flattening.
Scenarios
Option 1 (Bullish breakout): If KAS breaks above the $0.095–$0.100 zone with volume, next targets are $0.120 → $0.140 → $0.160 → $0.200+.
Option 2 (Bearish breakdown): If KAS loses $0.080, potential retest of $0.070 → $0.060 support levels.
Trading Plan for KAS/USDT
🔹 Short-Term Swing Trade (1–4 weeks)
Entry Zone (Buy):
Aggressive: $0.082 – $0.085 (current support area).
Conservative: On confirmed breakout above $0.095 with volume.
Stop Loss:
Below $0.078 (tight stop) OR below $0.070 (safe stop).
Take Profit Targets:
$0.100 (first resistance, partial TP)
$0.120 (main target)
$0.140 (strong resistance)
🔹 Medium-Term Position Trade (1–3 months)
Entry Strategy: Accumulate in the $0.080–$0.085 range.
Stop Loss: Below $0.070 (close daily candle confirmation).
Targets:
Base case: $0.160
Optimistic case: $0.200 – $0.220
🔹 Risk Management
Risk per trade: 1–2% of portfolio.
Position sizing according to stop-loss distance.
Avoid over-leveraging; triangle breakouts can produce false moves before direction confirms.
Kaspa is entering the decision zone – the symmetrical triangle is compressing, and a major breakout is imminent in coming weeks.
Momentum indicators show neutrality, giving equal probability for either breakout direction.
The safest approach is to wait for breakout confirmation (daily close above $0.095 or below $0.080 with volume).
If bullish, Kaspa could target +40–100% upside over the next quarter. If bearish, downside risk is -20–30%.
Recommendation:
For conservative traders → wait for breakout confirmation.
For aggressive traders → accumulate around support ($0.082–$0.085) with tight stop-loss below $0.078 and scale out profits at resistance levels.
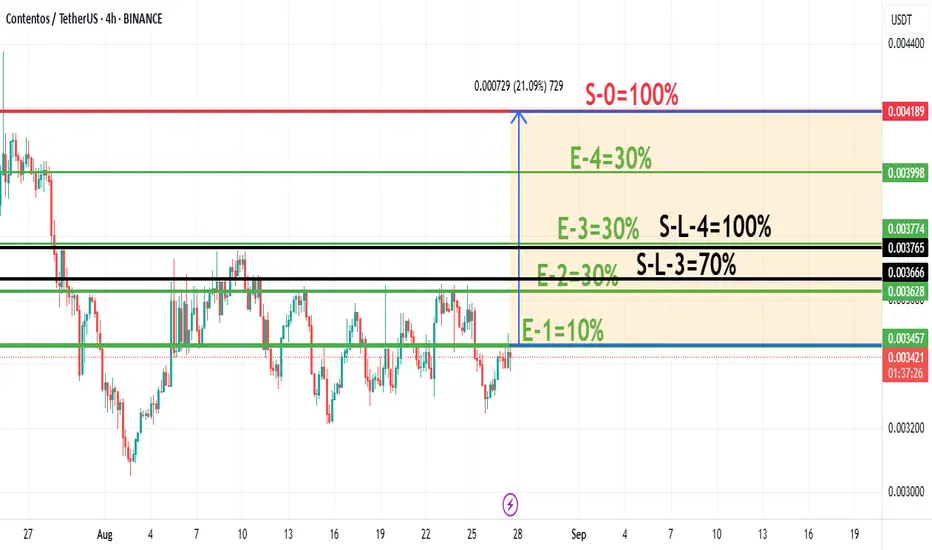
Proposed ~11% Average Gain Trade Strategy with COSThis is a 4-step buying plan where you add to your position as the price goes up. Your stop-loss automatically moves to a "breakeven" point after each phase, guaranteeing no loss if the price reverses.
1. The Entries (Buying More as it Rises):
E-1: Buy 10% at price 0.003457
E-2: Buy another 30% at the higher price 0.003774
E-3: Buy another 30% at the higher price 0.004189 (You now own 70%)
E-4: Buy the final 30% at the high price 0.008998 (You now own 100%)
2. The Exits & Risk Management (The "No-Loss" Trick):
After E-3 (70% owned), you set a Stop-Loss at S-L-3.
The S-L-3 price is set at your average purchase price for the first 70%.
If the price hits S-L-3, you sell all 70%. Since the price is at your average cost, you break even and lose nothing.
After E-4 (100% owned), you move your Stop-Loss to S-L-4.
The S-L-4 price is set at your new, higher average purchase price for the entire 100% position.
If the price hits S-L-4, you sell 100%. Again, you break even and lose nothing.
3. The Profit Target:
You sell your entire 100% position for profit at the final target price: S-0.
In simple terms: You keep buying as the price goes up. After each major purchase, you move your stop-loss to the price you paid on average, locking in a "no-loss" scenario. Your only goal is to reach the high-profit target (S-0) without being stopped out at breakeven.
* This is for educational purposes only and is not investment advice
CAN SV HIT THE ALL TIME HIGH UP $500 ---> YEES -Mainnet, TeranodCurrently, BSV appears to be stabilizing after a period of decline, and it is trying to reach a potential maximum level of $30–$60.
We also know the power of this coin, when it has interest and building it can increase 100% in a short time frame or more.
The best way to follow a coin is day by day, since there is no guarantee that expectations will be met. This update is based on possibilities and potential effects rather than certainties.
What could allow BSV to reach a new all-time high (ATH)?
The BSV mainnet, Teranode, is designed to handle millions of transactions per second. Tests have already been completed, and the original version is expected to launch in 2025.
This process can take time until there are huge updates and confirmations on the mainnet. same time it proved before that is able to do it from this price in 126 days to ATH

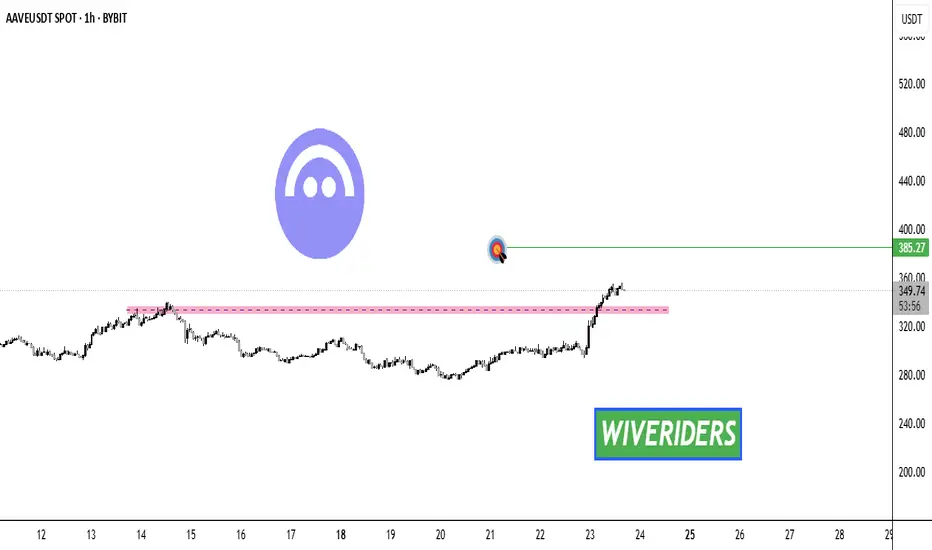
AAVE Breakout Alert! 🚨 CRYPTOCAP:AAVE Breakout Alert! 🚨
CRYPTOCAP:AAVE has broken out of the red resistance zone 🔴✅
The first target is the green line level 🎯
This breakout confirms bullish momentum and could drive further upside if buyers maintain control 💪

BTC & USDT.D => Bullish Correction Incoming?Hello TradingView Family / Fellow Traders. This is Richard, also known as theSignalyst.
Both BTC and USDT.D are sitting around key rejection zones.
💰 BTC is hovering near the $100,000 level — a major previous low and a psychological round number.
📊 Meanwhile, USDT.D is testing the 5% resistance — a supply zone and another critical round number.
As long as $100,000 holds as support on BTC and 5.1% holds as resistance on USDT.D, we could expect a bullish correction across the crypto market.
What do you think? Will these levels hold or break? 🤔
📚 Always follow your trading plan regarding entry, risk management, and trade management.
Good luck!
All Strategies Are Good; If Managed Properly!
~Rich
