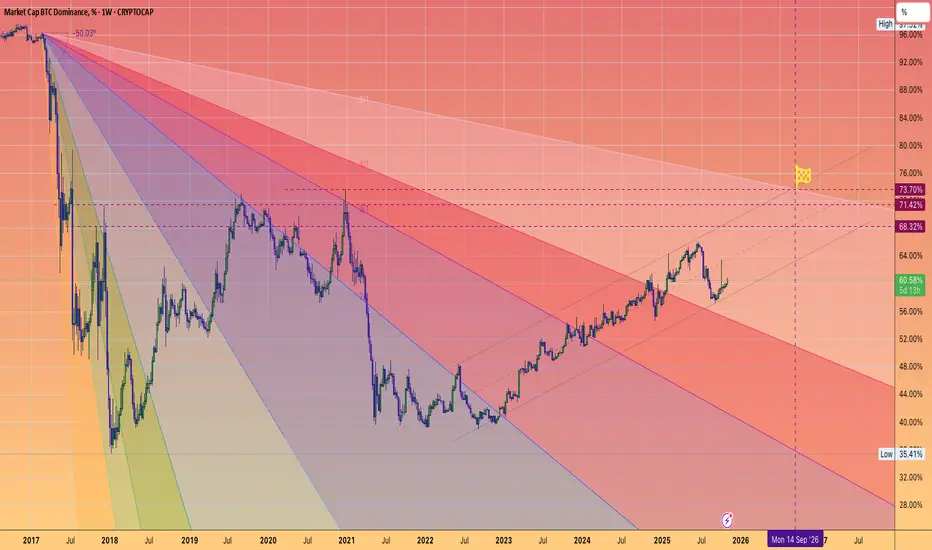
Bitcoin Dominance showing us things ARE Very Different this time
There are so many things that ARE the same as previous cycles, to date.
And we have seemingly begun a draw down and even I am seeing possible similarities to the post 2021 ATH draw down.
But Bitcoin Dominance shows us a Glaring difference.
The chart above shows us the BTC.D PA and the Bitcoin Halving dates to ATH in Blue Boxes at the Top of chart
We have the ATH to ATH day count at the bottom of the Chart in blue Boxes.
Also At the Bottom of the Chart, in Yellow and orange boxes, we have the % draw down in BTC.D from the Halving date to the ATH
To the 2017 ATH after halving, we saw a -61.17% DROP in Bitcoin Dominance.
To the 2021ATH after halving, we saw a -42,53% DROP in Bitcoin Dominance.
From the Halving in April 2024 to the current ATH, we have a GAIN in BTC.D of 9.21%
The fact thaat Vitcoin is holding Dominance in the market is so incredably BULLISH and does lead to the possibility that the 4 year cucle has ended and we may well be entering a Super cycle.
We will not know if this has happened for a while.....But I am watching the Ascending channel closely on the Bitcoin charts.
New days maybe ahead
Btcd

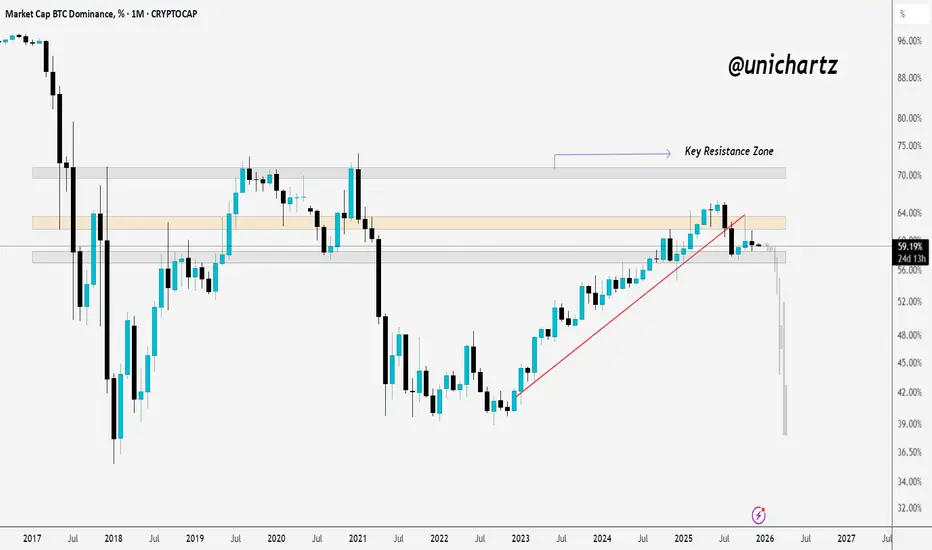
ALTCOIN SEASON IS IMMINENT IF THIS HAPPENS!! Must Read.BTC Dominance is approaching a major long-term resistance trendline that has consistently acted as a rejection zone in previous cycles.
Key Observations:
* BTC.D has been moving inside a rising channel on the weekly timeframe.
* Price is currently testing the upper boundary of the channel along with a macro descending resistance.
* In past instances, rejections from this trendline resulted in strong altcoin rallies.
* EMA structure shows signs of weakening momentum, with repeated crossovers near resistance, often indicating trend exhaustion.
What to Expect:
* A rejection around the current levels (approximately 59–60%) would be a strong signal for capital rotation into altcoins.
* This zone historically offers a high-probability short opportunity on BTC.D, which aligns with bullish setups across quality altcoins.
* A confirmed breakdown below the channel support would further accelerate altseason momentum.
Invalidation:
* A clean weekly close above the descending resistance would invalidate the bearish dominance view and suggest continued Bitcoin strength.
Conclusion:
BTC Dominance is at a critical decision point.
Rejection favours altcoins outperforming Bitcoin, while acceptance above resistance delays the altseason narrative.
If you find this idea useful, please hit the like button to support so I can keep posting such important updates for you all.
Thank you
#PEACE

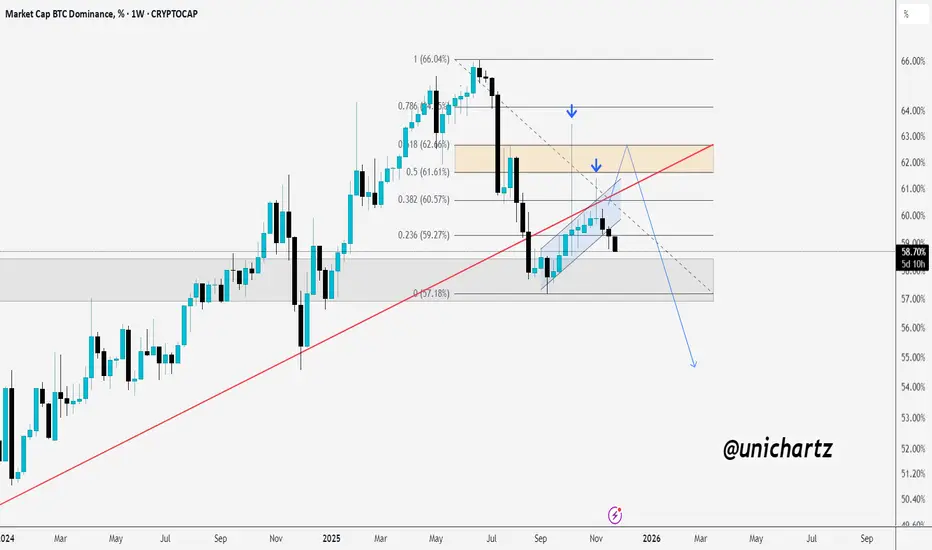
BTC Dominance (BTC.D) – Chart Update. BTC Dominance (BTC.D) – Chart Update
BTC Dominance is moving inside a tight symmetrical triangle, indicating compression and a big move ahead.
Current zone: ~59.3%, hovering near the triangle’s apex.
Resistance: Downward trendline near 59.8% – 60.0%
Support: Rising trendline around 58.8% – 59.0%
Breakdown below 58.8% → Possible altcoin rally / altseason phase.
⚠️BTC.D is at a decision point. A confirmed breakout or breakdown will likely define the next market rotation.
Trade patiently and wait for confirmation.

BTC Dominance (BTC.D) – Weekly Chart BTC Dominance (BTC.D) – Weekly Chart | Full Details (with 25MA and 100 MA)
BTC.D is trading within a long-term descending channel. After a strong recovery from the 2022 lows, the dominance is now stalling near the mid-range resistance (~59–60%).
25 MA: Tracks short-term momentum
BTC.D is hovering around/slightly below the 25 MA.
100 MA: The price is still above the 100 MA, meaning the overall BTC dominance trend has not yet broken down.
A break below the 100 MA would signal a significant shift towards altcoin strength.
This is a decision zone.
BTC dominance is not yet bearish, but the strength of the uptrend is weakening.
Keep a close eye on the MA — they will guide the next move.
DYOR | NFA

#RIOT and the miners pumping = AltseasonThe Bitcoin miners have quietly entered a Bull market since April, without much attention.
This indicates that investors are looking for additional risk beyond #BTC as they prepare for an exciting Altseason.
Their reasoning might arise from the perception that Bitcoin can provide only a limited return going forward based on its current point in the cycle and the outsized returns it has already delivered over $100K+ per coin from the low 3 years ago.
As you can see, RIOT has recently broken out of an inverse head and shoulders pattern against Bitcoin dominance.
Historically, when this pattern has emerged in the previous two cycles, the logarithmic target has been achieved and even exceeded, coinciding with strong altcoin performance.
We have much to look forward to in the upcoming months.

BTC.D 4H – Market Structure OutlookHi fellow traders,
On the 4H BTC Dominance chart, I am applying Elliott Wave principles to outline a directional scenario for the broader crypto market. After completing the recent downward leg, I expect dominance to move higher in three waves, forming a corrective structure before the larger continuation to the downside can resume.
This is not a trade setup, but a structural roadmap to understand how capital may rotate across the crypto market. As long as BTC.D remains below the invalidation level at 61.32%, my expectation is that dominance will eventually turn lower with TP1, TP2, and TP3 as the downside objectives - signalling increasing strength for ALTcoins.
If dominance breaks above the invalidation level, this scenario is no longer valid.
Good luck and trade safe!

BTC.D Rejected From Key Monthly ResistanceBTC dominance is still sitting below the key monthly resistance zone, showing clear rejection from the top.
As long as dominance stays under this area, it suggests money isn’t aggressively flowing into BTC, leaving room for altcoins to stabilize or gain some strength.
A breakout above the resistance would shift momentum back toward BTC, but for now the structure looks capped below this zone.
DYOR, NFA
ALTS HAVE ROOM TO THE DOWNSIDE.Alt's need retail participation to thrive.
If Global Liquidity tightens, #BTC rolls over into 4 year cycle lows (q4 2026)
BTC.d will rise along with Stablecoin dominance.
This inverted chart shows a well formed Head and Shoulders that is about to test again a key level of significance.
I DO NOT expect it to hold.

Understanding BTC, Bitcoin Dominance and TOTAL3 Rotations✅Bitcoin Dominance, BTC, Altcoins✅
Today, We're talking about the rotation of cash between Bitcoin and altcoins.
Imagine a pie where each slice represents a different cryptocurrency. The pie here indicates the total cryptocurrency market cap of both Bitcoin and altcoins, which can increase or decrease at any given time. In other words the TOTAL chart.
- If BTC market cap increases but altcoin market cap shrinks (relative), the pie stays the same size.
- If BTC market cap increase and altcoin market cap increases, the pie size increase and so forth.
Total Market Cap and BTC.D
At most of the key moments, we see a clear inverse relationship here. Alts drop harder than BTC, as this clearly shows. But during the cycle, investors hop on and off, injecting money into the ride (buying) and taking it out (selling). This constant movement is what keeps the crypto markets going.
Let's break it down with visuals:
Chart 1: Bitcoin
This rollercoaster represents Bitcoin's price action, and also my view on where we are in the current cycle. (I believe we're in a multimonth correction, followed by the last impulse wave up probably close to XMAS 2025 as usual). You'll need this to know where we are in the cycle right now:
Chart 2: Bitcoin & Bitcoin Dominance
This chart shows Bitcoin's dominance, which is basically its share of the total crypto market capitalization (market cap = total value of all cryptocurrencies). When Bitcoin's dominance goes up (higher on the chart), it means investors are putting more money into Bitcoin, potentially at the expense of altcoins. Conversely, when dominance goes down, it suggests capital is flowing towards altcoins. The difference is clear:
Chart 3: BTC.D vs TOTAL3
In this chart, we overlay the Total 3 Priceline (BLUE) on top of the Bitcoin Dominance chart. TOTAL3 shows us all alts except ETH.
The Bitcoin Rollercoaster and the S&P 500:
When Bitcoin surges (line goes up), it can sometimes lead to increased investor risk appetite. This might entice some investors to move funds from the S&P 500 into riskier assets like Bitcoin, potentially causing a slight dip in the S&P 500. Conversely, when Bitcoin experiences a price drop, investors might flock back to the perceived stability of the stock market, potentially causing a rise in the S&P 500.
So, is there a guaranteed CORRECTION? All the signs are proving this may be the case. By understanding the relationship between Bitcoin, altcoin prices and dominance, you can get a better sense of where the money merry-go-round might be headed.

BTC.D Pullback Could Open Doors for AltsBTC dominance has broken below its long-term trendline and is currently holding near the 58–59% support zone, but momentum still appears weak.
The key resistance area sits between 61% and 62.5%, and any retest of this zone may struggle to break higher, especially with its alignment to major Fibonacci levels.
If BTC dominance fails to reclaim this zone with strength, the broader structure points toward continued downside, potentially targeting the 57% level and possibly lower if that support breaks.
A continued decline in dominance would generally favor altcoins, so it’s best to wait for clear confirmation before making any decisions.
DYOR, NFA
Please hit the like button if you like it, and share your views in the comments section.
A gift from Trump will launch the ALTSEASON - BTC dominance!📣 Hello everyone!
US President Donald Trump has said he wants to pay the country's citizens "dividends" from customs duties in the amount of at least $2,000 per person. The corresponding entry was posted by the head of the White House on Sunday, November 9, on the Truth Social network.
"People who are against tariffs are FOOLS! We are now the richest and most respected country in the world, with virtually zero inflation and record stock market performance," Trump said.
"We are receiving trillions of dollars and will soon start paying off our HUGE DEBT of $37 trillion. The United States is experiencing record investments, and factories are being built everywhere. Everyone will be paid dividends in the amount of at least $ 2,000 (excluding those with high incomes!)," the message continues.
__________________________________________
The National Cryptocurrency Association has presented the results of its largest study on cryptocurrency owners in the United States, showing a wide and diverse population using digital assets for everything from purchases to long—term investments. The report, based on a Harris Poll conducted in late January and early February 2025, analyzed the responses of 54,000 adults, identifying 10,000 current cryptocurrency owners.
The audience is far from elitist: 21%, or one in five American adults — approximately 55 million people — own at least a small part of the cryptocurrency. Some use it to invest in their financial future, others for art and games, and still others are just curious and trying out a novelty. In addition, many are already using cryptocurrency for everyday purchases.
__________________________________________
Anonymous Trader: Part of these payments from Trump will inevitably go into investments in the cryptocurrency market. Against the background of a reduction in the interest rate of the US Federal Reserve, risk appetite will grow, at least until a certain plateau in the rate is reached or the question of raising it against the background of renewed inflation does not arise at all, but it's too early to think about it yet! At least one more decrease is forecast on December 10, 2025, and the next Fed meeting will be held only on January 28, 2026! And of course, it is worth noting the curtailment of the QT program from December 1, 2025, the balance will no longer be reduced, but there are also no words about printing money until the labor market collapses - but this is a positive moment in any case for risky assets.
In the meantime, where should I invest the $2,000 I received for free?? - Of course, to the violas! - People don't want to earn 10-20-30% in Bitcoin in half a year, but they want to earn +200-300% in alts in a month!
__________________________________________
Technical information:
1. For the first time in the last 3 years, a "death cross" has formed on the Bitcoin dominance chart, which threatens Bitcoin's dominance for at least the next 1-2 months.
2. We saw exactly the same bearish crossover in April 2020! The dominance of Bitcoin has collapsed from 69% to 57%
_________________________________________
Total: The exact date on which payments of the $2,000 gift from President Trump will begin is unknown. Despite this, the chart shows BTC dominance.D I expect a decrease in November-December to at least 55%, which will have a positive impact on the altcoin market. I do not rule out that dominance may break through the 55% support and go even lower, launching a full-fledged altcoin season for strong fundamentals and from the point of view of altcoins charged for growth. 🚀🚀🚀
That's all for today, I wish you good luck in making independent trading decisions and profit. Please analyze the information you receive from me, always think only with your head!
Goodbye! ✊

BTC Dominance Retests 50 EMA — Alt Season Loading?BTC dominance broke below the 50 EMA and is now retesting that zone after a sharp correction.
If it fails to reclaim the EMA, we could see dominance sliding lower, giving room for altcoins to rebound.
But a clean reclaim above this level might extend BTC’s lead a bit longer before the next rotation.
DYOR, NFA

Market analysis using bitcoin dominance & usdt dominance chartsWe aim to conduct an in-depth analysis of the correlations among four key indicators used to interpret the complex dynamics and investor sentiment in the cryptocurrency market — Bitcoin Dominance, USDT Dominance, TOTAL3, and the Coinbase Premium — and to share insights on how these can be effectively utilized in real trading strategies.
By analyzing these four indicators together, traders can identify the overall market trend, gauge the vitality of the altcoin market, and assess institutional participation, which provides a foundation for developing mid- to long-term trading strategies.
First, please click Boost (🚀) so that more people can see this post.
💡Understanding the Key Indicators
Bitcoin Dominance: CRYPTOCAP:BTC.D
The ratio of Bitcoin’s market capitalization to the total cryptocurrency market capitalization.
It represents Bitcoin’s market strength relative to altcoins.
USDT Dominance: CRYPTOCAP:USDT.D
The ratio of Tether (USDT) market capitalization to the total cryptocurrency market capitalization.
It helps identify risk-on/risk-off sentiment among investors and assess the level of market liquidity.
TOTAL3: CRYPTOCAP:TOTAL3
The total market capitalization of all altcoins excluding Bitcoin (BTC) and Ethereum (ETH).
It directly reflects the overall momentum of the altcoin market.
Coinbase Premium Index: TradingView Indicator
An indicator showing the price difference of BTC between Coinbase and other major exchanges (e.g., Binance).
It is used to indirectly gauge institutional buying pressure (positive premium) or selling pressure (negative premium) in the U.S. market.
⚙️Interaction of Indicators and Trading Strategies
These four indicators exhibit specific patterns under different market conditions.
By analyzing them comprehensively, traders can identify medium- and long-term trading opportunities.
Correlation between BTC price and indicators:
BTC price vs BTC.D: Complex correlation.
BTC price vs USDT.D: Mostly inverse correlation (USDT.D rising = market uncertainty and BTC decline)
BTC price vs TOTAL3: Mostly Positive correlation (BTC rise = TOTAL3 rise)
BTC price vs Coinbase Premium: Mostly Positive correlation (sustained positive premium = continued BTC uptrend)
✔️Scenario 1: Bullish Phase📈 (Bitcoin-led Rally)
BTC.D rises: Capital concentrates into Bitcoin
USDT.D falls: Increased risk appetite, cash inflows grow
TOTAL3 moves sideways or slightly upward: Altcoins remain weak or unresponsive
Coinbase Premium rises and stays positive: Institutional buying inflow
Interpretation:
Strong institutional buying of Bitcoin drives the market, with capital shifting from stablecoins into BTC.
Altcoins may lag behind this movement initially.
Strategy:
If the Coinbase Premium remains positive even during minor BTC corrections, it favors building long BTC positions.
When the positive premium persists and BTC breaks key resistance levels, it can be interpreted as a strong buy signal.
During early stages, focus primarily on Bitcoin rather than altcoins.
✔️Scenario 2: Strong Bull Market📈 (Altcoins Join the Rally)
BTC.D declines: Capital rotates from Bitcoin to altcoins
USDT.D declines: Ongoing risk appetite and continuous inflows
TOTAL3 rises: Peak momentum in the altcoin market
Coinbase Premium remains positive: Continuous liquidity inflow
Interpretation:
As Bitcoin stabilizes or trends upward, capital starts flowing aggressively into altcoins.
The rise in TOTAL3 reflects broad-based strength across the altcoin market.
Strategy:
Select fundamentally strong altcoins and build positions gradually.
During this phase, large-cap and small-cap thematic groups may experience rotational pumps — monitoring related narratives is crucial.
✔️Scenario 3: Bearish Market📉
BTC.D rises: Altcoins fall more sharply as BTC declines
USDT.D rises: Strengthened risk aversion and increased cash positions
TOTAL3 declines: Deepening weakness in the altcoin market
Coinbase Premium drops and stays negative: Institutional selling or halted buying
Interpretation:
Heightened market anxiety leads investors to liquidate risk assets and move into stable holdings such as USDT.
Institutional selling pressure pushes the Coinbase Premium negative or maintains it in a downward trend.
Altcoins are likely to experience the greatest losses in this phase.
Strategy:
Reduce crypto exposure or convert positions to stable assets (USDT) for risk management.
During technical rebounds, consider trimming positions or cautiously taking short opportunities (with higher risk).
✔️Scenario 4: Sideways or Correction Phase
BTC.D moves sideways: Range-bound consolidation
USDT.D moves sideways: Persistent risk aversion and lower market volume
TOTAL3 moves sideways: Altcoin market remains flat or slightly weak
Coinbase Premium stable: Fluctuates between positive and negative values
Interpretation:
The market enters a wait-and-see phase with sideways movement or mild correction.
The Coinbase Premium’s neutrality reflects uncertainty in institutional capital flows.
Strategy:
Monitor BTC and TOTAL3 reactions at major support levels before re-entering positions.
It may be prudent to stay on the sidelines until clear institutional accumulation or positive catalysts emerge to restore sentiment.
🎯TradingView Chart Setup and Usage Tips
Multi-Chart Layout: Use TradingView’s multi-chart feature to display BTCUSDT, BTC.D, USDT.D, and TOTAL3 simultaneously for comparative analysis. (Apply Coinbase Premium as an additional indicator.)
Timeframes: For short-term analysis, use 1H, 4H, or 1D; for medium- to long-term, use 1W or 1M charts. Confidence increases when multiple indicators align across the same timeframe.
Trendlines and Support/Resistance: Draw trendlines, support, and resistance on each indicator chart to identify key inflection points. Breakouts on USDT.D or BTC.D often signal major market shifts.
Supplementary Indicators: Combine RSI, MACD, or other technical indicators to detect divergences or overbought/oversold zones for added precision.
⚡Analytical Value and Considerations
Comprehensive Market Insight: Analyzing all four indicators together enhances overall market understanding.
Leading vs Lagging Indicators: Coinbase Premium can serve as a leading signal, while dominance and market cap metrics act as coincident indicators reflecting current conditions.
Probabilistic Nature: These indicators are not predictive tools but should be interpreted within a broader context of market variables.
Risk Management: Always apply stop-loss measures and manage exposure carefully. Be prepared for deviations from expected market behavior.
🌍Conclusion
Bitcoin Dominance, USDT Dominance, TOTAL3, and the Coinbase Premium Index are fundamental components in decoding the complex structure of the cryptocurrency market.
Analyzing them in conjunction enables a deeper understanding of market sentiment, anticipation of upcoming opportunities and risks, and the development of a more intelligent and stable trading strategy.
💬 If you found this analysis insightful, share your thoughts in the comments!
🚀 Don’t forget to hit Boost to support the post!
🔔 Follow to make sure you don’t miss the next market insight!
Altseason Setup? Dominance Charts Flash Key Confluence!BTC.D & USDT.D Combined Outlook 🧩
BTC Dominance is approaching the 61.8%–62.6% Fibonacci zone, a strong resistance where Bitcoin usually cools off, often leading to a liquidity shift toward altcoins.
USDT Dominance is also heading into the 6% resistance zone, which has historically acted as support for altcoins. A rejection here would signal funds rotating from stablecoins into risk assets, favoring alts.
In short:
If both BTC.D and USDT.D get rejected from their current resistance zones, we could see a strong rebound in altcoins soon. But continued strength in both would keep pressure on alts for now.
DYOR, NFA
Thanks for reading! Appreciate your support and engagement

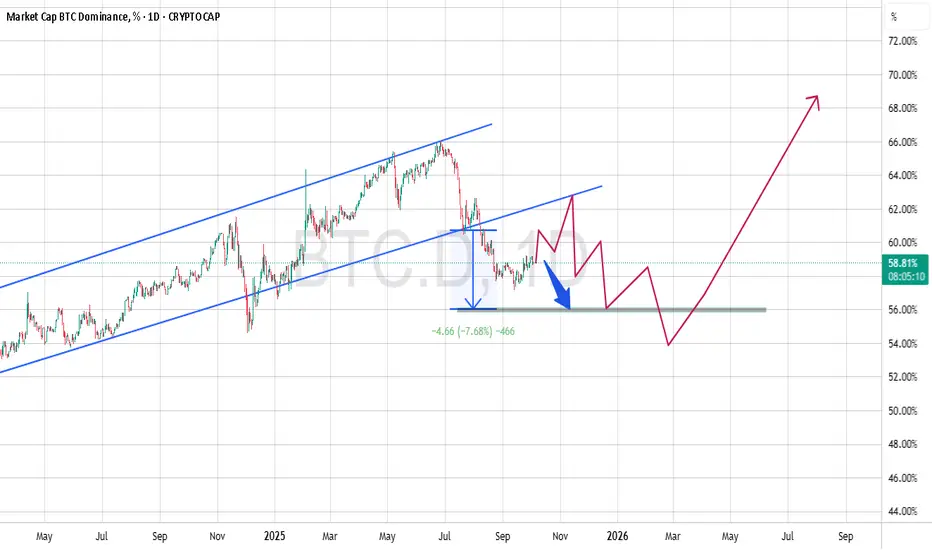
BTC.D May not TOP until next September!Despite alt/BTC pairs looking battered
**Capitulation is likely not complete**
Most Altcoins remain in downtrends v BTC
Timeline:
2025: grind to 63-65%
2026 Final Push to 73%?
Altcoins to seek relief once this finally turns around.
You may be able to start DCA'ing BTC as early as next March in preparation to buy beaten down quality Alts...
focusing on ETH, SOL, and 2's that have usage... not simply clogging up the landscape of empty chains.
$BTC.D Death Cross Has Occurred! The Signal on ₿itcoin Dominance We've Been Waiting All Cycle For 🔥
20 / 50 WMA Death Cross has officially occurred on CRYPTOCAP:BTC.D
So close to Alt Season I can taste it 😋

Altseason on the Horizon?Technically, BTC Dominance has retested the breakdown of the rising channel, confirming a clean rejection from the retest area.
If price manages to break below the current support zone, we could see a strong shift toward altcoins as capital starts rotating out of BTC.
This recent move also flushed out over-leveraged traders, resetting market positioning, a healthy sign before the next major leg.
Stay patient and always analyze your risk before entering any position. The next few weeks could be decisive for the altcoin market.
DYOR, NFA
Stay tuned for more update
THANKS FOR THE READING
#PEACE

Altcoin Fear Rising — But Liquidity Shift Is ComingI know the current pullback on altcoins has greatly increased the fear of a deeper drop, especially since Bitcoin just hit a new all-time high at $126,200 yesterday.
Yet, the Bitcoin Dominance Index (BTCDOM/USDT) shows that the price is getting ready for a major decline.
This suggests that liquidity could soon start flowing into altcoins, potentially starting this week.

BTC Dominance: Short-Term Dip or Long-Term Rally?📊 Bitcoin dominance has been cruising in an uptrend channel for a while, but it recently broke below the channel's floor, dropping to around 58%. Right now, it’s bouncing around in a key zone between the 60% resistance and 56% support.
What’s Coming Next?
🔴 Short-Term Bearish Scenario: If dominance can’t hold above 60%, we might see it slide back to the critical 56% support. This could give altcoins some breathing room and maybe even spark a decent rally. Perfect opportunity for those eyeing altcoin trades!
🟢 Long-Term Bullish Scenario: If dominance builds a solid base at 56% and starts climbing again, it could aim for 64% and even push toward 68–70%. If this plays out, Bitcoin’s gonna take charge of the market again, and altcoins might feel the heat.
The Bottom Line:
Short-Term: A drop to 56% could mean altcoins steal the show. Keep an eye on this level!
Long-Term: If Bitcoin flexes its muscles and dominance climbs to 68–70%, it’s probably time to lean heavier into BTC in your portfolio.
✍️ This analysis can be a solid guide for balancing your portfolio between Bitcoin and altcoins. Watch those 56% and 60% levels closely to make smart moves!
BTC.D Alt coins updatewait for the monthly candle closure and to form a fvg / gap, whenever it taps into the monthly fvg, start acculumating altcoins, invest good in stronger altcoins like ETH, Link, ENA, SEI, INJ and stronger memes like Doge, Fartcoin, Bonk and Turbo. These pairs are my favourite and will outperform in alt season. Because btc.d is strongly bearish that's why not giving any short signal for alts, ignore what's BTC doing. Market makers are just flushing the long / buyers before a strong impulsive moves. October first week or maybe the 2nd week may go in red then the real strong move will start. Market makers are just showing the market is strongly bearish, shifted structre to the downside trapping all smc/ict traders and other breakout traders to trap for short selling as they did in feb. Best Of Luck.

BITCOIN DOMINANCE has BROKEN DOWN Initially, we have a head and shoulders pattern that has yet to reach its target.
Additionally, there is a significant breakdown from a broadening ascending wedge.
Expanding wedge formations exhibit increasing volatility as they develop.
These ascending broadening wedge chart patterns emerge during uptrends, signalling trend continuation with higher highs and higher lows, often touching the upper and lower boundary lines of the wedge.
When the head and shoulders pattern was formed, it FAILED to reach the upper boundary.
This suggests a exhaustion of the uptrend.
The activation of the head and shoulders confirmed that a reversal was underway.
Now, we are witnessing the breakdown of the wedge, followed by back testing, which confirms the weakness of #Bitcoin compared to the #ALTS, particularly #Ethereum, of course.
I still believe that Bitcoin has higher price targets that will be achieved, so I remain optimistic about BTC.
If you own Bitcoin, it would be wise to stay with that asset and avoid getting caught up in the extreme volatility of alt coins.
For those of us who have been battling and enduring in the trenches over the past few years, the opposite holds true.
We CANNOT give in to Bitcoin maximalism at this point in the game!
This is our Time!

Altseason Index Proxy (TOTAL3 / BTC.D) Weekly TF
Symbol & Timeframe:
* **Symbol**: CRYPTOCAP\:TOTAL3 / CRYPTOCAP\:BTC.D
* **Timeframe**: Weekly (1W),
* **Purpose**: A clean, data-driven proxy for detecting altseason momentum
Technical Structure:
✅ Key Support Zones
* **13.47B (61.8% Fib)**: Critical golden zone; current price consolidation area
* **12.45B (50.0% Fib)**: Lower bound of golden zone
* **11.00B**: Historical support zone
* **8.15B (0.0%)**: Absolute bottom of retracement range
🔹 Hidden Bullish Divergence
* **MACD Histogram & Signal Lines** show hidden bullish divergence
* Price action forming **higher lows** while MACD makes **lower lows**
* Indicates trend continuation potential
🔢 Fibonacci Targets
TP1: 16.8B (100.0%)
TP2: 22.2B (161.8%)
TP3: 30.7B (261.8%)
🔄 Expected Path
* Potential short-term correction toward 12.4B followed by a breakout
* Bullish continuation path sketched with progressive Fib targets
📈 Macro & Fundamental Confluence
📉 Liquidity and Monetary Easing
* Global monetary policy is easing (e.g., Fed pivot expected mid-2025)
* Increased liquidity historically precedes strong altcoin rallies
BTC Dominance Decline
* BTC.D rolling down from long-term highs
* Signals beginning of capital rotation into altcoins
🚀 Emerging Narratives
* Rise of L2s (e.g., Base, zkSync), AI tokens, real-world asset protocols
* Fresh narratives tend to amplify altseason rotations
💼 Institutional Tailwinds
* Spot ETH ETF approvals pave way for alt ETF flows
* Regulatory clarity expected to reduce uncertainty in late 2025
Related Reference Charts:
🌐 TOTAL3 (Altcoin Market Cap Excluding BTC & ETH)
📊 BTC Dominance (BTC.D)
These charts offer standalone confirmation of:
Altcoin strength forming on TOTAL3
BTC dominance facing structural resistance
Composite Altseason Thesis:
1. Liquidity injections + halving = BTC rally
2. BTC.D breakdown + TOTAL3 support = altcoin strength
3. Technical confirmations: hidden divergence, fib confluence
4. Narrative and regulatory catalysts = widespread rotation
**Conclusion**:
We are entering a prime zone for altseason acceleration. Price reclaim above 13.47B and continued BTC.D drop will validate bullish thesis. Monitor closely for breakouts past TP1 and momentum into TP2/TP3.
📌 Current status:
- Price rebounding in the 12.45–13.47B Fibonacci zone (50–61.8%)
- Hidden bullish divergence on MACD + ascending price structure
- BTC.D has rolled off 65% resistance — suggesting capital rotation
📊 Altseason Thesis:
1. Post-halving BTC rally → profit dispersion into altcoins
2. Macro conditions (Fed pivot, record liquidity) enabling risk-on environment
3. Technical confirmation via index momentum and fib structure
4. Narrative tailwinds: Layer-2 adoption, AI-crypto, altcoin ETF catalysts
📈 Targets:
- TP1 @ 16.8B (100% Fib)
- TP2 @ 22.2B (161.8% Fib)
- TP3 @ 30.7B (261.8% Fib)
🟢 Key support: 12.45–13.47B zone; breakout + BTC.D collapse = altseason trigger.

WANT TO BEAT THE MARKET WITH CONFIDENCE?? 🚀 Want to beat the market and trade with confidence?
Follow me for expert insights and clear setups!
Back in July, I called the #BTC Dominance top before anyone else and predicted the #alts season.
That move shifted billions in capital across the market; those who followed were ahead of the game! 🏆
Every week, I share exclusive #BTC outlooks and in, depth weekly market reports with over 90% accuracy and always ahead of the curve.
Today’s spotlight:
🗓 04/09 #BTC Dominance vs now… 🎯
Key support zone: | 53% |
If we break below this levels, get ready for a big shift of capital into #alts!
Join the community, stay one step ahead, and take your trading to the next level! 🔥
