The key is whether the USDT and USDC gap downtrend will stop
Hello, fellow traders!
Follow us to get the latest information quickly.
Have a great day.
-------------------------------------
(USDT 1D chart)
USDT is showing a gap downtrend, leading to a decline in the coin market.
A gap downtrend in USDT or USDC can be interpreted as a sign of capital outflow from the coin market.
The key question is whether this gap-up will lead to another upward trend.
(USDC 1D chart)
USDC is also showing a gap-up trend.
It's worth paying attention to the movements of USDT, which has a significant impact on the coin market.
-
(USDT.D 1M chart)
USDT is showing a gap-down trend, leading to an increase in USDT dominance.
A rising USDT dominance is likely to lead to a downward trend in the coin market.
Therefore, it's beneficial to see a declining USDT dominance.
This means that funds are flowing into the coin market through USDT, and the inflow of USDT is used to purchase coins, causing USDT dominance to decline.
-
(BTC.D 1M chart)
As BTC dominance rises, I believe funds will flock to BTC, creating a BTC-led market.
Therefore, we expect an altcoin bull market to emerge when BTC dominance and USDT dominance coincide.
For this to occur, BTC dominance must fall below 55.01 and either remain stable or exhibit a downward trend.
-
Currently, USDT dominance is rising, while BTC dominance is falling.
I believe this movement is best interpreted as altcoins focusing on price defense.
The decline in BTC dominance indicates that funds are flocking to altcoins, while the rise in USDT dominance indicates a downward trend in the coin market.
-
Therefore,
we need to determine whether the upward trend of USDT and USDC can be sustained,
starting with the recent gap-up,
see whether the upward trend of USDT dominance has stalled,
and whether BTC dominance can support the price of BTC.
While the USDT, USDC, BTC.D, and USDT.D charts only provide a rough idea of the fund flow in the coin market, I believe this information alone is a valuable resource for individual investors who trade with limited information.
Therefore, I believe this is one of the reasons why the coin market is more transparent than any other investment market.
-
Thank you for reading to the end.
I wish you successful trading.
--------------------------------------------------
Btcdominance

BTC.D What's Next? Key confirmation for Altcoin movement.BTC.D
BTC Dominance is now sitting right below a major resistance at 60% – 60.30%. This area has already rejected price multiple times, so this is a decision zone. As long as BTC.D stays below 60%, dominance is vulnerable to a pullback toward 59.44% – 59.15%, which would give more room for altcoins to breathe.
If BTC.D manages to break and hold above 60.30%, then dominance expansion continues and altcoins will likely stay under pressure. Until that breakout happens, this move is still just a test of resistance, not confirmation.
Bias stays neutral here. Let the level decide.

Altcoin Season is Coming ;-) But Can you handle it??!?There is no question, that there are big players in the game... who want nothing more that just shake up the pile, and scare the weak HODLERS... in the coming months we will see more and more of that...
The Biggest Alt season IS coming there is no question about it, and it will happen ahead of 2028 Olympics, the only question remains... Are you strong enough to navigate the rough waters...?
Last few months have been brutal and it will only get worse..
Here is an update to my previous idea... Even if that idea is correct it will be hard to navigate...
it is almost as if the WHALES don't want you to make any money...
Stay strong
BTC DOMINANCE – MARKET STRUCTURE UPDATE. BTC DOMINANCE – MARKET STRUCTURE UPDATE
Current: ~59.8%
BTC Dominance is compressing inside a rising wedge, right below a major resistance zone.
Resistance: 60.5% – 60.8%
Support: 59.2% – 58.8%
Major Breakdown Zone: 57.5%
If BTC.D fails near 60.5–60.8%,
Expect Dominance drop toward 58%–57.5%
ALTCOINS likely to outperform (Altseason push) 🚀
Price is near the wedge apex → volatility incoming
Cloud + trendline rejection favors a fake breakout/rejection

Altcoins will go Parabolic in 2026! Here's why! OTHERS/BTC : The 4-Year Macro Coiling
The Observation: Altcoins (OTHERS) have been in a relentless downtrend against Bitcoin since the January 2022 top.
The Thesis: We are currently at the tail end of a 4-year cycle. History (2017 & 2021) suggests that extreme compression leads to vertical expansion.
The Target: I expect 2026-2027 to be the "Parabolic Season" as Bitcoin Dominance hits its resistance that I meantioned erilier and structural ceiling and capital rotates down the risk curve into ALTCOINS.
The Fact: OTHERS/BTC is currently retesting major historical support levels from 2020.
This isn't just a dip; it’s a cycle-bottom formation.
Im bullish for Fundamental Altcoins 2026-2027, drop in comments bellow what's your view on this and what kind of Altcoins are you holding and DCAing?
I’ve been in these trenches since 2017. This setup looks identical to the 'quiet' period before the 2021 explosion.
Is this the last shakeout before the 2026 parabola, or are Alts dead forever?
Comment your 'Moon Bag' for this cycle below, friends.

BTC Dominance | Winter "IS" ComingHello traders,
I have not check the BTC.D in a while, mainly because watching capital concentrate is never fun when your positions are bleeding.
BTC dominance on the higher timeframes continues to respect a long-term contracting channel. BTC.D has once again tapped the same descending trendline. Historically, that lead to the start of ALT season
The current break in internal structure shows that dominance has lost momentum, failed continuation, and is showing early signs of distribution. That happened twice before.
If history repeats, then:
- Q1, 2026 wil see some good ALT performance specially meme coins
- Liquidity will rotate aggressively
- Most ALTs will not make new ATHs
This phase will be your exit point. Most coins need more than 150% of current prices to visit previous ATH or make new ones. It will not happen, period.
Good Luck!
Please drop a like and share your thoughts traders.

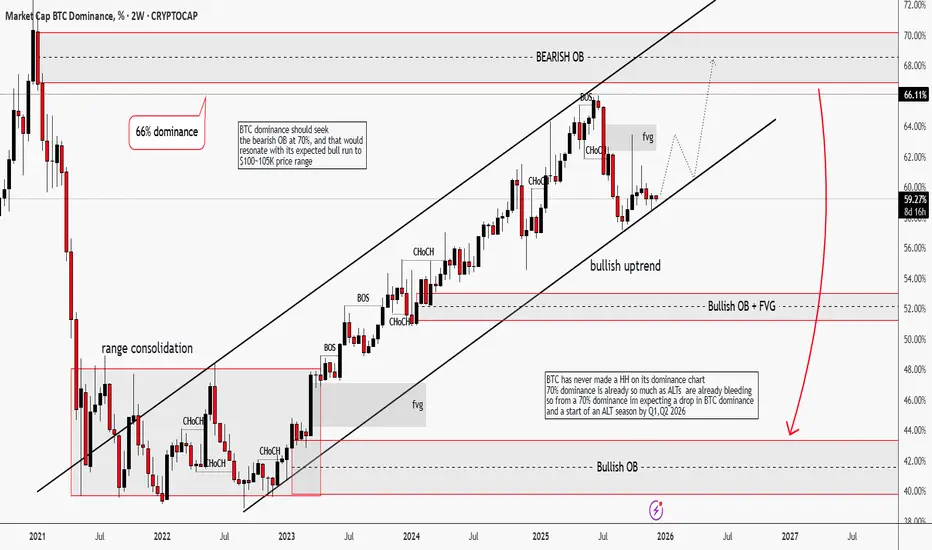
BTC Dominance | Winter is "Almost" ComingHello traders,
Its been a minute since I last checked my wallet, cause I don't love seeing red. Who loves to?
BTC dominance on the 2W timeframe has been in an impulsive bullish uptrend. Structure-wise, it has printed multiple BOS + CHoCH, which tells me that capital are still rotating into Bitcoin, not alts.
What make me believe this further, is that BTC is forming a short-term bullish structure that might target $100-105k price range
Only after BTC dominance reaches 70% area, we might start expecting shift. Distribution on BTC.D and the conditions for an ALT season.
Historically, BTC dominance has struggled to make HH that is why I'm expecting a drop from the previous Bearish OB
TL;DR: BTC dominance shall drop from the range of the bearish OB 70% which shall align with its projected bull run to $100k-105k price range. After that, we can call for ALT season.
Good Luck!
Please drop a like and share your thoughts traders.
ALTCOIN SEASON IS IMMINENT IF THIS HAPPENS!! Must Read.BTC Dominance is approaching a major long-term resistance trendline that has consistently acted as a rejection zone in previous cycles.
Key Observations:
* BTC.D has been moving inside a rising channel on the weekly timeframe.
* Price is currently testing the upper boundary of the channel along with a macro descending resistance.
* In past instances, rejections from this trendline resulted in strong altcoin rallies.
* EMA structure shows signs of weakening momentum, with repeated crossovers near resistance, often indicating trend exhaustion.
What to Expect:
* A rejection around the current levels (approximately 59–60%) would be a strong signal for capital rotation into altcoins.
* This zone historically offers a high-probability short opportunity on BTC.D, which aligns with bullish setups across quality altcoins.
* A confirmed breakdown below the channel support would further accelerate altseason momentum.
Invalidation:
* A clean weekly close above the descending resistance would invalidate the bearish dominance view and suggest continued Bitcoin strength.
Conclusion:
BTC Dominance is at a critical decision point.
Rejection favours altcoins outperforming Bitcoin, while acceptance above resistance delays the altseason narrative.
If you find this idea useful, please hit the like button to support so I can keep posting such important updates for you all.
Thank you
#PEACE

TOTAL3/BTCTOTAL3/BTC is holding very good and continue to breaks the resistance very likely in the coming weeks. All-season may be so close

BTC Dominance (BTC.D) – Chart Update. BTC Dominance (BTC.D) – Chart Update
BTC Dominance is moving inside a tight symmetrical triangle, indicating compression and a big move ahead.
Current zone: ~59.3%, hovering near the triangle’s apex.
Resistance: Downward trendline near 59.8% – 60.0%
Support: Rising trendline around 58.8% – 59.0%
Breakdown below 58.8% → Possible altcoin rally / altseason phase.
⚠️BTC.D is at a decision point. A confirmed breakout or breakdown will likely define the next market rotation.
Trade patiently and wait for confirmation.

BTC.D is about to dip – time for altcoins to shine?First of all, you should know that BTCDOM is a price index that shows Bitcoin’s market volume performance compared to altcoins. This index indicates how much market money is moving toward Bitcoin relative to other cryptocurrencies and can be useful for traders.
What is the difference between BTCDOM and BTC.D?
BTC.D: The traditional Bitcoin dominance index, showing the ratio of BTC’s market value to the total crypto market value as a percentage.
BTCDOM: A version of dominance available on Binance as a tradable instrument (futures), usually showing Bitcoin dominance relative to the top 20 altcoins (not the entire market).
The BTCDOM symbol has formed a price range, with the top of this range acting as a liquidity pool that was hunted. Now, the price is forming a double top pattern.
The trendlines have also been broken. It is expected to move soon toward the two targets marked on the chart, which could trigger a rally in altcoins.
If a daily candle closes above the invalidation level, this analysis will be invalidated.
If you have a coin or altcoin you want analyzed, first hit the like button and then comment its name so I can review it for you.
This is not a trade setup, as it has no precise stop-loss, stop, or target. I do not publish my trade setups here.

BTC Dominance (BTC.D) – Weekly Chart BTC Dominance (BTC.D) – Weekly Chart | Full Details (with 25MA and 100 MA)
BTC.D is trading within a long-term descending channel. After a strong recovery from the 2022 lows, the dominance is now stalling near the mid-range resistance (~59–60%).
25 MA: Tracks short-term momentum
BTC.D is hovering around/slightly below the 25 MA.
100 MA: The price is still above the 100 MA, meaning the overall BTC dominance trend has not yet broken down.
A break below the 100 MA would signal a significant shift towards altcoin strength.
This is a decision zone.
BTC dominance is not yet bearish, but the strength of the uptrend is weakening.
Keep a close eye on the MA — they will guide the next move.
DYOR | NFA

#RIOT and the miners pumping = AltseasonThe Bitcoin miners have quietly entered a Bull market since April, without much attention.
This indicates that investors are looking for additional risk beyond #BTC as they prepare for an exciting Altseason.
Their reasoning might arise from the perception that Bitcoin can provide only a limited return going forward based on its current point in the cycle and the outsized returns it has already delivered over $100K+ per coin from the low 3 years ago.
As you can see, RIOT has recently broken out of an inverse head and shoulders pattern against Bitcoin dominance.
Historically, when this pattern has emerged in the previous two cycles, the logarithmic target has been achieved and even exceeded, coinciding with strong altcoin performance.
We have much to look forward to in the upcoming months.

The Crypto Money Flow CycleThe capital rotation cycle in the crypto market is not a theoretical concept, but a phenomenon that has repeated itself across multiple growth cycles. It reflects the natural behavior of capital flows: starting from the safest assets, then gradually spreading to higher-volatility instruments as confidence and risk appetite increase. Typically, capital first flows into Bitcoin — the foundational asset and “anchor” of the entire market — before rotating into Ethereum, a core ecosystem that consistently attracts strong inflows once market conditions stabilize.
When these two pillars begin to slow down, capital expands into large-cap altcoins, then accelerates into meme coins, and ultimately ends in the riskiest assets such as shitcoins. This is the point at which the market reaches peak heat: potential returns are enormous, but risk is also at its highest level.
If Bitcoin is the main river, Ethereum represents the major tributaries, altcoins are the canal system, and meme coins and shitcoins are the stagnant waters at the very end of the flow — the murkiest area, but also the place where many investors are most likely to “drown.” The imagery may sound harsh, but it accurately captures the market’s nature: the higher the potential return, the greater the downside, and near the end of the cycle, even a small variable can push the entire structure into chaos.
Understanding this cycle not only helps investors identify where the market currently stands, but also supports more rational capital allocation decisions. When capital is still concentrated in BTC and ETH, rushing into shitcoins offers little advantage and only increases the risk of capital loss. Conversely, when the market enters its euphoric phase, FOMO often overrides logic: newcomers rush in just as smart money is preparing to exit. Recognizing the cycle helps avoid these traps. It also explains the common frustration of “the coin I hold goes nowhere while others keep pumping,” because you understand where capital is flowing instead of investing based on emotion.
To accurately identify the market’s position within the cycle, it is essential to observe behavior at each stage. When BTC rallies strongly and BTC Dominance rises, capital is in the early phase. This is the time to focus on Bitcoin and avoid smaller altcoins, as they usually underperform when dominance expands. When Bitcoin starts to slow down, moving sideways or correcting slightly while the ETH/BTC pair trends steadily higher, capital is rotating into Ethereum. This phase often favors increasing exposure to ETH.
When both BTC and ETH stall, the market enters Altcoin Season. Altcoins with solid fundamentals, mid-to-large market capitalizations, and clear narratives become the primary destinations for capital. This is when Layer-1, Layer-2, DeFi, AI, and RWA sectors tend to perform strongly. However, this is still not the right time to dive into meme coins and shitcoins, as the market remains in the “mid-cycle” phase, where performance belongs to fundamentally backed assets rather than purely speculative tokens.
The final — and most dangerous — stage is when meme coins and shitcoins explode. The clearest signs are social media being flooded with x20, x50, or x100 stories and near-vertical price charts detached from any real product or utility. This is when smart money gradually exits, leaving the stage to new participants driven by euphoria. If participation is unavoidable, only a very small portion of capital should be allocated, with a mindset of “fast in, fast out,” because risk in this environment can materialize within hours.
To navigate the full cycle effectively, several indicators should be monitored consistently. BTC Dominance reveals whether the market is prioritizing safety or expanding toward risk. Market capitalization and liquidity determine both upside potential and downside resilience. Finally, the risk-on/risk-off environment clearly reflects investors’ willingness to take risk. When the market shifts to risk-on, altcoins and meme coins tend to surge; when it turns risk-off, capital typically flows back into BTC or stablecoins for defense.

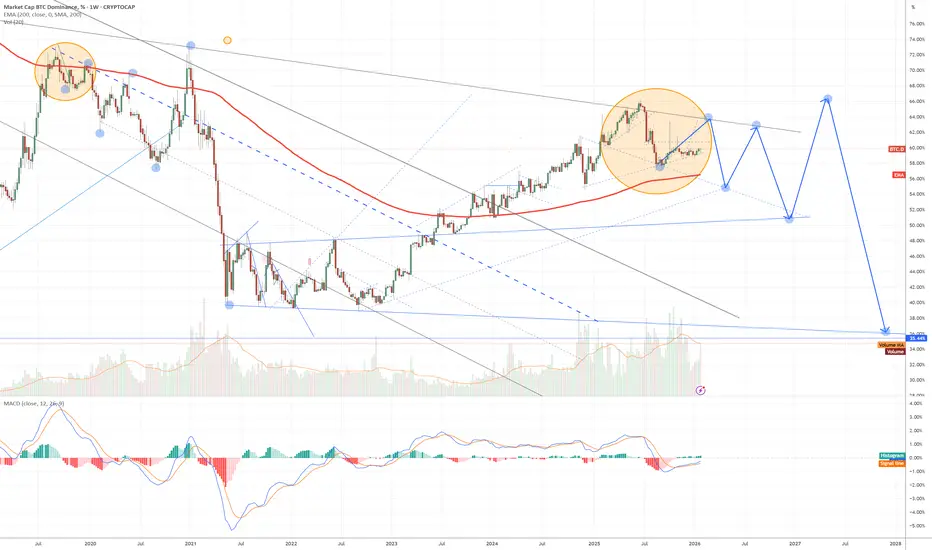
Bitcoin Dominance / BEARISH ! 💥 BITCOIN DOMINANCE (BTC.D)
**Chart:** Weekly (1W)
This weekly BTC.D chart clearly outlines the **major cycles** that have shaped the market structure from 2017 to the present. Specifically, the **35% and 39%** levels are **critically important** for cycle bottoms.
🎯 History Repeats Itself: Major Cycle Peaks and Drops
The chart illustrates how Bitcoin Dominance (BTC.D) has dropped from massive peaks, and how these drops have opened the door to **Altcoin Seasons**:
1. **2017 Mega Bull Peak (95% $\rightarrow$ 35%):**
* The first major rally pushed Dominance to **95%**. This was a period where the market was almost entirely focused on Bitcoin.
* As the market matured and Altcoins gained popularity, BTC.D rapidly fell to **35%**. This drop coincided with the largest **"Altcoin Season"** in history. The **35%** level is the **lowest support** point we have seen so far.
2. **2021 Bull Peak Recurrence (72% $\rightarrow$ 39%):**
* In the 2020-2021 rally, the Dominance peak remained around **72%**, indicating a more balanced market compared to 2017.
* The subsequent drop brought Dominance to the **39%** level, setting the stage for the big Altcoin rally of 2021. **39%** serves as the most important **secondary support/major bottom** since 2018.
📈 Current Situation: Searching for the New Cycle Peak
We can observe that since the beginning of 2023, we have been within a rising channel:
* **Ascending Trend Support:** Since early 2023, Dominance has been moving above the **ascending trend line** shown with the dashed line. This confirms that a major Altcoin rotation has not yet begun, and Bitcoin still dominates the market.
* **Recent Peak (66%):** In early 2025, Dominance made a local peak around **66%**. This peak is below the previous 72% peak, a trend that suggests Altcoins' share of the total market is **increasing** with each cycle.
* **In-Channel Correction:** Dominance has currently entered a corrective move from the **66%** peak and is pulling back towards the ascending trend line.
The large orange arrow on the chart points to a **strong expectation** for the upcoming period.
1. The Altcoin Season (Expected and Main Scenario):
The large orange arrows indicate that Dominance is expected to head towards the critical support levels with a **sharp drop**. If the current correction continues and Dominance breaks below the ascending trend line, the target will likely be:
First Critical Support:** The **39%** level. This level is the 2021-2022 cycle bottom and is -strong psychological support.
Ultimate Target (Mega Altcoin Season):** The **35%** level. If the market experiences an Altcoin frenzy similar to 2017, this lowest level may be retested or slightly undercut.
> **TECHNICAL CONCLUSION:** The **66%** peak could be the Dominance peak for the 2025/2026 cycle. A drop initiating from here will trigger a **historic Altcoin Season**.
🔥 FINAL VERDICT: The Cryptollica Move
This pullback in Dominance from **66%** suggests that **we must turn our attention to ALTCOINS**. Technically, the moment Dominance breaks this trend line, the **rotation of large capital from Bitcoin to Altcoins** will begin, and the targets in the **39% - 35%** range will be activated.
> **Trader's Note:** We are entering a period where it makes sense to **increase risk appetite** and **take positions in the Altcoin portfolio**. A Dominance drop will cause Altcoins to *surge* on their CRYPTOCAP:BTC $ pair, even if the CRYPTOCAP:BTC $ price remains stable.
That's an excellent move! Combining the bearish Bitcoin Dominance (BTC.D) scenario with the **ETH/BTC** parity chart allows us to understand the Altcoin Season expectation and where capital is most likely to flow.
---
👑 The Role of the ETH/BTC Parity: The Leadership Indicator
Historically, when Bitcoin Dominance begins to fall, **Ethereum (ETH)** takes the lead in the market capital flow and pulls other Altcoins along with it.
1. Historical Correlation:
* **When BTC.D Peaks:** The ETH/BTC parity usually **bottoms out** or consolidates within a strong support zone. This is the moment when capital first flows into BTC and reaches saturation.
* **When BTC.D Starts to Drop:** The ETH/BTC parity begins a **powerful rally**. This is the official start of the Altcoin Season, where capital spreads from BTC, first to ETH, and then to other Altcoins.
2. Current ETH/BTC Expectation:
If BTC.D enters a **downtrend** from 66%, the expected move in the ETH/BTC parity is as follows:
Strong Bottom Confirmation:The parity must execute an **upward breakout** from a long-term consolidation or bottom level (likely the $0.05$ - $0.06$ BTC range).
Bullish Signal: A breakout of a significant resistance level in ETH/BTC (e.g., $0.07$ or $0.08$ BTC), simultaneously with the BTC.D trend line break, will be the **strongest technical signal that the Altcoin Season has officially begun.
Targets: The initial targets for the ETH/BTC parity could be the 2021 peaks at the $0.08$ - $0.09$ BTC levels, with the ultimate target being the 2017 peaks above $0.1$ BTC.
By combining these two charts, the strategy aiming for the **highest return** is:
| Condition per Chart | Market Impact | Action (Trader Decision) |
| **BTC.D** **Breaks Below** the Ascending Trend (pprox %55) | Capital outflow from Bitcoin begins. | Start **Main Altcoin Accumulation**. |
| **ETH/BTC** **Breaks Above** the Main Resistance ($\approx 0.07-0.08$ BTC) | Altcoin rally leader is confirmed. | Increase **ETH positions** and complete **other Altcoin purchases**. |
| **BTC.D** reaches %39 or %35 | The Altcoin market has reached saturation. | **Take Profit** and shift to an exit strategy. |
---
**In Summary:** The drop in BTC.D confirms the existence of an **Altcoin Season**, while the **rise in the ETH/BTC parity** will confirm the strength of this season and **Ethereum's leadership**.
By following this dual signal, we can capture the flow of capital within the market in the most efficient way.

Altcoins are loading. BTC Dominance is in a downward retest following the recent breakout.
ETH/BTC confirmed its upward breakout.
The apparent silence is actually the sound of an impending power shift.
CRYPTOCAP:BTC.D vs. BINANCE:ETHBTC

$BTC.D ANALYSISBTC dominance on the 1-day chart is showing a short-term recovery after finding strong support near the 58.5 %–58.6 % zone, which has acted as a demand area multiple times. After a clean rebound from this region, dominance has moved back above the lower boundary of the green zone with increasing volume, indicating buyers stepping in. However, it is now approaching the 59.8 %–60 % resistance, and the Ichimoku cloud above suggests that upside momentum may face some struggle before a clear breakout.
The overall trend remains neutral-to-bullish in the short term as long as price holds above 59 %. A breakout and daily close above 60.2 %–60.5 % would confirm renewed BTC strength over altcoins, likely causing altcoin weakness. Conversely, rejection from this resistance could lead to another pullback toward 58.8 %–58.5 % support. The next few daily candles will decide whether dominance continues its climb toward 61 % or consolidates in this range.

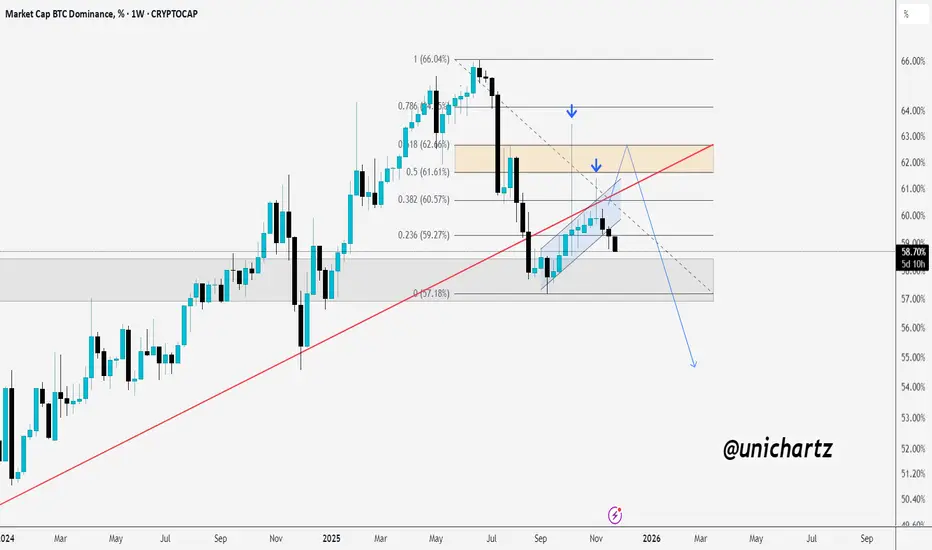
BTC.D Pullback Could Open Doors for AltsBTC dominance has broken below its long-term trendline and is currently holding near the 58–59% support zone, but momentum still appears weak.
The key resistance area sits between 61% and 62.5%, and any retest of this zone may struggle to break higher, especially with its alignment to major Fibonacci levels.
If BTC dominance fails to reclaim this zone with strength, the broader structure points toward continued downside, potentially targeting the 57% level and possibly lower if that support breaks.
A continued decline in dominance would generally favor altcoins, so it’s best to wait for clear confirmation before making any decisions.
DYOR, NFA
Please hit the like button if you like it, and share your views in the comments section.
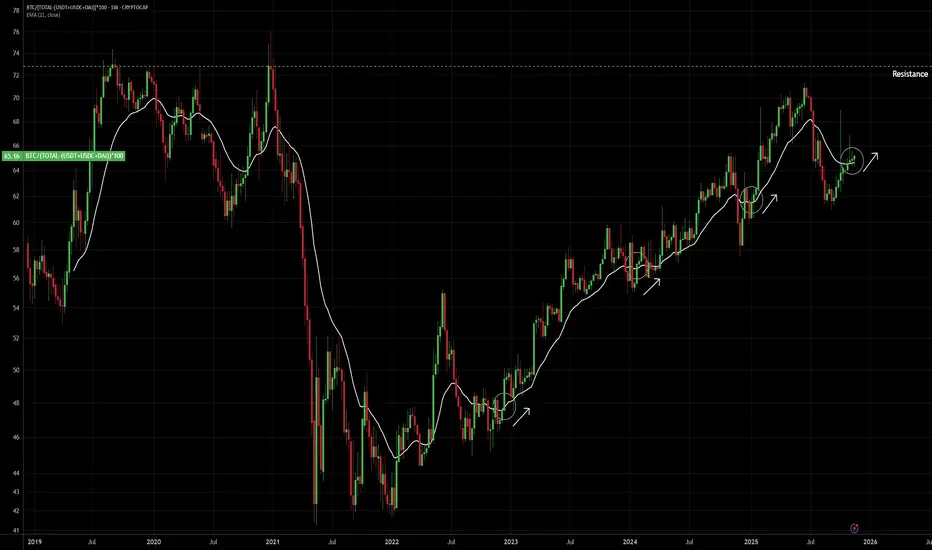
REAL BTC Dominance removing USDT/USDCThis is real BTC Dominance Chart By subtracting Mcap of major stablecoins like USDT, USDC and DAI.
The major misconception that has gripped the crypto market is the gross BTC Dominance.
From 2022, there has been an enormous amount of stablecoin creation by multiple US firms. The Stablecoins are not just used in purchase of crypto assets, but also used in holding real dollar currency in several countries whose national currency is in trouble. Even the Black economy is slowly transitioning from Cash business to USD stables.
The Real BTC Dominance should be a parameter of BTC market cap divided by the total Actual mcap of ETh and all other coins and tokens. That is how we used to judge the BTC dominance prior to 2020 (in 2020 the stablecoin economy was very small and almost entirely used for buying crypto assets only). Since today the USD stablecoin economy is increased enormously, we need to subtract the market cap of the stablecoins to get the real BTC dominance.
In this chart, we have subtracted the 3 major stablecoins USDT, USDC, DAI. There are many other stablecoins that are not taken into account because the newer Stablecoins will limit the Chart from 2023 onwards thus hampering the ability to see chart before 2020.
This chart is clearly bullish and currently above 21 week EMA.
FireHoseReel | USDT Dominance & BTC Dominance Overview😄 Hey! How’s everything? Hope you’re doing great!
🍾 Welcome to FireHoseReel — make sure to follow and enjoy the analysis along the way.
If you ever want a custom chart breakdown, just leave a comment and I’ve got you.
😎 Let’s dive into the analysis of two major crypto dominances: USDT and Bitcoin.
✔️ USDT Dominance Technical Analysis
• On the 4-hour timeframe of USDT dominance, we can see that after repeatedly breaking through multiple resistance levels on the chart, USDT.D has reached a point of heavy overbought conditions. It’s now sitting at a strong resistance zone.
If this resistance breaks, USDT dominance could push even higher, which would bring additional downward pressure on the market, especially on Bitcoin and altcoins, leading to another wave of selling.
• If USDT dominance rejects from this zone and starts moving downward, the nearest support to be tested is around 6.148%. Losing this support would signal the beginning of the first bullish wave in the market, giving us a potential opportunity to start opening long positions once this level breaks down.
• Another key level is the resistance at 6.623%.
If USDT dominance breaks above this level, it could trigger an even stronger bearish wave compared to the previous one, causing a deeper correction across the market.
✔️ BTC Dominance Technical Analysis
• On the 4-hour timeframe of Bitcoin dominance, we can see that after the recent market drop, BTC.D also moved downward and went through a relatively deep correction.
What’s important here is that despite the decline in Bitcoin dominance, altcoins did not experience a heavy correction, and most of them held their levels without major downside movement.
• If Bitcoin dominance loses the 58.80% level, it could extend its correction even further.
However, the key reversal zone for the 4-hour trend lies at 59.31%. A breakout above this level can trigger a solid bullish wave in BTC.D.
• Our confirmation for this bullish wave would be the formation of a higher low above this resistance zone, signaling a potential upward trend continuation.
🛞 Risk Management & Disclaimer
Please remember to always use proper risk management and position sizing. Nothing in this analysis is financial advice. The market can change quickly, so always trade based on your own strategy, research, and risk tolerance. You are fully responsible for your own trades.

BTC.D fractalMy expectations about BTC.D, the pattern looks similar to what was happening in 2019-2020, and I guess when BTC will start consolidating around $93-$99k, all BTC liquidity might be flowed to altcoins and it will be a good opportunity to sell all your altcoins. I hope it will reach the 54% level where I'm gonna sell all my spot positions. I'm in the red right now but still patiently waiting for the bull run, but I think I will never invest in altcoins anymore because it’s kind of very risky to buy them again.

BTC Dominance Weekly Chart Analysis.BTC Dominance Weekly Chart Analysis.
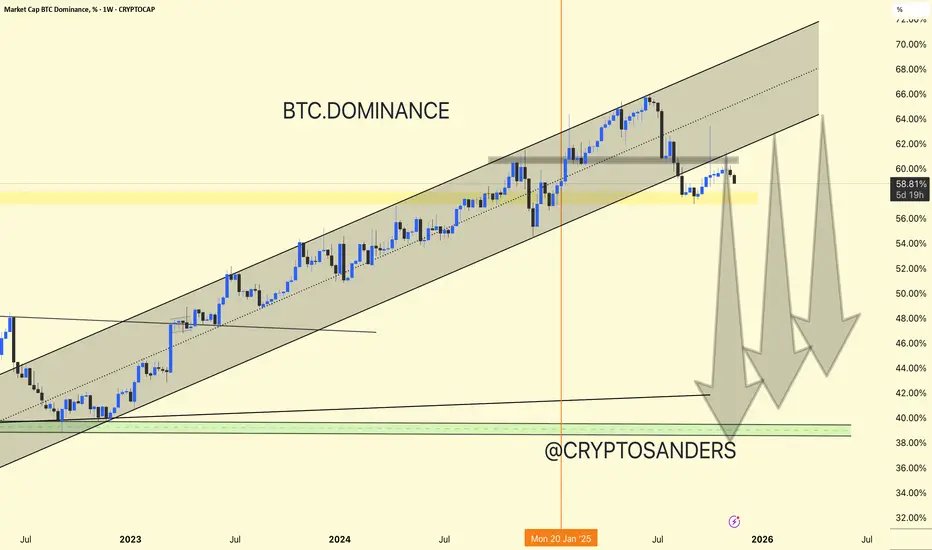
BTC Dominance (% of total crypto market cap) spent most of 2023–2025 in a strong uptrend, forming a rising channel.
Recent Reversal: After peaking above 68%, dominance has broken below the lower channel boundary and is currently retesting previous support-turned-resistance near 60%.
Dominance is hovering above the important yellow horizontal zone (~58%). A sustained move below this could accelerate the downtrend, with further downside targets near the green zone around 40–42%.
Projection: The chart indicates the possibility of a large “altcoin season” ahead (altcoins outperforming BTC) if dominance continues lower. Sharp arrows mark multiple possible legs down, hinting at a prolonged reduction in BTC’s share.
Summary:
BTC.D has broken its major uptrend channel and is now vulnerable. If support at 58% breaks, expect capital rotation into altcoins to intensify, possibly pushing dominance as low as 40% over the coming months
DYOR | NFA
BTC Dominance Analysis – 1D📊
1. Main Trend
BTC.D is still moving within a large, ascending trend channel (yellow lines).
The price has currently rebounded from the lower band of the channel and is heading towards its center.
The long-term trend remains bullish, but short-term momentum is weakening.
📈 Key Levels on the Chart
Supports
59.20% – currently tested support + EMA 50 and SMA 50
→ a very important level. Its loss = downward pressure on BTC.D, favorable for altcoins.
58.24% – next strong support level
→ if 59.20% falls, a move to 58.24% is very likely.
57.05% – key structural support
→ breakout = the ascending trend is broken, altcoin season is off to a strong start.
Resistance
60.87% – local resistance from multiple candles + MA/EMA crossover
61.65% – strong upside target
64.68% – trend extreme (upper band of the channel)
→ if BTC moves solo, this level will be tested.
🔵 EMA / SMA 50/200
I can see a few key things in the screenshot:
The 50 EMA is below the 200 EMA – technically a death cross → a short-term bearish structure.
The price is exactly below the 200 EMA and stuck to the 50 EMA.
→ this is a typical consolidation zone before a breakout.
Conclusion:
If BTC.D breaks 60.8% → momentum returns to BTC's side.
If it falls below 59.20% → altcoins receive a signal to rebound.
🔴 MACD
The MACD is above 0, but the crossing line is bearish (the blue line crosses the signal from above).
The histogram turns red.
Conclusion:
Momentum is decreasing → a short-term bearish signal.
🟣 RSI
RSI is around 53, which is neutral.
A downward breakout of the MA onto the RSI → a weakening impulse.
Conclusion:
The RSI does not support a strong move either up or down — but the slight slope suggests a correction.
📌 SCENARIOS
🟢 Bullish (pro-BTC)
Condition: 60.8% breakout
➡️ Targets:
61.6%
64.6% (channel top)
This means:
➡️ BTC dominates the market
➡️ ALTs are bleeding or stagnating
🔴 Bearish (pro-alts)
Condition: 59.20% breakout
➡️ Bearish targets:
58.24%
57.05% → and this is where the real alt season begins
This means:
➡️ Alts are starting to pump harder
➡️ BTC is losing dominance
🟡 Neutral / sideway
BTC.D between 59.2% and 60.8%
→ range consolidation, lack of major market decision
→ typical for periods when the entire crypto market stands still and "waits"
