BTC ETH SOL Quick Update Next 3 DaysFollow me here on TW for my regular critical updates on crypto (BTC, ETH, SOL, MSTR) and metals (GLD, SL, PL) based on Martin Armstrong's Socrates.
Look in my TW Ideas for posts of each market individually.
Tomorrow, Tuesday 10th is no longer showing up as a VERY STRONG target , it appears new patterns are being formed between today and Wednesday.
The bias is to push higher because all 3 metals are poised to push higher this week. Let's see where the price goes.
¡Good luck! 🙏🏻
Btcforecast

BTC ¡WARNING! Looking Pretty Bad At This MomentFollow me here on TW for my regular critical updates on crypto (BTC, ETH, SOL, MSTR) and metals (GLD, SL, PL) based on Martin Armstrong's Socrates.
Look in my TW Ideas for posts of each market individually.
It's looking bad for BTC ETH SOL 😐 we have WEEKLY TARGETS this coming week with a POSSIBLE HIGH on Tuesday 10th then it appears to be a CONTINUED DECLINE unless it manages to CLOSE ABOVE the levels on the chart to imply they are gaining momentum after this week.
¡Good luck! 🙏🏻

ETH ¡WARNING! Looking Pretty Bad At This MomentFollow me here on TW for my regular critical updates on crypto (BTC, ETH, SOL, MSTR) and metals (GLD, SL, PL) based on Martin Armstrong's Socrates.
Look in my TW Ideas for posts of each market individually.
It's looking bad for BTC ETH SOL 😐 we have WEEKLY TARGETS this coming week with a POSSIBLE HIGH on Tuesday 10th then it appears to be a CONTINUED DECLINE unless it manages to CLOSE ABOVE the levels on the chart to imply they are gaining momentum after this week.
¡Good luck! 🙏🏻

SOL ¡WARNING! Looking Pretty Bad At This MomentFollow me here on TW for my regular critical updates on crypto (BTC, ETH, SOL, MSTR) and metals (GLD, SL, PL) based on Martin Armstrong's Socrates.
Look in my TW Ideas for posts of each market individually.
It's looking bad for BTC ETH SOL 😐 we have WEEKLY TARGETS this coming week with a POSSIBLE HIGH on Tuesday 10th then it appears to be a CONTINUED DECLINE unless it manages to CLOSE ABOVE the levels on the chart to imply they are gaining momentum after this week.
¡Good luck! 🙏🏻

MSTR Monthly OutlookFollow me here on TW for my regular critical updates on crypto (BTC, ETH, SOL, MSTR) and metals (GLD, SL, PL) based on Martin Armstrong's Socrates.
Look in my TW Ideas for posts of each market individually.
All 4 crypto markets BTC ETH SOL MSTR are currently crossing MONTHLY REVERSAL levels, considered the STRONGEST of all levels. The fact that they're crossing at the beginning of the month and not at the end of the month tells me that they could see a strong bounce from these levels.
The MONTHLY STOCHASTICS are calling for a long-term decline, therefore we will most likely see a return to these levels and perhaps monthly closes BELOW these levels in the near future.
ETH is the only one of the 4 that closed January below a MONTHLY @ $2898 so, we should see a return to retest this reversal before a further decline.
This is a VERY STRONG WEEK for BTC and ETH, the Daily TARGETS are today and tomorrow but these Daily have been shifting day after day.
Gold and Silver have STRONG TARGETS for today, so, we could see a strong bounce on all markets into next week.
Good luck and stay safe! 🙏🏻

SOL Monthly OutlookFollow me here on TW for my regular critical updates on crypto (BTC, ETH, SOL, MSTR) and metals (GLD, SL, PL) based on Martin Armstrong's Socrates.
Look in my TW Ideas for posts of each market individually.
All 4 crypto markets BTC ETH SOL MSTR are currently crossing MONTHLY REVERSAL levels, considered the STRONGEST of all levels. The fact that they're crossing at the beginning of the month and not at the end of the month tells me that they could see a strong bounce from these levels.
The MONTHLY STOCHASTICS are calling for a long-term decline, therefore we will most likely see a return to these levels and perhaps monthly closes BELOW these levels in the near future.
ETH is the only one of the 4 that closed January below a MONTHLY @ $2898 so, we should see a return to retest this reversal before a further decline.
This is a VERY STRONG WEEK for BTC and ETH, the Daily TARGETS are today and tomorrow but these Daily have been shifting day after day.
Gold and Silver have STRONG TARGETS for today, so, we could see a strong bounce on all markets into next week.
Good luck and stay safe! 🙏🏻

ETH Monthly OutlookFollow me here on TW for my regular critical updates on crypto (BTC, ETH, SOL, MSTR) and metals (GLD, SL, PL) based on Martin Armstrong's Socrates.
Look in my TW Ideas for posts of each market individually.
All 4 crypto markets BTC ETH SOL MSTR are currently crossing MONTHLY REVERSAL levels, considered the STRONGEST of all levels. The fact that they're crossing at the beginning of the month and not at the end of the month tells me that they could see a strong bounce from these levels.
The MONTHLY STOCHASTICS are calling for a long-term decline, therefore we will most likely see a return to these levels and perhaps monthly closes BELOW these levels in the near future.
ETH is the only one of the 4 that closed January below a MONTHLY @ $2898 so, we should see a return to retest this reversal before a further decline.
This is a VERY STRONG WEEK for BTC and ETH, the Daily TARGETS are today and tomorrow but these Daily have been shifting day after day.
Gold and Silver have STRONG TARGETS for today, so, we could see a strong bounce on all markets into next week.
Good luck and stay safe! 🙏🏻

BTC Monthly OutlookFollow me here on TW for my regular critical updates on crypto (BTC, ETH, SOL, MSTR) and metals (GLD, SL, PL) based on Martin Armstrong's Socrates.
Look in my TW Ideas for posts of each market individually.
All 4 crypto markets BTC ETH SOL MSTR are currently crossing MONTHLY REVERSAL levels, considered the STRONGEST of all levels. The fact that they're crossing at the beginning of the month and not at the end of the month tells me that they could see a strong bounce from these levels.
The MONTHLY STOCHASTICS are calling for a long-term decline, therefore we will most likely see a return to these levels and perhaps monthly closes BELOW these levels in the near future.
ETH is the only one of the 4 that closed January below a MONTHLY @ $2898 so, we should see a return to retest this reversal before a further decline.
This is a VERY STRONG WEEK for BTC and ETH, the Daily TARGETS are today and tomorrow but these Daily have been shifting day after day.
Gold and Silver have STRONG TARGETS for today, so, we could see a strong bounce on all markets into next week.
Good luck and stay safe! 🙏🏻
BTC Quick Update: For What It's Worth...Follow me here on TW for my regular critical updates on crypto (BTC, ETH, SOL, MSTR) and metals (GLD, SL, PL) based on Martin Armstrong's Socrates.
Look in my TW Ideas for posts of each market individually.
I always say that bouncing strongly from the reversals is very bullish but I've been saying this since Saturday and this market simply refuses to stop dumping.
This week is the VERY STRONG TARGET that I've been pointing to for the past 2 weeks. At one point it seemed as if it was going to RALLY but it failed on January 28th and here we are: hanging by a thread.
Socrates called that yesterday was a POSSIBLE KEY TARGET but it warned it could still decline. If tomorrow's analysis calls today the bottom then it could finally begin rallying for real. If we get a CYCLE INVERSION this week and instead of bouncing it keeps dumping then it won't stop for another 2 weeks 💀
Good luck and stay safe! 🙏🏻

SOL ¡WARNING! Incoming Bloodbath AheadFollow me here on TW for my regular critical updates on crypto (BTC, ETH, SOL, MSTR) and metals (GLD, SL, PL) based on Martin Armstrong's Socrates.
Look at my BTC post for exact weekly timing:
BTC ¡WARNING! Incoming Bloodbath Ahead
BTC: just tested exactly the bottom of a long-term UPTREND MONTHLY CHANNEL. January was a VERY STRONG TARGET and MAIN CYCLICAL EVENT. The WEEKLY Stochastic is showing that this liquidation is over HOWEVER, the MONTHLY is still pointing to a longer-term correction so, CAUTION IS WARRANTED. It should attempt to make a HIGH here in February and into March then a further decline is possible in March and April. It's possible to start rallying this week for a bounce.
ETH & SOL: February & March look similar to BTC however... looking at the MONTHLY STOCHASTIC... after March it looks like ETH and SOL will get absolutely CRUSHED 💩🪠
Good luck and stay safe! 🙏🏻

ETH ¡WARNING! Incoming Bloodbath AheadFollow me here on TW for my regular critical updates on crypto (BTC, ETH, SOL, MSTR) and metals (GLD, SL, PL) based on Martin Armstrong's Socrates.
Look at my BTC post for exact weekly timing:
BTC ¡WARNING! Incoming Bloodbath Ahead
BTC: just tested exactly the bottom of a long-term UPTREND MONTHLY CHANNEL. January was a VERY STRONG TARGET and MAIN CYCLICAL EVENT. The WEEKLY Stochastic is showing that this liquidation is over HOWEVER, the MONTHLY is still pointing to a longer-term correction so, CAUTION IS WARRANTED. It should attempt to make a HIGH here in February and into March then a further decline is possible in March and April. It's possible to start rallying this week for a bounce.
ETH & SOL: February & March look similar to BTC however... looking at the MONTHLY STOCHASTIC... after March it looks like ETH and SOL will get absolutely CRUSHED 💩🪠
Good luck and stay safe! 🙏🏻

BTC ¡WARNING! Incoming Bloodbath AheadFollow me here on TW for my regular critical updates on crypto (BTC, ETH, SOL, MSTR) and metals (GLD, SL, PL) based on Martin Armstrong's Socrates.
Look in my TW Ideas for posts of each market individually.
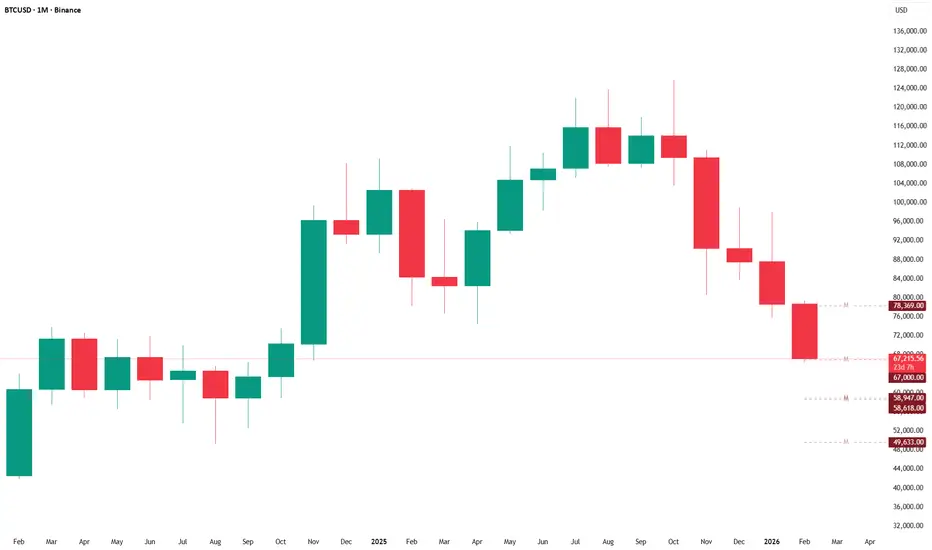
BTC: just tested exactly the bottom of a long-term UPTREND MONTHLY CHANNEL. January was a VERY STRONG TARGET and MAIN CYCLICAL EVENT. The WEEKLY Stochastic is showing that this liquidation is over HOWEVER, the MONTHLY is still pointing to a longer-term correction so, CAUTION IS WARRANTED. It should attempt to make a HIGH here in February and into March then a further decline is possible in March and April. It's possible to start rallying this week for a bounce.
ETH & SOL: February & March look similar to BTC however... looking at the MONTHLY STOCHASTIC... after March it looks like ETH and SOL will get absolutely CRUSHED 💩🪠
Good luck and stay safe! 🙏🏻

SOL Possible Rally Then Collapse In MarchFollow me here on TW for my regular critical updates on crypto (BTC, ETH, SOL, MSTR) and metals (GLD, SL, PL) based on Martin Armstrong's Socrates.
Look in my TW Ideas for posts of each market individually.
First off ¡¡¡DO NOT SELL THIS CURRENT CRASH!!!
BTC: just tested exactly the bottom of a long-term UPTREND MONTHLY CHANNEL . January was a VERY STRONG TARGET and MAIN CYCLICAL EVENT . The WEEKLY Stochastic is showing that this liquidation is over HOWEVER, the MONTHLY is still pointing to a longer-term correction so, CAUTION IS WARRANTED . It should attempt to make a HIGH here in February and into March then a further decline is possible in March and April. Yesterday the 31st was a KEY TARGET and it's possible to start rallying.
ETH & SOL: February & March look similar to BTC however... looking at the MONTHLY STOCHASTIC ... after March it looks like ETH and SOL could get absolutely CRUSHED 💩🪠
The next possible WEEKLY TARGET for a HIGH before a further collapse is March 16th .
Good luck and stay safe! 🙏🏻

ETH Possible Rally Then Collapse In MarchFollow me here on TW for my regular critical updates on crypto (BTC, ETH, SOL, MSTR) and metals (GLD, SL, PL) based on Martin Armstrong's Socrates.
Look in my TW Ideas for posts of each market individually.
First off ¡¡¡DO NOT SELL THIS CURRENT CRASH!!!
BTC: just tested exactly the bottom of a long-term UPTREND MONTHLY CHANNEL . January was a VERY STRONG TARGET and MAIN CYCLICAL EVENT . The WEEKLY Stochastic is showing that this liquidation is over HOWEVER, the MONTHLY is still pointing to a longer-term correction so, CAUTION IS WARRANTED . It should attempt to make a HIGH here in February and into March then a further decline is possible in March and April. Yesterday the 31st was a KEY TARGET and it's possible to start rallying.
ETH & SOL: February & March look similar to BTC however... looking at the MONTHLY STOCHASTIC ... after March it looks like ETH and SOL could get absolutely CRUSHED 💩🪠
The next possible WEEKLY TARGET for a HIGH before a further collapse is March 16th .
Good luck and stay safe! 🙏🏻

BTC Possible Rally Then Collapse In MarchFollow me here on TW for my regular critical updates on crypto (BTC, ETH, SOL, MSTR) and metals (GLD, SL, PL) based on Martin Armstrong's Socrates.
Look in my TW Ideas for posts of each market individually.
First off ¡¡¡DO NOT SELL THIS CURRENT CRASH!!!
BTC: just tested exactly the bottom of a long-term UPTREND MONTHLY CHANNEL . January was a VERY STRONG TARGET and MAIN CYCLICAL EVENT . The WEEKLY Stochastic is showing that this liquidation is over HOWEVER, the MONTHLY is still pointing to a longer-term correction so, CAUTION IS WARRANTED . It should attempt to make a HIGH here in February and into March then a further decline is possible in March and April. Yesterday the 31st was a KEY TARGET and it's possible to start rallying.
ETH & SOL: February & March look similar to BTC however... looking at the MONTHLY STOCHASTIC ... after March it looks like ETH and SOL could get absolutely CRUSHED 💩🪠
The next possible WEEKLY TARGET for a HIGH before a further collapse is March 16th .
Good luck and stay safe! 🙏🏻

MSTR MicroStrategy ¡CRITICAL UPDATE! As Bullish As It GetsHello! Please give this idea a boost and follow me here on TW for my regular critical updates on crypto (BTC, ETH, SOL, MSTR) and metals (GLD, SL, PL) based on Martin Armstrong's Socrates.
Well! what an awful crypto breakdown along with everything else 😢 I guess I'm just thankful that I did not get liquidated 😮
Look in my TW Ideas for posts of each market individually.
First off ¡¡¡DO NOT SELL THIS CURRENT CRASH!!!
MSTR market has already closed for the month and what I am reading from the MONTHLY TIMING ARRAY is SUPER BULLISH 😮🚀 unless it decides to absolutely nose-dive and continue crashing, maybe pushed down by a Metals market correction BUT, let's keep in mind that MSTR likes to be AHEAD of the crypto markets in both directions and I am suspecting a possible strong bounce in crypto for February/March thus confirming that MSTR is perhaps getting ahead of the rally.
MONTHLY: Socrates is suggesting a clear-cut direction: January was a KEY TARGET with an opposite direction into March. Simple, there's nothing else to it, no IFs and BUTs.
The real BULLISH indicator here is that these models are all maxed out in energy: L-Wave, Empirical, Long Term and Internal Volatility. Other models are totally empty of energy: Direction Change, Trading Cycle and Panic Cycle.
In other words, whatever direction it decides to take now, it will be an ABSOLUTELY MASSIVE one-way move into March 😮🔥🚒
Let's dig further.
WEEKLY: I strongly suspect that MSTR has already decided that the move will be UP THE ELEVATOR . As you can see on the chart, it crossed down 2 Daily and 3 Weekly REVERSALS and bounced off them immediately to close the Day, Week and Month ABOVE all 5. Furthermore, it didn't even reach the first MONTHLY REVERSAL at $120 . If that's not bullish enough, it did it during a complete total meltdown and capitulation of the crypto AND metals market. Very impressive.
The next two weeks are EXTREMELY STRONG TARGETS.
DAILY: you can see that Friday opened lower and it closed higher. Monday/Tuesday are strong targets and exceeding this immediate HIGH will point to a RALLY . Considering that I am betting that crypto and metals will begin recovering this weekend, by the time the MSTR market opens on early Monday morning I suspect momentum will be to the upside .
The following text is from my BTC ETH SOL forecasts that I just posted earlier.
BTC ETH SOL are currently crossing MASSIVE Daily, Weekly and Monthly RESISTANCE and a very strong bounce is almost GUARANTEED. So, you will have a much better chance at cutting your losses during February.
However, looking at the MONTHLY it appears that instead of making HIGHs in January, they made LOWs (obviously) and Socrates is now calling for an OPPOSITE DIRECTION INTO MARCH and, February no longer shows up as a TARGET.
I won't go into any more details because I really need to wait for the this day and month (today 31st) to finally see what Socrates has to say.
At least, I would not be surprised to see a somewhat of a recovery before end of the day today.
Good luck and stay safe! 🙏🏻

SOL ¡URGENT UPDATE! Do Not Sell This CrashHello! Please give this idea a boost and follow me here on TW for my regular critical updates on crypto (BTC, ETH, SOL, MSTR) and metals (GLD, SL, PL) based on Martin Armstrong's Socrates.
Well! what an awful crypto breakdown along with everything else 😢 I guess I'm just thankful that I did not get liquidated 😮
Look in my TW Ideas for posts of each market individually.
First off ¡¡¡DO NOT SELL THIS CURRENT CRASH!!!
BTC ETH SOL are currently crossing MASSIVE Daily, Weekly and Monthly RESISTANCE and a very strong bounce is almost GUARANTEED . So, you will have a much better chance at cutting your losses during February.
However, looking at the MONTHLY it appears that instead of making HIGHs in January, they made LOWs (obviously) and Socrates is now calling for an OPPOSITE DIRECTION INTO MARCH and, February no longer shows up as a TARGET.
I won't go into any more details because I really need to wait for the close of this day and month (today 31st) to finally see what Socrates has to say tomorrow.
At least, I would not be surprised to see a somewhat of a recovery before end of the day today.
I will post crypto again tomorrow Sunday. MSTR is also showing somewhat of a confirmation about what I just said above and I'm going to post MSTR individually in a few minutes.
Good luck and stay safe! 🙏🏻

ETH ¡URGENT UPDATE! Do Not Sell This CrashHello! Please give this idea a boost and follow me here on TW for my regular critical updates on crypto (BTC, ETH, SOL, MSTR) and metals (GLD, SL, PL) based on Martin Armstrong's Socrates.
Well! what an awful crypto breakdown along with everything else 😢 I guess I'm just thankful that I did not get liquidated 😮
Look in my TW Ideas for posts of each market individually.
First off ¡¡¡DO NOT SELL THIS CURRENT CRASH!!!
BTC ETH SOL are currently crossing MASSIVE Daily, Weekly and Monthly RESISTANCE and a very strong bounce is almost GUARANTEED . So, you will have a much better chance at cutting your losses during February.
However, looking at the MONTHLY it appears that instead of making HIGHs in January, they made LOWs (obviously) and Socrates is now calling for an OPPOSITE DIRECTION INTO MARCH and, February no longer shows up as a TARGET.
I won't go into any more details because I really need to wait for the close of this day and month (today 31st) to finally see what Socrates has to say tomorrow.
At least, I would not be surprised to see a somewhat of a recovery before end of the day today.
I will post crypto again tomorrow Sunday. MSTR is also showing somewhat of a confirmation about what I just said above and I'm going to post MSTR individually in a few minutes.
Good luck and stay safe! 🙏🏻

BTC ¡URGENT UPDATE! Do Not Sell This CrashHello! Please give this idea a boost and follow me here on TW for my regular critical updates on crypto (BTC, ETH, SOL, MSTR) and metals (GLD, SL, PL) based on Martin Armstrong's Socrates.
Well! what an awful crypto breakdown along with everything else 😢 I guess I'm just thankful that I did not get liquidated 😮
Look in my TW Ideas for posts of each market individually.
First off ¡¡¡DO NOT SELL THIS CURRENT CRASH!!!
BTC ETH SOL are currently crossing MASSIVE Daily, Weekly and Monthly RESISTANCE and a very strong bounce is almost GUARANTEED . So, you will have a much better chance at cutting your losses during February.
However, looking at the MONTHLY it appears that instead of making HIGHs in January, they made LOWs (obviously) and Socrates is now calling for an OPPOSITE DIRECTION INTO MARCH and, February no longer shows up as a TARGET.
I won't go into any more details because I really need to wait for the close of this day and month (today 31st) to finally see what Socrates has to say tomorrow.
At least, I would not be surprised to see a somewhat of a recovery before end of the day today.
I will post crypto again tomorrow Sunday. MSTR is also showing somewhat of a confirmation about what I just said above and I'm going to post MSTR individually in a few minutes.
Good luck and stay safe! 🙏🏻

BTC ETH SOL MSTR Quick UpdateHello everyone, please give this idea a boost and follow me here on TW for my regular critical updates on Bitcoin, Ethereum, Solana, MicroStrategy, Gold & Silver, based off Martin Armstrong's Socrates.
The main difference in today's crash between crypto and metals is that today crypto had a target for a LOW and metals for a HIGH and you can see that crypto is crossing red reversals, implying that they should get a strong bounce tomorrow HOWEVER, tomorrow could be a HIGH so, if you got caught holding LONGs, you should close them tomorrow because metals are not done just yet so, the crypto pump seems to have failed yesterday as I posted and it could go lower into next week possibly.
BTC vs Gold vs Silver Please Give Me Your Thoughts On This
Good luck! and stay safe 🙏🏻

BTC vs Gold vs Silver Please Give Me Your Thoughts On ThisHello everyone, please give this idea a boost and follow me here on TW for my regular critical updates on Bitcoin, Ethereum, Solana, MicroStrategy, Gold & Silver, based off Martin Armstrong's Socrates.
Taking the time to dissect and write these analyses for the public helps me and forces me to fully understand what it is that I am trying to explain. It helps me with my trading decisions and it holds me accountable with a registry of my ideas that I always go back to check for accuracy.
The double curve drawings on the charts are real Socrates Weekly Timing Array Target Dates.
Back in December I posted an idea of my BTC Bitcoin 2026 Bear Market Outlook I am starting to suspect that it might NOT play out. I genuinely think that forecasts that say "it could go up or down" are really useless for anything. So, I'm not giving two scenarios here. I actually suspect that Crypto will rip much higher and catch everyone off-guard BECAUSE now that I just started trading Gold/Silver and have access to all the Pro-level Timing Arrays I just simply don't understand HOW or WHY the Crypto market AND Gold/Silver would all collapse/dump in February because February is a TARGET for a TURNING POINT in these markets and these markets have made HIGHs in January so... one of these markets will, or should, make a CYCLE INVERSION, which means that February won't produce an opposite direction but a CONTINUATION.
Furthermore, reading the text generated by Socrates it gives a specific price target that if crossed then it will continue moving higher (CYCLE INVERSION) and this is only the case for BTC@$97891 ETH@$3915 SOL@$148. Gold/Silver, apparently, just simply don't have a chance to continue ripping higher through February into March.
Looking at the Weekly Timing Arrays for BTC there is a PANIC CYCLE the week of February 16th which suggests that after dumping hard early February it could snap right back up very quickly.
Silver has a PANIC CYCLE for February which suggests that it could drop back down to $72 during February alone.
Looking at these 3 charts, which do you think have the most potential to rip higher? obviously Bitcoin, which has been making higher lows and highs, it looks like consolidation, not a Bear Flag.
Finally, looking at the astrological transit reports for Bitcoin, early February looks ugly but then after that it might actually play out just fine! and then March seems to be ok as well.
Good luck! and stay safe 🙏🏻

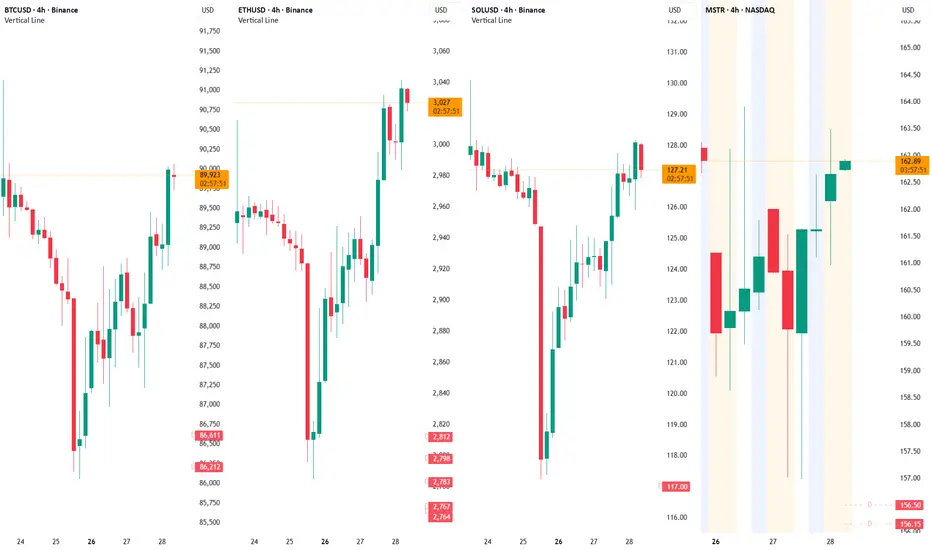
BTC ETH SOL MSRT ¡WARNING! This Could The Be The High For NowHello everyone, please give this idea a boost and follow me here on TW for my regular critical updates on Bitcoin, Ethereum, Solana, MicroStrategy, Gold & Silver based off Martin Armstrong's Socrates.
It's possible that yesterday was the closing HIGH and today the intraday high with a pullback into Thursday/Friday unless it closes above BTC@$91255 ETH@3157 SOL@132 MSTR@162 but Socrates is warning that there is no much momentum left for this pump.
Good luck! and stay safe 🙏🏻
Coinranger|BTCUSDT. Potential reversal to 90930🔹Fed rates at 22:00 UTC+ 3, FOMC press conference at 22:30 UTC+ 3. We can fly on this news.
🔹US earnings season is in full swing.
🔥BTC
🔹Still holding towards 89840:
1️⃣ The main upper level has been clarified at 89840. Above that are 90930 and 92930, but these are just worth keeping in mind for now. This is a complete set of upside waves.
2️⃣ Below, the important 88,500 level is actual and 85,000 and 84,700 lower are still relevant.
Until the rate issue, bitcoin may be trading in a micro-flat of 89,840 - 88,500. There's a chance afterward of a move higher to 90,930.
---------------
Share your thoughts in the comments!
