Bitcoin topped versus Gold 11 months ago.On the bright side the cyclical bear market of #BTC vs #GC is actually closer to the end, rather than just starting.
Bitcoin has already lost tremendous value vs the Analog SOV
With previous cyclical Bears lasting maximum 14 months.
Which by that time I believe one if not both of these targets will be met.
The troubling aspect is.
If BTC achieves target 2 --- then once could argue a Double top has formed.
And any subsequent bounce/recovery rally should be treated with suspicion.
And furthers declines and retest of this target 2, could open up the trapdoor for a SECULAR Bear market taking us into 2027 before any meaningful recovery can begin.
This is a merely observation of what has happened and what is currently unfolding with early (pre-coinbase launching) BTC investors unloading supply most of 2025 into their perceived six figure objective.
$100K was always the dream!
Will they buy back next bear?
I suspect only if it becomes cheap enough.
What is cheap for an OG?
Btcgold

BTC/GOLD Comparison instead of USDIs it possible that bitcoin already bottomed if you compare it to Gold instead of the Dollar? Is the 4 year USD cycle broken? Did BTC bottom to gold because of the Gold run? Will the cycle play out exactly the same it did in the past or did something change due to the end of the 18.6 real estate cycle + no Bitcoin dominance break down during current cycle (Altseason).
Many questions no answers. Not yet. Anyhow buying crypto atm at current stage is wise due to most of them are extremely oversold, if that lead to any bigger rallies i let me unsaid. But up from here before down is my belief. Just very interesting to compare Bitcoin to other currencies, especially to Gold due to Bitcoin is supposed to be the digital version of Gold.
If bitcoin track earlier cycles then it should bottom now, or in October if compared to USD. Anyhow the current bull market is not broken until the 50% level is broken in USD value, which is 69k.
/WealthNode

BTC/GOLD will bottom hereJust a couple more months of chop and pain for crypto before the up-only resumes again
This happened back in May 2021

Bitcoin Moment of Truth- This simple chart compares Bitcoin to gold, not to dollars. ( Remove the dollar = Compare real value ).
- Remember? Resistance often turns into support. Support often turns into resistance.
- A long time ago, when BTC reached this same level against gold, it failed and stayed weak for years. Today, BTC is back at the exact same line.
- This is a make it or break it zone: If Bitcoin stays above this level, it proves it’s stronger than Gold. If BTC falls below it, gold wins and BTC struggles again.
- No magic, no prediction. Bitcoin either holds the line…or loses the fight.
- Boomers vs Gen Z
Happy Tr4Ding !

Gold Vs Bitcoin- I don’t publish much these days and right now, it’s very difficult to analyze Bitcoin in isolation.
- The market is currently heavily focused on metals, and retail investors usually rush into whatever is already pumping, which is precisely what you want to avoid.
- This chart is not a prediction, but it can help identify good entry zones to accumulate more BTC. What we need is confirmation. Gold has formed a double top breakout and moved above $5,000. From here, regardless of whether gold continues higher, the key is to wait for a bearish divergence and then rotate.
- When Bitcoin begins its next leg up, Gold.D should start to roll over. Until then, and until clear signals appear, the safest approach is to stay on the sidelines.
Sometimes, the best trade is not to trade at all, just wait patiently for the right opportunity.
Happy Tr4Ding !

BITCOIN / GOLD ratio's mind-blowing revelation.Bitcoin (BTCUSD) remains under heavy pressure since its October 2025 All Time High (ATH) but the BTC/GOLD ratio reveals that the real selling pressure in terms of the precious yellow metal has been boiling up for some time before that date.
In fact the ratio's last High was in August 2025, which technically was a Lower High as the true Top for BTC/GOLD's Cycle was in December 2024. Mind-blowing revelation indeed and that undoubtedly draws similarities with the previous Cycle, which also had a Double Top in 2021.
The key indicator here is the 1M RSI of the ratio. It has a Lower Lows trend-line, which has priced all Cycle bottoms since 2015. More recently (since January 2019) there is a diverging Lower Lows trend-line (dashed) also. The tight zone within those two trend-lines may be holding the key for this Cycle's bottom.
This shows that the bottom may be closer than we may expect but the last Bear Cycle showed a slowing down behavior once it approached the RSI Lower Lows and turned sideways before it finally made contact with it 6 months later. For the real BTC/GOLD price action though, the downtrend didn't slow down as much, first breaking violently below the 1M MA50 (blue trend-line) and finding bottom 6 months later as mentioned just above the 1M MA100 (green trend-line).
If we have a decreasing rate on the MA bottoms, we can expect the current Cycle to bottom below the 1M MA100 this time, closer to the 1M MA150 (red trend-line).
So closer than it looks or not in terms of bottom, the Bear Cycle is entering its 2nd and final Phase.
So what do you think about the BTC/GOLD approach? Feel free to let us know in the comments section below!
---
** Please LIKE 👍, FOLLOW ✅, SHARE 🙌 and COMMENT ✍ if you enjoy this idea! Also share your ideas and charts in the comments section below! This is best way to keep it relevant, support us, keep the content here free and allow the idea to reach as many people as possible. **
---
💸💸💸💸💸💸
👇 👇 👇 👇 👇 👇

BTC GOLD ratio: Hidden Predictor hints of BIG SHIFT favors BTC!
BTC GOLD ratio: Hidden Predictor hints of BIG SHIFT favors BTC!
BTC GOLD ratio has always been the less accessed data for the general public because of its indirectness nature of the individual assets as far as price action goes.
Most will opt to disect the main asset data/chart to see the face value of the moving price forgetting that another hidden confluence can bring forth an invaluable advantage.
But with its low key-ness comes a powerful predictor of the market direction. A data that conveys a forthcoming significant rebalance / shift on this two assets.
Based on our long term metrics, BTC GOLD ratio has been respecting its trend curvature since inception from 2013 -- proving that psychological key levels are respected regardless how expansive the data acquired on these timeframes.
Recent 2-year data that started from March 2023 to December 2024 conveyed BTC taking over GOLD in terms percentile momentum growth. From this time space, BTC has parabolically surged from 25k to 100k levels - an impressive X4 price growth. This type of golden milestone explicitly highlights the importance of this unpopular ratio in predicting whats about to transpire in the market in terms of sentiment.
Ratio cycles between contraction and expansion are usually within 1300-1400 day period. So an apparent structural change on this ratio is very special and its foretelling. When this ratio shifts big time it will do what it is bound to DO, no questions asked -- proceed on the intended directional target.
Just the same, using the same ratio from the last few seasons we have seen the shift favoring GOLD, reflecting the massive price expansion of this favored flight-to-safety asset. Rising generously to 4500 from 1800 levels. Meanwhile, BTC took a hefty trim, correcting back to 61.8 FIB levels from 126k back to 80k -- respecting the curve fit taps of the ratio. Healthy cycles that needed to materialized.
Fresh data from the past few weeks is hinting another BIG FLIP in the market, a massive shift in play. Ratio pre-hints of an impending rebalance of power, this time favoring BTC.
The mother coin is currently in prep work to take over the spotlight soon in terms of momentum growth in the next 1000 days.
The last BULL shift for BTC on this ratio was 1000 days ago, and based on recent data, another big one is about to transpire again -- a rare signal that can't missed.
Prepare for another season of NORTH journey for BTC in the next 1000 days, and it starts this month, January 2026. When the BIG SHIFT happens, get SEEDED, relax and enjoy the view -- you will be rewarded tremendously.
Spotted BTC price at 87k.
Long term target 200k or beyond (1000 days).
TAYOR. Trade mindfully.
Live Life more.

Bitcoin vs Gold : The Hidden Bullish TriggerIn this analysis I shared my thought on why I believe INDEX:BTCUSD bull market cycle haven't started yet, and why 2026 will be a bull market against the 4-year narrative of expected bear market.
Watch, Listen and share your thoughts below.
Cheers!

Bitcoin vs Gold: The Big Monthly Retest- Price is now back inside a huge support area that has mattered since 2021.
- In the past, this zone often marked bottoms where Bitcoin stopped losing vs gold and sometimes started a new run up.
- Recent move down = gold stronger than BTC lately.
- The idea on the chart:
- Some sideways “ping‑pong” inside the box ⚾
- Then a possible break higher if buyers defend this zone.
- Trading view of this level:
- Monthly support = slow and noisy , with fake breaks and long wicks.
- If entering here, think small size clear invalidation below the box, and patience.
- A series of higher lows and a break above the short range would be the first hint that BTC is ready to outperform gold again. 🚀

BTC vs GOLD: Falling Channel Bounce Setup1. What we’re looking at
Price is inside a downward channel.
We just tapped a big support zone (grey box) that also lines up with the lower channel line => strong confluence.
2. Trade idea 🧠
Look for bullish reaction in the grey box (wicks, strong green candles, RSI/volume confirmation).
First logical target: mid‑channel area.
Extended target: upper channel line.
3. Risk management ⚠️
Invalid if weekly closes clean below the grey box and the lower trendline => structure broken.
No breakout yet, so treat it as a counter‑move inside a downtrend, not a guaranteed trend change.
BTC is cheap vs Gold at this multi‑touch support. If this level holds, I expect a bounce toward the middle and then the top of the falling channel. If we lose the box, the idea is invalid and I’m out. What do you think, is BTC ready to outperform gold again from here?

Relative analysis of Bitcoin vs. Gold and Total CryptoOn the BINANCE:BTCUSDT / TVC:GOLD ratio chart, price attempted to re-enter the primary channel after the initial breakout, aiming to push back toward the channel’s upper boundary. However, despite (105) days of upward attempts, the ratio consistently struggled with the dynamic resistance area.
After the breakdown, price extended toward the lower boundary of the extended channel, where it showed a strong and precise reaction.
From here, the structure suggests a potential bullish corrective move toward the resistance zone, supported by:
bullish divergence between price and MACD,
clear weekly rejection candles,
and price interaction at the channel’s lower boundary.
This scenario is further reinforced by the Crypto Market Cap (excluding Bitcoin) CRYPTOCAP:TOTAL2 vs. Gold TVC:GOLD ratio. This chart has also reached the bottom of its (180-week) channel, formed a weekly bullish divergence, and has now returned back inside the channel.
As shown on the chart, the TOTAL crypto channel exhibits cleaner and more consistent reactions compared to the Bitcoin channel.
If our key level is broken, the bullish scenario becomes invalid, and price is likely to move toward the support zones. This analysis will be updated accordingly.
BINANCE:BTCUSDT
TVC:GOLD
CRYPTOCAP:TOTAL2

Bitcoin Breakout: Key Supply Zone Test & Next Targets BTCUSD – Strong Bullish Breakout from Rising Channel | Key Levels Ahead
Price has broken out strongly from the rising channel after building support near the 86,600 zone. This breakout shows buyer strength and momentum shifting back to the upside.
Currently, BTC is testing an important supply zone around 90,500 – 91,500. A clean breakout and retest of this zone can open the door for a bullish continuation toward the next major resistance near 93,500 – 94,000.
However, if price fails to hold above the breakout level, a pullback toward 88,500 or even deeper into the 86,600 demand zone is possible before the next leg up.
Key Technical Highlights
Rising channel breakout with strong bullish momentum
Price retesting major supply zone
Clear upside target: 93,500 – 94,000
Downside support: 88,500 and 86,600
Clean structure for both breakout & pullback scenarios
📈 My Bias
Bullish as long as price stays above 88,500.
A breakout above 91,500 will confirm continuation

BTC to Gold Cracking Lower! CAUTION!This could end up turning into a significant crack! for BTC relative to Gold. We have a fight on our hands between Speculation (BTC) and a Safe asset (Gold)
For over 4 years, speculation has not been able to outperform safety, and it is now starting to break lower.
CAUTION! is in order!
Click boost, follow, for more authentic, no BS, raw analysis. Let's get to 5,000 followers. ))

If $GOLD is at its peak, is $BTC next?Gold has been rejected at the 0.618 level of the Fibonacci channel on the 3M chart.
The Stoch RSI demonstrates a striking similarity to past cycles:
The bullish structure, which continued in the overbought region in October 2010, peaked 273 days later in July 2011.
Momentum, which continued in the overbought region again in October 2019, reached its peak 365 days later in October 2020.
Today, history paints a similar picture once again.
The bullish structure, which began in the overbought region in October 2024, may have reached its peak approximately one year later, in October 2025, just as in previous cycles.
Gold appears to be completing its historical rhythm once again.
Note: The Bitcoin / Gold pair is developing in the opposite direction.

$BTC / $GOLDThe Golden age will fade in the shadow of Bitcoin
The Bitcoin/Gold pair maintains its major uptrend, with the price trapped between the 2021 ATH resistance and the uptrend.
As it does before every strong run, it's holding above the demand zone.
Once the 2021 ATH resistance (supply zone) is broken, Bitcoin will continue to change not only the pair's price against gold but also its perceptions.
Be prepared… a face melting move is coming soon.

$BTC / $GOLDCRYPTOCAP:BTC / TVC:GOLD 🔃
2013 | 1 Btc = 1 Gold
2017 | 1 Btc = 16 Gold
2021 | 1 Btc = 37 Gold
2025 | 1 Btc = 31 Gold \ More is coming
In December 2024, 1 Bitcoin was worth 41 gold, but there was no monthly close above the 2021 ATH level.

Is Bitcoin about to outperform Gold ? The potential Does exist
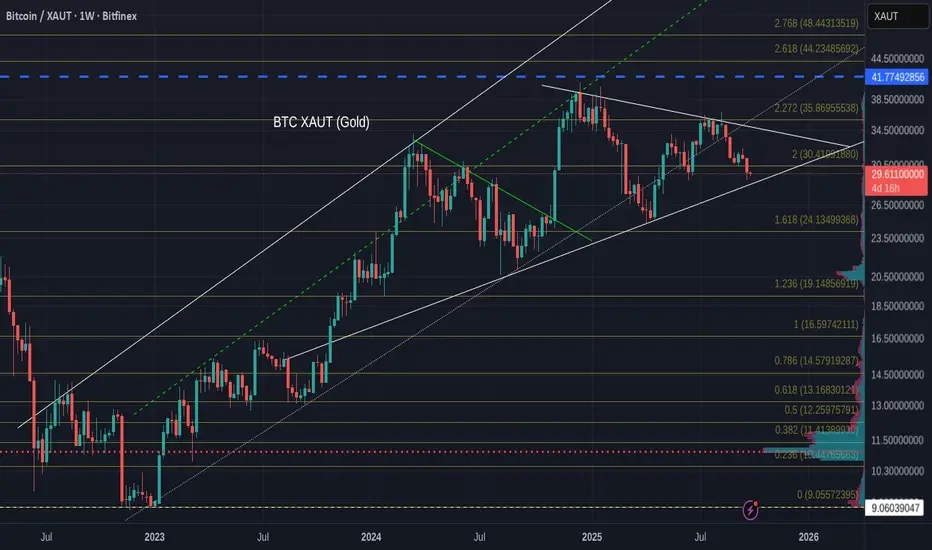
As we can see on this weekly Bitcoin XAUT Gold chart, BTC Ranges, pushes, ranges, pushes.
And the BTC PA is now on the line of support ir has strongly bounced off previously.
PA is also beginning to get Squeezed in the Pennant. The Apex is next year but I expect PA to break out of this this year.
It will be interesting to see what happens here this month and I do have Hopes that BTC will begin to outperform gold, certainly while PA pushes up off support and heads towards the upper trend line.
This idea is backed up with the weekly GOLD Chart below.
As we can see, Gold is up on the upper trendline and has hit the 2.768 Fib extension, Both of which are likely to be resistance.
We can also see how Oversold the Gold Weekly MACD is
There is a Strong likelihood that Gold will need to cool off, though we need to understand that MACRO events do control this, so a Drop is not guaranteed.
But I will be watching this CLOSE as The BTCXAUT pair is a much better Pair to watch than the BTCUSD.
Yjr reason being, while the $ looses Value, gains in the BTCUSD pair are Not as good as it may appear. Because you may gain in the number of $ you can get but each $ is worth less.
GOLD meanwhile, is rising in Value or not loosing as much when it ranges. Itis a STORE of Value and is internationally recognised and is politcay neutral.
BTC to go parabolic to 100 oz Gold by EOY 2025!Gold and Bitcoin are both valuable hard assets and from my observation, the Bitcoin chart to Gold is much better predictable than it's price to USD. The reason might be because Gold holds it's purchasing power over time through the history, and in fact it is the base line for the purchasing power, but Dollar depends on how much it gets printed and cannot be reliably predicted. That's why when you look at BTC/Gold chart, most of the times you see exact double tops or exact double bottoms.
I was predicting BTC would get to $100K USD when it hits it's previous top to Gold (37 oz) and so I was predicting about 8 month before it happens that BTC will be $100K when Gold is 2650 and it happened. I was surprised myself that it held true.
Looking into Gold price history, we can reliably say that Gold will not stop here and will march to $8000 within couple of years. However I think it has hit it's top for the year, or max $4000 will be the 2025 top. Then when Gold pulls back, BTC will get the chance to go parabolic, and has it's last rise of this bull market, and I expect it should take BTC to near 100 oz Gold. So if we want to put all together, Gold = 3350 where it pulls back and BTC= 100 oz = $335,000. I know the Bitcoin whales are playful sometimes, so we might get into $333,333 per BTC.
I remember in Nov 2013 everyone was talking about bitcoin flipping gold (1 BTC getting to 1 oz Gold) and well, it didn't happen at that time and it had to come back in 2017, but it got close enough. We might have the same kind of situation here so starting to drop anywhere from $270k to $330k might be what we get.
I don't publish many analysis's on TV, but I thought I'd put this here, it might get me famous ;)

BTC to go Parabolic to $333K, ~100 oz Gold by EOY 2025 Gold and Bitcoin are both valuable hard assets and from my observation, the Bitcoin chart to Gold is much better predictable than it's price to USD. The reason might be because Gold holds it's purchasing power over time through the history, and in fact it is the base line for the purchasing power, but Dollar depends on how much it gets printed and cannot be reliably predicted. That's why when you look at BTC/Gold chart, most of the times you see exact double tops or exact double bottoms.
I was predicting BTC would get to $100K USD when it hits it's previous top to Gold (37 oz) and so I was predicting about 8 month before it happens that BTC will be $100K when Gold is 2650 and it happened. I was surprised myself that it held true.
Looking into Gold price history, we can reliably say that Gold will not stop here and will march to $8000 within couple of years. However I think it has hit it's top for the year, or max $4000 will be the 2025 top. Then when Gold pulls back, BTC will get the chance to go parabolic, and has it's last rise of this bull market, and I expect it should take BTC to near 100 oz Gold. So if we want to put all together, Gold = 3350 where it pulls back and BTC= 100 oz = $335,000. I know the Bitcoin whales are playful sometimes, so we might get into $333,333 per BTC.
I remember in Nov 2013 everyone was talking about bitcoin flipping gold (1 BTC getting to 1 oz Gold) and well, it didn't happen at that time and it had to come back in 2017, but it got close enough. We might have the same kind of situation here so starting to drop anywhere from $270k to $330k might be what we get.
I don't publish many analysis's on TV, but I thought I'd put this here, it might get me famous ;)

HUGE Cup & Handle On BTC/GOLDAre we in the same situation as in 2017? At that time, BTC followed with a 500% rally. Do you think history is repeating itself?
If we use the same percentages, we'll have a BTC/GOLD rally of 600%. This would mean that BTC could make 250%.

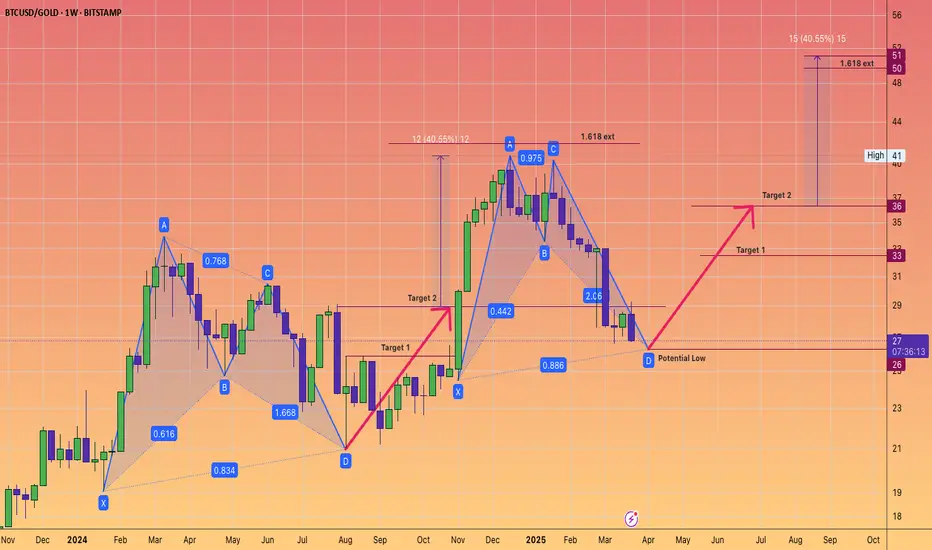
Bitcoin harmonic pattern. Back to back Gartley. BTCGOLD ratio.The BTC/GOLD ratio has experienced a significant correction, currently standing at 27 gold ounces per 1 Bitcoin, down from a peak of 41, representing a decline of 34%.
Gold, priced at $3,114 in US Federal Reserve notes, is in a sustained bull market.
It is reasonable to anticipate that the digital equivalent of gold will gain traction once gold stabilizes at a higher price point.
The Gartley pattern is recognized as the most prevalent harmonic chart pattern.
Harmonic patterns are based on the idea that Fibonacci sequences can be utilized to create geometric formations, which include price breakouts and retracements.
The Gartley pattern illustrated indicates an upward movement from point X to point A, followed by a price reversal at point A. According to Fibonacci ratios, the retracement from point X to point B is expected to be 61.8%.
At point B, the price reverses again towards point C, which should reflect a retracement of either 38.2% or 88.6% from point A.
From point C, the price then reverses to point D. At point D, the pattern is considered complete, generating buy signals with an upside target that aligns with points C and A, as well as a final price target of a 161.8% increase from point A.
Often, point 0 serves as a stop-loss level for the entire trade. While these Fibonacci levels do not have to be precise, greater proximity enhances the reliability of the pattern.
Will these consecutive Gartley patterns succeed in bolstering Bitcoin's strength? We will soon discover the answer.
Bitcoin will overperform Gold in lower time frame?When i looked into BTC/GOLD chart (BTCXAU), i saw 2 things. The gap has been filled and BTC bounced against GOLD over the trend line support. If this is a retest of bullish continuation, then things will be positive for BTC price. Losing this support zone of 30 - 31 is the invalidation.

Later, Bitcoin!Bitcoin remains in a long-term bullish trend, but it currently appears significantly overvalued relative to gold. The recent breakout, followed by a re-test of the upsloping wedge formation, suggests that bullish momentum may be waning. This could indicate that capital is beginning to rotate out of Bitcoin. As a result, it may be more prudent to revisit the market in one to two years ahead. This shift may also mark the beginning of a potential altcoin season.
