$SUSDT Breakout Alert: Bullish Reversal in Play.$S just broke out of a long falling wedge, signalling a possible bullish reversal.
MACD is turning positive, adding momentum to the move.
If price holds above the breakout zone, it could rally toward $0.8808, nearly 195% higher than current levels.
DYOR, NFA
Btctechnicalanalysis

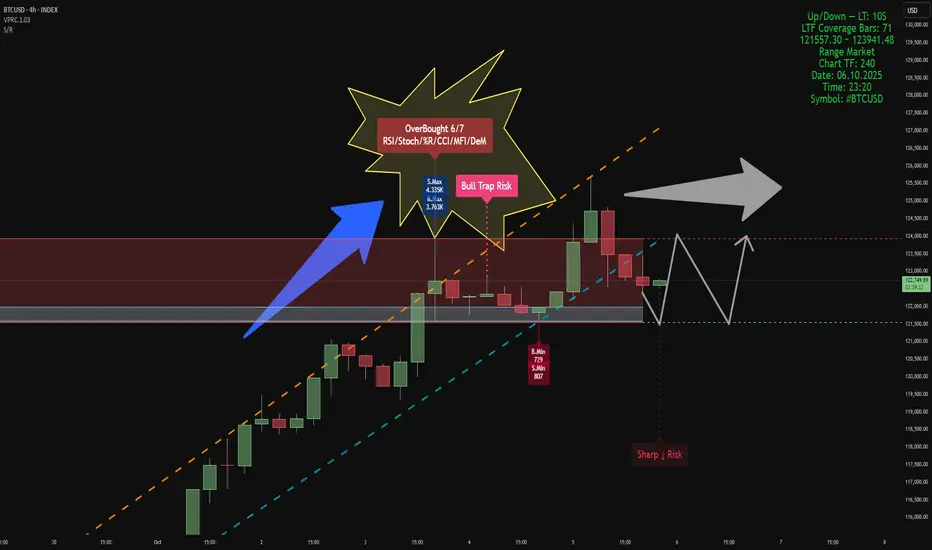
BTCUSD – 4H Volume-Structure Analysis
Indicators
Smart Money Support/Resistance (Lite) & ATAI Volume Analysis with Price Action V1.03
Analytical Setup
• LTF: 10 seconds
• LTF Coverage Bars: 70
• Global Volume Period: 52
• Market Type: Range
• Active Zones:
- Support Zone: 121,557 – 123,941 USD (current active range shown in panel)
The analysis timeframe ensures valid volume coverage, as the period (52) is smaller than total LTF bars (70).
Resistance Area & Bull Trap Risk
In the upper range (≈123,900 USD), a Bull Trap Risk has formed immediately after an OverBought 6/7 condition — confirmed by RSI, Stoch, %R, CCI, MFI, and DeM modules in ATAI. At this point, both buy and sell volumes peaked within the 52-bar window, with S.Max = 4.33K and B.Max = 3.76K. This slight dominance by sellers indicates demand absorption at the top of the structure. The setup matches ATAI’s trap logic — high wick, overbought context, and volume imbalance — signaling potential exhaustion near resistance.
Support Area
Support is currently anchored near 121,550 USD, derived from B.Min and S.Min lows (B.Min = 7.29, S.Min = 807). This aligns with the lower projection from Smart Money S/R, marking the point where cumulative delta begins to compress. Historically, compression at minimum-volume zones often precedes short-term accumulation or range stabilization.
Structural Behavior
The chart shows a defined upward channel (orange and cyan dashed lines). After testing the upper boundary, price entered the resistance zone and generated a Bull Trap Risk followed by moderate rejection. Below, the Sharp ↓ Risk tag signals potential for a short liquidity sweep before stabilization. Volume readings still support range continuation rather than a confirmed reversal, consistent with the Range Market tag.
Probable Scenario
1. A short pullback toward the lower boundary of support (~121.5K) is expected.
2. If support holds and volume compression persists, a rebound toward 123.9K (resistance ceiling) is probable.
3. A breakdown below 121.5K could trigger a deeper correction toward the next S/R projection near 120K.
This represents a neutral-to-bullish range bias: short-term weakness, but constructive above support.
Summary
• OverBought 6/7 + Bull Trap Risk detected at resistance (≈123.9K).
• Support around 121.5K built from B.Min and S.Min.
• Sellers slightly dominant at the trap peak.
• Likely scenario: retest of support, then rebound toward resistance if volume confirms.
• Bias: range continuation until breakout beyond 123.9K or breakdown below 121.5K.
Bitcoin (BTC/USD)Bitcoin just broke a new all-time high 🚀
As shown in my pinned analysis, I marked the $111K level and mentioned that investors could also look for entries around $109K.
Today, you can see how that plan played out ✅
I’m not a fortune teller,
I don’t know what the whales are planning,
I don’t memorize Glassnode data —
My only tool is the chart 📊
I’m a swing trader —
Calm, stress-free, and patient.
Hope this analysis helped you too.
🎯 Stay profitable and trade safe.

ANFIBO | BTCUSD – Weekly Trading Plan [10.6 - 10.12.2025]Anfibo's here!
BTCUSD – Detailed Market Analysis & Outlook
It was great to see BITSTAMP:BTCUSD react strongly as I predicted last week, and I was absolutely right, BTC rallied from the $109,000 support to over $125,000 and set a new ATH. This strong move generated a profit of around $16,000 per BTC, reflecting the strength of the current bull cycle and the resilience of market demand. My family will definitely have a wonderful vacation thanks to that plan.
Market Outlook for the Week
Looking ahead, I anticipate the market may lean toward a period of healthy correction. Specifically, BTC could extend toward the $128,000 – $130,000 region before retracing to the nearest support zone between $118,000 and $116,000. Such a pullback would be constructive, allowing the market to reset before establishing a clearer direction or consolidating in a sideways range while awaiting new catalysts or macroeconomic developments.
Technical Perspective
On the H4 timeframe, BTC remains firmly within its ascending price channel, with no immediate signs of trend reversal. Momentum continues to favor the bulls, and as long as BTC maintains structure above key supports, the broader uptrend remains intact.
>>> SELL ZONE:
ENTRY: 128 - 130 (X1000)
SL: 132
TP: 118 - 116
>>> BUY ZONE:
(1) ENTRY: 117 - 118 (x1000)
SL: 115.8
TP: 123 - 128 - ATH
(2) ENRTY: 112.5 - 114 (x1000)
SL: 111
TP: 118 - 123 - 128 - ATH
Conclusion
BTC has successfully confirmed strength from the $109k base, pushing into new highs. While short-term corrections toward $118k–$116k would be considered healthy, the overall technical framework continues to support the bullish trajectory. Traders and investors alike should monitor key levels closely, maintaining flexibility while aligning with the prevailing trend.
WISH EVERYONE A PROFITABLE NEW WEEK!

Bitcoin Btc usdt daily analysis
Time frame daily
Btc reached my target
It reached new high price last night about 125.000 $
I think btc will play in yellow box that you can watch in the chart and let other assets to grow up
Alt party has started

#BITCOIN ANALYSIS For the last 40 days I’ve been telling you #BITCOIN ANALYSIS
For the last 40 days I’ve been telling you guys I’m bearish on $BTC. We already dropped almost 8K twice, but every time Bitcoin reclaimed the levels again. Right now it’s trading around 18K to 119k but nothing has changed for me. I’m still bearish.
I’ve said many times that the 115K to 124K region is a short zone, not a long zone. If you’re still holding longs, I’d strongly suggest you flip to shorts because the chart is flashing multiple top signals.
Don’t get trapped by hype like “Bitcoin to 1 million by the end of this year.” That’s just noise. The structure is weak, liquidity is being engineered, and the bigger downside move is still ahead.
📌 Downside Targets:
105K → 100K → 95K → 90K

btcusdtI think Bitcoin is making a fake move and will fall from here, and it's not bullish at all. What do you think? Will it go up?

ANFIBO | BTCUSD will go to 109,000 USD?Hi guys, Anfibo's here ! This is my BITSTAMP:BTCUSD – In-Depth Analysis & Trading Plan
In the most recent session, BTC showed a positive reaction at the $111,000 support level, bouncing back above $112,000. This indicates that short-term buying pressure remains present around this key zone. However, on the H4 timeframe, I believe BTC is likely to form a double bottom pattern around the $109,000 region – which is precisely where I am waiting for a strategic buy entry with a favorable risk-to-reward setup.
Here's My Trading Plan:
>>> BUY ZONES:
- ENTRY: 108,000 - 110,000
- SL: below 107,000 (depending on risk appetite)
- TP1: 117,500
- TP2: 122,000
- TP3: 128,000
Key Resistance Levels Before Reaching TP
For BTC to achieve the targets, it must first clear several intermediate resistance levels:
$117,500
$119,000
$122,000
These will serve as critical checkpoints, as price reactions here will determine whether the recovery trend can sustain momentum.
Important Support Zones to Watch
In the event of further weakness, the following support levels will be crucial:
$109,500
$105,000
$101,000
Notably, $101,000 is a decisive level on the higher timeframe. Should this support break convincingly, we must prepare for a major trend reversal scenario, potentially opening the door to a deeper decline.
Conclusion, Personal Outlook
BTC is currently moving within a key support area and is showing signs of forming a short-term bottom. My primary strategy is to buy around $109,000, aiming for a recovery toward the $120,000 – $125,000 range, while maintaining strict risk management in case the $101,000 level is broken.
In this environment, short-term traders can take advantage of corrective rallies, while long-term investors should remain patient and monitor the 101k zone closely – as it represents a potential “line in the sand” that could redefine the next major cycle.
WISH ALL YOU THE BEST, MY FRIENDS!

Don’t Blink! BTC Signal Turns Bearish# BTC Quant Signals Stock 1M Prediction — 2025-09-28
CRYPTOCAP:BTC Quant Signals Kline Signal
📊 **CURRENT MARKET STATUS**
* Current Price: **$48.71**
* Data Quality: **Good**
* Timeframe: **1-Minute Bars (Scalping)**
---
🎯 **SCALPING PRICE PREDICTIONS**
* 30-Minute Target: **$48.32 (-0.81%)**
* 2-Hour Target: **$48.39 (-0.66%)**
* End-of-Day Target: **$48.49 (-0.45%)**
📌 Extended Outlook
* Final Target: **$48.39 (-0.66%)**
* Predicted Volatility: **21.8%**
* Expected Range: **$48.30 – $48.83**
---
📈 **SCALPING TREND ANALYSIS**
* Direction: **BEARISH**
* Confidence: **64%**
* Support: **$48.30**
* Resistance: **$48.83**
* Range Size: **1.1% of current price**
---
💰 **INTRADAY TRADE RECOMMENDATION**
* Direction: **SHORT**
* Entry Price: **$48.71**
* Target: **$48.45**
* Stop Loss: **$49.44**
* Confidence: **64%**
* Risk/Reward: **0.35 : 1**
* Session: **Intraday (1m bars)**
* Trend: **BEARISH**
#BTC #Crypto #Scalping #QuantSignals #TradingView

Is Btc STILL following this Eth Fractal? On Sept 9th I suggested Btc was following this Eth Fractal.
On Sept 12th I expressed concern for a lower low, and Btc seems to be heading lower now.
If Btc (on the 1 Day) is following this Eth (4 hr) fractal, then Btc may soon see a lower low (below 107). Alts may bleed harder.
I hope I'm wrong. But I am cautious for several reason, as also indicated in my other previously published charts.

BTC Possible Scenarios for the WeekPossible Scenarios for the Week
Bullish scenario: BTC holds support at $110,000, breaks through $120,000, and heads toward $125,000-$130,000.
Sideways/consolidation: Movement between $110,000 and $120,000 without a clear direction.
Bearish scenario: Break below $110,000 — test of $105,000 and below.
Risks and factors to monitor
Fed policy and rate announcements can significantly influence the trend (as a driver for the USD).
Trading volumes: Weak volumes during breakouts may be false.
US macroeconomics, inflation, geopolitics — increased tensions could trigger volatility.
Btc - Lower low incoming?Based on the "3 red week down rule" a lower low is expected (with high probability).
He's a simplified chart of what I am expecting in the short term.
May the trends be with you.

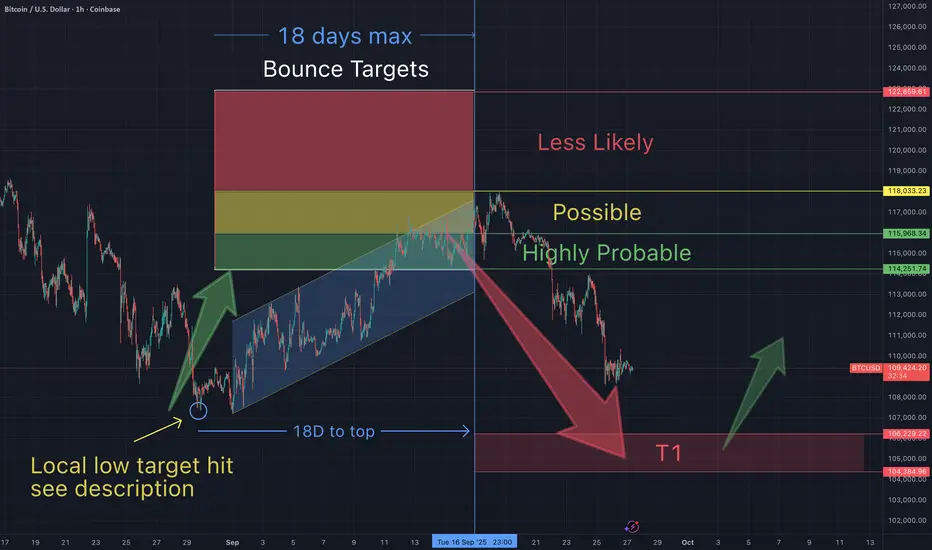
You will ask yourself, "how did he know Btc would do that"?On Aug 9th, I suggested Btc would bottom as low as 107,700, before a bounce.
On Sept 9th I suggested Btc had bottomed at my target, and would bounce to between $114K-118K (within 18 days)...the form a lower low. Day 19 began this current retrace.
Each of these predictions have come true with the exception of the lower low (below $107K). So congratulations to everyone who have been making gains based on my everything I have been charting.
The question remains, will the "3 red week down rule" and my statistical analysis of it's historical price action continue to play out? So far it looks that way. If so, there's another bounce incoming at my red T1.
PS I don't point out my accuracy to brag, but moreso I want to accomplish 2 things.
1-Prove that TA works - for all those non believers (and I encourage you to learn).
2-Keep track of my accuracy stats (and so should you...how else would we know who we should follow).
BTCUSDT H4 OUTLOOK Lets Goo
We Are Considering Buy Btcusdt Setup On Demand Zone
Liquidity Sweep
Demand Zone
High Probability Setup
Good Luck Guys

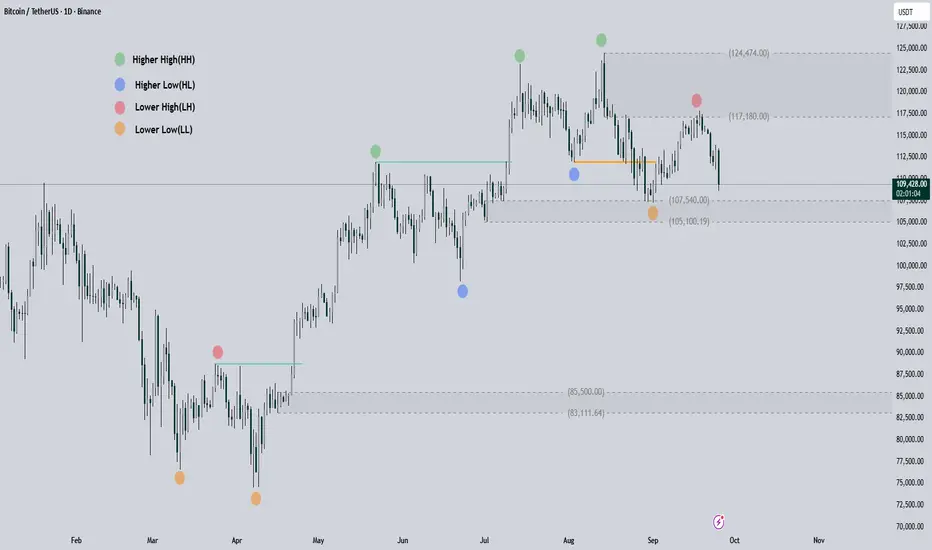
Bitcoin Price Analysis and PredictionIn my opinion, $124k was the highest price BINANCE:BTCUSD would see in this cycle, and the downtrend has started a long time ago.
The colored dots you see on the chart represent the main pivots of the weekly candles that were forming the bullish structure. Now we are seeing this structure being broken one after the other. You can see the key/legend for the colored dots on the chart.
Current Situation
Bitcoin broke the first weekly candle's Higher Low (HL) on August 22nd. Since then, we've seen a Lower Low (LL) and a Lower High (LH) on the weekly chart.
Now, the price is moving back towards that LL to break this LOW and form a new LL.
Last time, we saw good support at $107K and this area could be a support zone this time as well. However, the bearish structure has formed, and we will likely only face temporary reactions. In this area, we will either see the price range or a break of support and the start of a larger trend towards $85k.
Please note that this is just my opinion and it could be completely wrong. Even if it is correct, it might take a long time, or perhaps we'll move towards it with a sharp move!
Following BTC’s retracement and corrective phaseBTC underwent a sustained retracement yesterday, yet it failed to breach our downside support level at 111000. Subsequent price action formed a range-bound consolidation phase above this support zone. Consequently, we assess that following yesterday’s sharp pullback and corrective phase, BTC is now in a state of short-term oscillatory movement within the context of its broader uptrend.
Buy 112000 - 112500
TP 113000 - 113500 -114000
Daily-updated accurate signals are at your disposal. If you run into any problems while trading, these signals serve as a reliable reference—don’t hesitate to use them! I truly hope they bring you significant assistance

You will ask yourself, "how did he know Btc would do that"?On Sep 2nd I had suggested that Btc had bottomed at $107K, would then bounce up to 1 of my 3 targets, then retrace. This played out as anticipated. TA works!
On Sept 11th, I wrote "Caution: Btc may top within the next 5 days"
On day 6 (Sept 17th) Btc initiated a retrace and has broken it's higher highs, higher lows continuation pattern. The only question that remains, is Btc going to bounce from here ($112) or form a lower low (below $107K)?
I based this entire forecast on the "3 red weeks down rule". It is playing out too perfectly, which makes me a little concerned for a lower low for Btc (below $107K). Based on how the "3 week rule" applies to Btc, the historical data and statistical analysis suggests that the higher probability play is a lower low.
I hope I wrong, but I made the same call on my previous Xrp chart, and Xrp has already made it's lower low.
May the trends be with you.

$BTC Crucial range!BTC attempted to break above the lower resistance zone and the descending channel, but failed to sustain momentum. ⚠️
📉 If rejection continues from this level, we could see a move towards the lower side of the channel, where multiple support zones await around:
$114,700
$112,000
$110,400
This will be a key area to watch for potential bounce setups or further breakdown confirmation.
🔎 Stay cautious — until BTC reclaims and holds above $116,700–117,300, downside pressure remains in control.

BTC Bearish ScenarioPattern Recognition:
A Head and Shoulders (H&S) reversal structure formed on the daily chart. The 1:1 measured move target has already been achieved, confirming the pattern’s validity.
Confluence Zone:
That 1:1 target aligns closely with the 0.618 retracement of the previous down leg (124,610 → 107,211). This adds weight to the idea that the move is corrective in nature rather than a fresh bullish leg.
Market Structure:
Even though price rallied strongly, the bigger picture shows a lower low was created when the 112,017 support level was broken. This keeps the macro trend bearish until proven otherwise.
Bearish Scenario:
Price is currently respecting the rising trendline. A break below this trendline followed by a retest could trigger continuation to the downside. Potential supports to watch:
112,017 (previous broken support, could flip resistance).
110,681 / 109,363 (structural levels).
108,432 (major demand zone).
RSI:
Momentum has cooled off without reaching overbought levels, suggesting that upside pressure is weakening.

Btc is Bullish - it approaches an end of a historical timelineOn Sept 3rd I had suggested that Btc had bottomed and would bounce into one of my 3 targets. As anticipated Btc has now hit the top of target 2 (T2).
More importantly, I suggested Btc would bounce to these targets within 1-2 weeks ("18 days max"). Meaning based on a the patterns involving 3 red weeks down, Btc always sees the bounce end by day 18 or sooner...then retraces (often below the previous low -ie $117K).
Yet we are now at day 18 and Btc is not showing signs of a retracement. If Btc does not begin it's retrace today, then this is very bullish for Btc and the altcoin market. I am cautiously bullish as my bias has changed as a result of this new data. We must learn to pivot our trading strategies as price action unfolds. But being able to apply strategies to anticipate price action, helps us to know immediately when our trade ideas are being invalidated. It appears we possibly have an invalidation and I am shifting my approach accordingly.
Btc to the moon. Let's go!

Bitcoin Price Crosses $117,000 Post-Fed’s 35 bps Rate CutBitcoin is currently trading at $117,182, continuing its uptrend since the beginning of the month. The immediate challenge lies in flipping $117,261 into support, which would give the cryptocurrency the base it needs for further upside.
If successful, Bitcoin could target $120,000 as its next milestone. A breach and consolidation above that level could set the stage for further gains. This is likely, particularly if ETF inflows continue reinforcing investor confidence.
However, risks remain. Should selling pressure increase, Bitcoin may struggle to hold above key levels. A drop below $115,000 could open the door to a correction toward $112,500, invalidating the bullish thesis and cooling near-term momentum.

BTC Analysis — Long-Term Buy Zone AheadI'm watching $111,000 as a major buy zone on Bitcoin.
If price retraces to that level, I’ll be ready to enter a long position.
This is not a prediction — it’s a scenario.
Smart traders don’t guess, they prepare.
Let price come to your level. No chasing.
📍Set your alerts and stay patient.

You will ask yourself "how did he know Btc would do that"?On Aug 8th I suggested that based on my research of historical data, Btc would bottom as low as 107K. Btc bottomed at 107...and I then suggested a "bounce incoming".
On Sept 2nd I suggested that Btc had hit a bottom and was about to bounce into 1 of my three targets within 2 weeks. We are at the end of that 2 week period and T1 and T2 have been hit.
Question remains where do we go from here?
The 3 week down rule suggests that we form a lower low (below 107K). Will today's Fed meeting be the excuse for that pattern to play out?
What are your thoughts? I'd like to hear from you to gauge sentiment.
