BTC: Multi-Phase Correction Scenario₿ BITCOIN: Multi-Phase Correction Scenario - Liquidity Hunt to Major Pullback
Sharing my broader outlook for Bitcoin's next major moves. This is a multi-timeframe analysis with several key phases. 🎯
**📍 Phase 1: Daily Dow Theory Reversal**
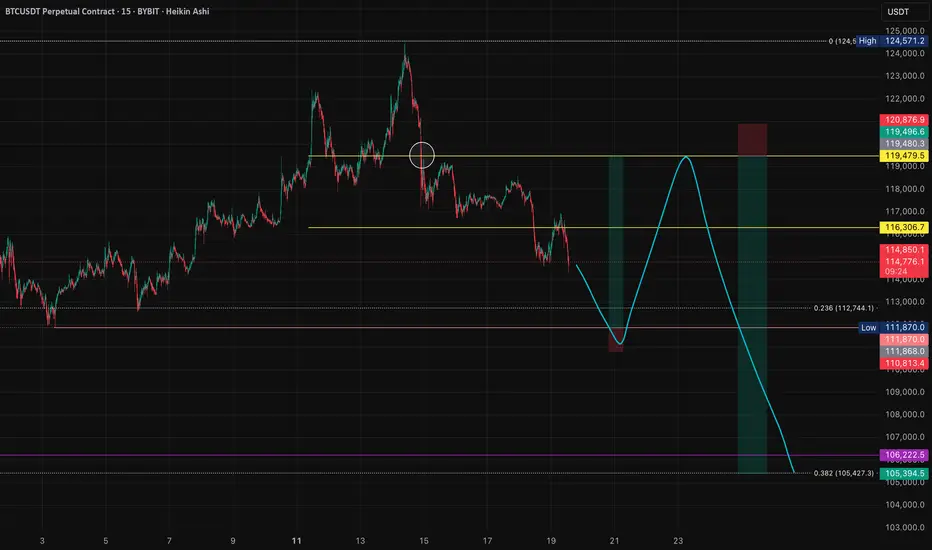
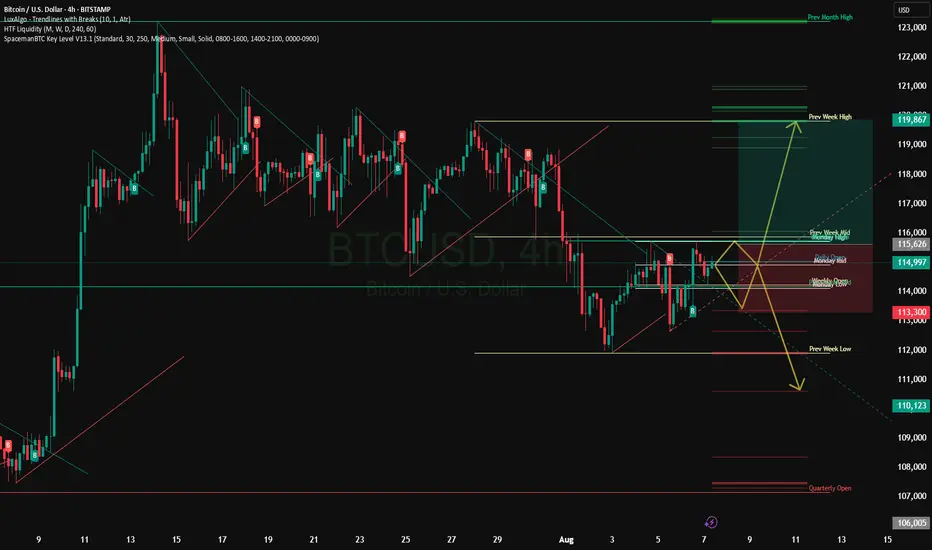
The pink line below marks the daily timeframe pivot point based on Dow Theory. I'm expecting a liquidity grab at this level first - sweeping out the stop losses parked below this key structural point. 🔄
**📈 Phase 2: The Counter-Trend Rally**
After the liquidity hunt, I'm looking for a recovery back toward the upper yellow horizontal line - this represents the recent range high. This would be a classic "fake-out" move to trap short-biased traders before the real decline begins. 🎭
**⏰ Time Factor Consideration:**
If this rally extends into next week or beyond, we might only see a recovery to the lower yellow horizontal line instead. **Time affects momentum** - the longer price takes to develop, the weaker the eventual bounce tends to be. 📅
**📉 Phase 3: The Main Event**
Finally, I'm anticipating a significant decline down to the purple line at the bottom - approximately the 0.382 Fibonacci level. This would represent the major corrective move. 🎯
**⚠️ Risk Management Note:**
I cannot provide a risk-to-reward ratio for this setup yet. **Why?** Because I don't know exactly how price will behave at each critical level, and the stop loss placement will depend on how the structure develops. The R/R calculation will determine whether I actually take this trade or pass on it. 📊
**🧠 Key Takeaway:**
This is a perfect example of why having a plan is different from having a trade. I know what I want to see, but I won't commit capital until the risk-to-reward makes sense. Patience pays in trading. ⏳
---
**Trading is simple.** You don't need multiple indicators or dozens of lines on your chart. A clean and simple chart often works best — it keeps your decisions consistent and reduces uncertainty. Sure, it might not look flashy, and my analysis may seem a bit "plain" compared to others… but that's how I like it. If you find this analysis useful, feel free to follow me for more updates.
---
*Disclaimer: This post is for general informational and educational purposes only. It does not constitute financial advice, investment recommendation, or a service targeting specific investors, and should not be considered illegal or restricted information in any jurisdiction.*
Btctechnicalanalysis
BTC/USDT 4H Trade Idea – Demand Zone Rejection & Liquidity Sweep
Bitcoin is currently retesting a strong support zone after a sharp sell-off. Price dipped into the liquidity sweep / manipulation zone, triggering stop hunts below the support area. This often indicates accumulation by smart money before a potential reversal.
📌 Plan / Setup:
Watching for bullish confirmation in the highlighted demand zone.
Possible entry after rejection or confirmation candle.
Stop-loss: Below the liquidity sweep zone.
Target 1: 119,200 (immediate resistance).
Target 2: 121,000 (major resistance zone).
🔑 Why this setup looks strong?
Historical demand zone support respected multiple times.
Liquidity grab below support hints at reversal potential.
Clear risk-to-reward if price reclaims resistance levels.
⚠️ Risk Disclaimer: Trade with proper risk management. This is not financial advice, just an educational trade idea.
Hashtags & Keywords for TradingView
#BTCUSDT #Bitcoin #CryptoTrading #SwingTrading #DayTrading #PriceAction #LiquiditySweep #SupportAndResistance #DemandZone #SmartMoneyConcepts #TradingPsychology #RiskManagement #CryptoAnalysis

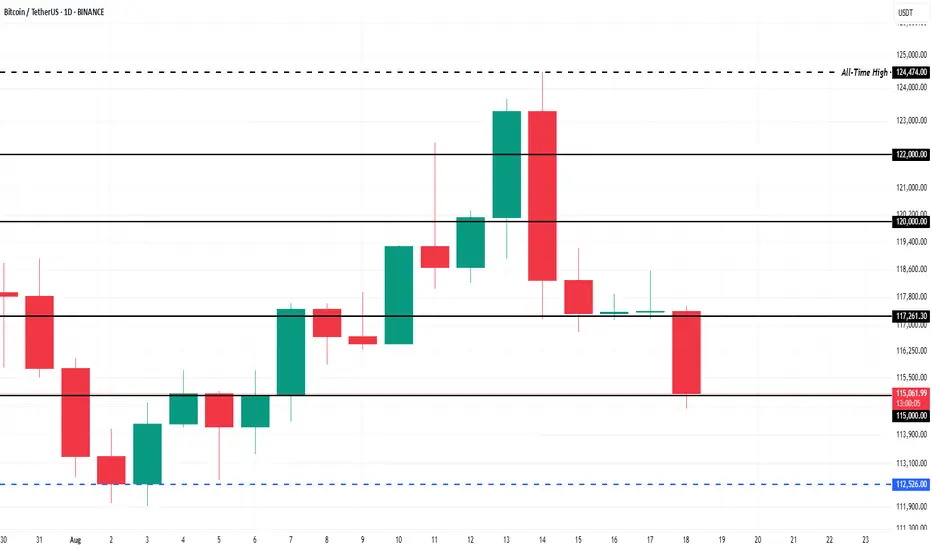
Bitcoin Price Forecast: Indicators Suggest $127,000 TargetAt the time of writing, BINANCE:BTCUSDT trades at $115,061, holding firmly above the $115,000 support. The models suggest that selling by STHs will remain limited until BTC approaches $127,000, which sits above the previous all-time high of $124,474 and marks the next major profit-taking level.
For BINANCE:BTCUSDT to reach this target, broader market support will be necessary. Geopolitical tensions remain a drag on sentiment, but renewed investor confidence could aid momentum. Reclaiming $117,261 as support and pushing to $120,000 would set the stage for a potential new all-time high in the near term.
If conditions worsen, BINANCE:BTCUSDT risks losing $115,000 support, with a possible decline to $112,526 or lower. Such a move would invalidate the bullish thesis and highlight the vulnerability of BTC to external pressures, reinforcing caution among traders while the market reassesses its trajectory.
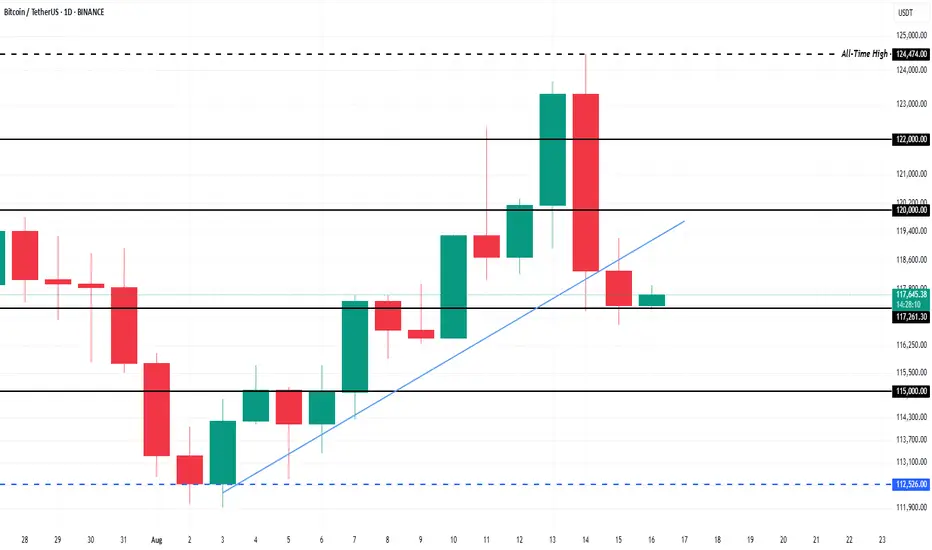
Bitcoin Key Holders Turn Neutral Ahead Of Volatility ExplosionBINANCE:BTCUSDT price had shown an upward trend throughout the month, but this momentum faltered in the last 24 hours, with BTC falling to $117,305 . This decline occurred as the price slipped below the established uptrend line, signaling a shift in market sentiment.
If investors maintain their positions during the expected volatility surge, BINANCE:BTCUSDT could stabilize above $117,000. This would open the door for a potential push toward $120,000, turning it into support and allowing further upside movement.
However, if investor sentiment turns bearish and selling increases in response to volatility, BINANCE:BTCUSDT could face a significant drop . In this case, the price may fall through the $115,000 support level, potentially reaching as low as $112,526 . This would wipe out the gains seen in August, invalidating the bullish outlook.
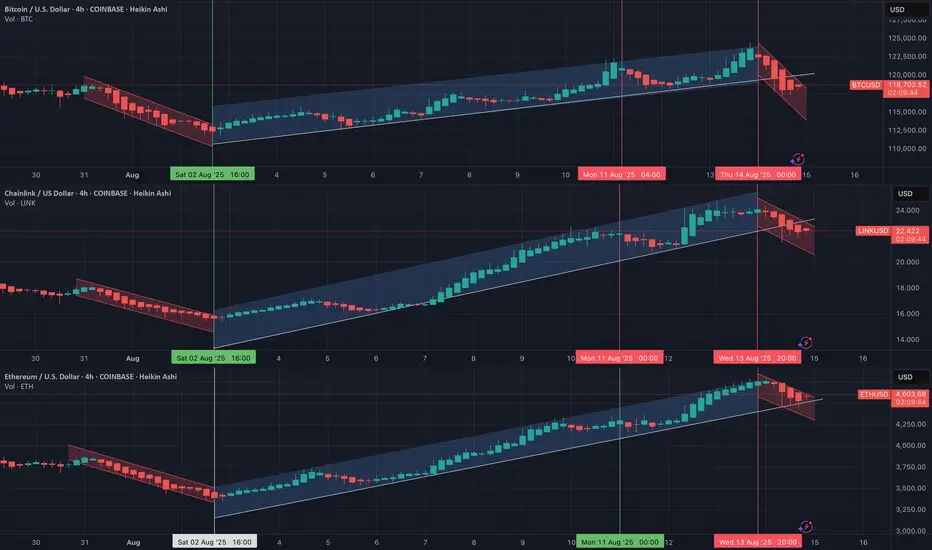
Do you ever wonder why most cryptos are doing the same thing?I've been a student of Bitcoin full time for 5 years. Once you learn Btc you know where the rest of the market is going.
Btc anticpated downside - short term price action explainedHere is a 15 min chart to follow up on the daily chart below (chart originated Aug 9th)
Now that my uspide has hit (within 1% and within the expected timeframe)... I have outline the anticipated path down to my lower target (red) T1.
I will turn very bullish after my red target gets hit.
May the trends be with you.

Btc hit my upside target perfectly. Now retrace to downside T1?On Aug 9th, I suggested that Btc would break the downward trend and head up to my upside target (green T1). It did so the next day. I then anticipated a retrace to either T1 or T2 based on historical data (see chart below)
My upside target hit within 1%. So now...with the highest probability, Btc may now retrace into T1 (1st red box). There's always a chance it can go lower, but based on price action I expect a bounce at T1. We may not get T2 (even though there is a higher historical probability).
There is still that 12% chance Btc is just up only from here (with NO retrace into T1).
***Let me know what target you think will be hit (T1 or T2), or if you think up only from here.
May the trends be with you

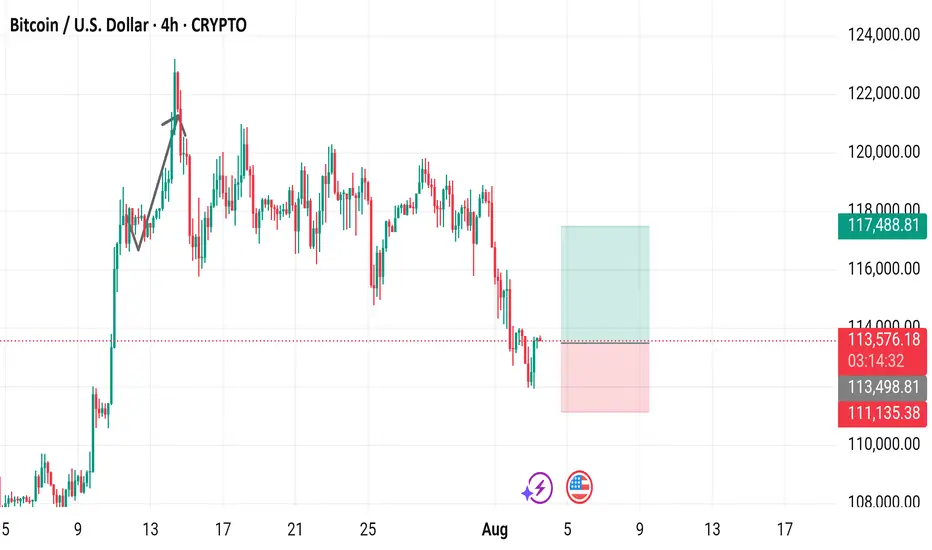
Bitcoin / U.S. Dollar 4-Hour Chart (BTCUSD)4-hour chart displays the price movement of Bitcoin (BTC) against the U.S. Dollar (USD) from late July to August 3, 2025. The current price is $113,570.31, with a 24-hour change of +$1,064.77 (+0.95%). The chart shows a recent upward trend followed by a sharp decline, with key levels marked at $113,570.31 (buy/sell price) and $111,135.38 (support level). The trading volume and price range are highlighted, with a notable drop below the $113,570.31 level as of 03:16:00 on the chart.
BTC At Key Support! Will Bulls Breakout From $116K? Don’t Miss **💎 BTC TRADE SETUP — HOLDING SUPPORT FOR NEXT LEG UP**
📈 **Market Bias:** Mixed → Short-term pressure, long-term bullish
🔍 **Key Level:** Price holding near **50-SMA** support
⚡ **Potential:** Consolidation could fuel breakout toward **\$117.5K**
**🛠 Setup:**
* **Direction:** LONG
* **Entry:** \$116,132.70
* **Stop Loss:** \$114,500 (below support)
* **Take Profit:** \$117,500
* **Size:** 1 contract (1x leverage)
* **Confidence:** 70%
* **Timing:** Market open
📌 **Why Long?**
* BTC above major moving averages — bullish trend intact
* RSI & MACD hint at possible upside momentum
* Favorable risk-reward near key support zone
⚠ **Risk Note:** Breakdown below **\$113,069** (50-SMA) flips bias bearish. Volatility can cause sharp swings — position sizing matters.
---
**#BTC #Bitcoin #Crypto #BTCUSD #CryptoTrading #Cryptocurrency #CryptoSetup #DayTrade #SwingTrade #PriceAction #CryptoSignals #TechnicalAnalysis #BitcoinPrice #BreakoutTrading #SupportAndResistance #BTCAnalysis #MovingAverages #RSI #MACD #CryptoInvesting #BullishSetup #CryptoMarket**

Current situation BTCUSD Current situation
The price is trading around $114,959, having reached a daily high of ~$115,678 and a low of ~$113,851.
BTC is holding the 50-day moving average (SMA) and the downtrend is not dominant - this level is an important technical support.
A bull flag pattern has formed, which indicates a likely further upward momentum. Support is formed near $110,000, and a potential breakout target is $120,000.
Technical patterns and levels
The inverted head and shoulders pattern on the weekly chart indicates further growth. The neckline is at ~$115,000 - its breakout can open the way to targets in the range of $132K - $141K, and the theoretical measurement of the movement predicts up to $172,000, which is ~50% growth.
After an unsuccessful attempt to overcome the resistance at ~$115,600, the bearish trend remains in the short term.
However, the stability above $114,500 is supported by the growth of institutional interest and the inflow of capital into crypto products, which creates the preconditions for a possible breakout.
Main levels and signals
Support: ~$110,000 is a critical level, the violation of which will cross out the optimistic scenarios.
Resistance: ~$115,600–115,700 is the nearest barrier. A sustainable breakthrough through it with volume can open the way up.
Goals for growth: $120,000 → then $132,000–141,000 → potentially up to $172,000.
Risks: A failure below $110K can trigger a deep correction. .
$BTC bouncing over crucial support!CRYPTOCAP:BTC is currently pulling back from the $123K resistance area, heading toward a major confluence support zone between $107K–$110K, which aligns with:
✅ Previous breakout zone
✅ 0.5–0.618 Fibonacci retracement
✅ Lower bound of the ascending channel
✅ 200 EMA support
This level is expected to attract buyers and act as a strong base for the next bullish leg.
Price dips into the $107K–$110K support
Look for a bullish reversal (reaction candles or bullish divergence)
Target 1: $128K – retest of resistance
Target 2: $132K – upper boundary of the ascending channel
CRYPTOCAP:BTC remains within a healthy bullish structure.
This pullback is constructive, not bearish.
The $108K–$110K zone is a high-probability long setup — wait for bullish confirmation before entering.
A daily close below $106.8K would invalidate the structure and open up downside risk.

BTCUSD ideaWe are waiting for our asset to reach our action zone, and based on the reaction, we’ll decide on our next moves.ALWAYS WAIT FOR A CONFIRMATION TO SEE IF THE PRICE VALIDATES THE ZONE.and you what is your vision of the EURUSD its interests me! i wait you in the commentary

BTC/USDT Buy Setup – VSA & Demand Zone Reaction✅ Entry: Current price action near 117,297
🎯 Target: 119,078 (+1.22%)
🛑 Stop Loss (SL): 116,944 (below demand zone)
📊 Technical Insight (Volume Spread Analysis):
Stopping Volume at Lows:
The recent down move halted with a wide spread down-bar on high volume, followed by an immediate rejection. This indicates potential professional buying absorbing supply.
No Supply Confirmation:
After the stopping volume, several narrow spread candles on low volume formed, suggesting weak selling pressure and a lack of commitment from bears.
Bullish Reaction:
Price rebounded from the demand zone with increasing volume on up-bars, showing early signs of demand dominance.
The current consolidation just above the support is typical of absorption before a markup phase.
Risk-Reward Structure:
The setup offers a favorable 2.2:1 R:R ratio, with the stop placed just below the zone to avoid false breakouts while allowing the trade room to breathe.
📌 Trade Plan:
Bias remains bullish as long as price holds above 116,944.
A breakout above the minor resistance (117,828) with volume expansion would confirm the next leg up toward the 119,078 target.
If volume fails to support the move, reassess before committing additional capital.

BTC-----Sell around 118000, target 116500 areaTechnical analysis of BTC contract on July 25:
Today, the large-cycle daily level closed with a small negative line yesterday, and the K-line pattern continued to fall. Although the price is at a high level, the attached indicator is dead cross. The current big trend is falling. From the overall trend and the trend law, the pullback is not strong. Instead of breaking the high, the decline is strong and continuous. Then the trend is also slowly changing. The key support position below is 115700 area, which is the position to pay attention to today and next week; the short-cycle hourly chart currently has a continuous negative K-line pattern, the price is below the moving average, and the attached indicator is dead cross. The continuation of the intraday decline is a high probability trend, and whether the European session can continue to break the previous low is the key. The current short-term resistance position is in the 118000 area.
Today's BTC short-term contract trading strategy:
Sell at the 118000 area of the pullback, stop loss at the 1118500 area, and target the 116500 area;

$BTC Breakout Coming?CRYPTOCAP:BTC is coiling up inside a symmetrical triangle on the 2H chart.
A breakout looks close if it clears resistance; we could see a 7.5% move toward the $127K–$128K zone.
Watch for volume confirmation.
DYOR, NFA

Can Bitcoin reach new highs?Bitcoin reached around 121722, close to the expected target of 130,000. There are two current expectations:
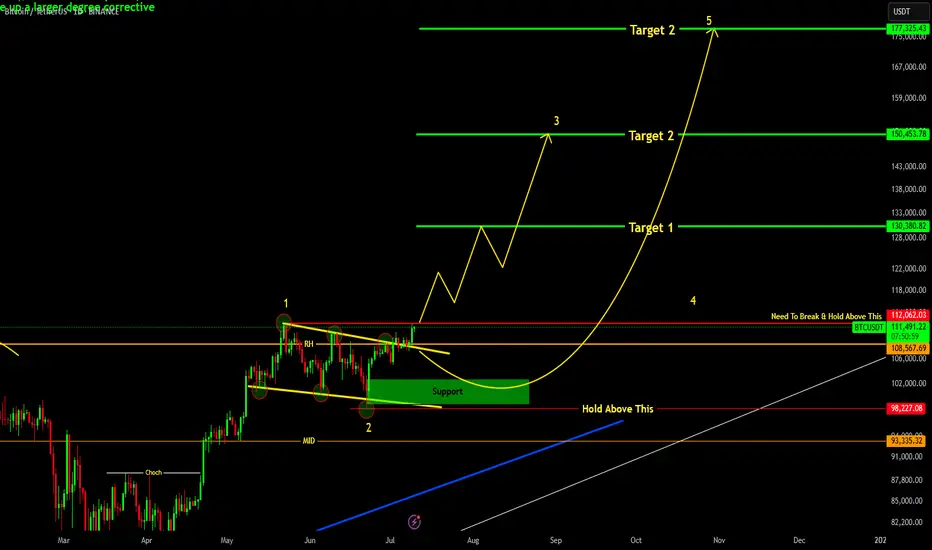
1. Black line: 5-wave rising structure, currently in the 3rd wave rising, and there will be a 5th wave rising after the correction.
2. Purple line: abc rising structure, currently in the last wave c rising, will end the rise ahead of time.
The rise is not yet complete. If it falls below the lower track of the channel, the rise will end.


ARE YOU READY FOR 150K+ BTC RALLY !!!BTC has successfully broken out it's bull flag resistance and currently testing above it.
Major resistance resides above is 112K level , if we successfully break and hold above it then easy targets would be 130-150k levels.
Elliott Wave Count final targets 180k level.
If we goes below 106k level then we may see BTC getting into support region of 102-100K region.
For all of this, BTC should remain above 98K level.
BTCUSD BULLISH MORE all time high again The price may briefly break above the 113,000–114,000 level (first target) to trap long positions, then sharply reverse.
Support Break Warning:
If BTC fails to hold the 110,000–108,000 support zone, it could accelerate a drop to deeper supports:
Support Area 1: 106,000
Support Area 2: 102,000
Extreme Bearish Target: 96,000–94,000
What to Watch:
Bearish divergence on lower timeframes
Volume drop on new highs = possible fakeout
Candle rejection from 113,000–114,000 zone

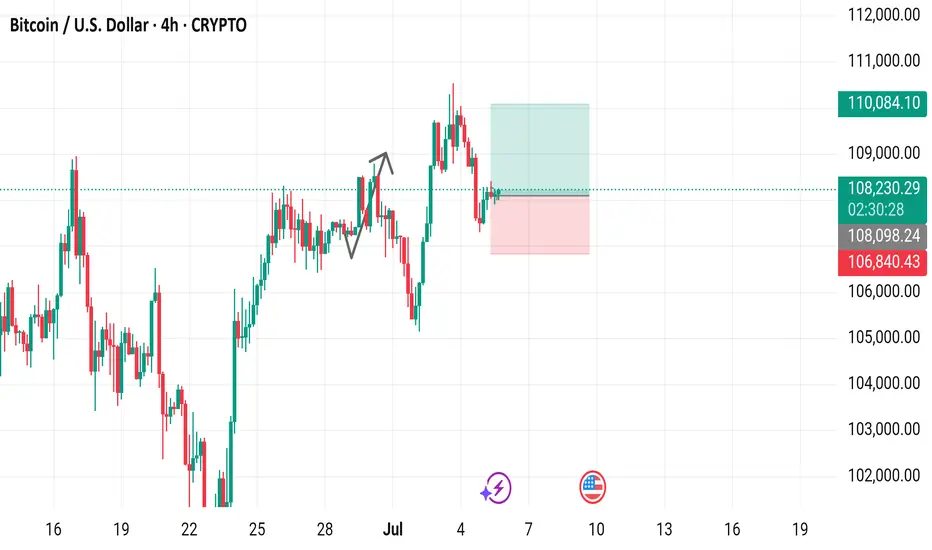
Bitcoin / U.S. Dollar 4-Hour Chart - CRYPTO4-hour candlestick chart displays the Bitcoin (BTC) to U.S. Dollar (USD) price movement, currently at $108,252.17 with a 0.21% increase (+$230.82). The chart highlights a recent upward trend with key price levels marked, including a buy price of $108,252.17 and a sell price at the same level. Support and resistance zones are indicated with a pink shaded area around $106,840.43 to $108,252.17 and a green shaded area near $110,084.10. The chart spans from late June to July 7, 2025, with the latest data point at 06:27 PM PKT on July 5, 2025.
$BTC/USDT daily chart $121K next.CRYPTOCAP:BTC just broke out of a descending wedge on the daily chart, a strong bullish signal.
It’s now holding well above key support and the 50-day moving average, showing buyers are in control.
If BTC stays above $106,400, we could see a move toward $121K next.
DYRO, NFA

BTCUSDT – Accumulation Confirmed? Wyckoff Blueprint Playing Out Bitcoin continues to compress inside a defined range, resting above both a rising trendline and a former resistance turned support zone. This structure fits cleanly within a Wyckoff-style Accumulation Phase (B-C).
We’re now at a critical moment where smart money may be absorbing supply, preparing for the next phase.
🔍 Key Observations:
Range-bound price action with higher lows and muted volume
Spring-like wick and recovery from the bottom of the range
Support holding at prior breakout zone and ascending trendline
Structure shows signs of stealth accumulation with a possible breakout ahead
Sideways movement with fading volatility
Gradual compression within the range
Strong support defended multiple times (might make the support weaker as well !)
A potential spring/retest event may already be in play
You’ll see fakeouts, wicks, and hesitation in this phase — designed to trap weak hands. But the underlying behavior points to preparation, not distribution.
The quiet before the markup. Let the market reveal its hand. 📈

$BTC Long Setup. CRYPTOCAP:BTC Long Setup
Price bounced from the key demand zone.
- Entry: CMP
- SL: $108,517
- TP: $110,030
DYOR, NFA
