Bitcoin's life and death lineAfter hitting the previous high, Bitcoin quickly retreated and has recently repeatedly tested the pressure level near 116,000. Only by breaking through this position can it continue to move upward to 118,000-120,000. On the contrary, if the support level of 113,200 is lost, it may pull back to the 110,000 line. Overall, the structure of the rising channel is still intact, and short-term fluctuations are more likely. The effectiveness of the breakthrough of 116,804 will determine the medium-term direction.
Btcusdanalysis

WEEKLY UPDATE ON BTC, ETH, BTC.D - 9/7/2025This weekend's technical analysis is an update from previous week's analysis posted. I am expecting BTC to continue it's price action to the daily 200 EMA after the relief bounce off from the weekly 21 EMA as noted last week. Our BTC analysis will be invalidated if the on the daily chart we get a candle open and close above $114k on good volume and momentum as the weekly and monthly chart is still in a strong uptrend.
ETH pullback is also intact as discussed from last week and approaching the breakout price level of $4000 which coincides with the weekly 9EMA support zone. I will be expecting ETH bulls to battle this level in a consolidation price action before a break down to the weekly 21 EMA target of 3,500.
Bitcoin Dominance did follow through our analysis last week with the inverted hammer play and has now also given some confirmation of a temporal reversal based on indicators. I will be expecting a bounce on Bitcoin Dominance to the resistance level of 59.2% and if there enough momentum to break through the resistance then next target will be 60.64%.
That's a summary of what I will be looking for on these charts as the week unfolds. Thanks for spending time to listen to my analysis and opinion and I wish you the best of trading this week. Cheers !!!

BTC.D ON SUPPORT. Following my previous outlook: #BTC.D is now sitting right on key support around 57% 🎯
Upper resistance/retest zone: 60.00% - 60.50%
Looks like we could see a bullish retracement coming for the #alts market! 👀🚀
(bull cycle phase?)

High-level fluctuations, BTC short-term trading arrangements#BTCUSD
After BTC started to rise from 113500, it continued to fluctuate and consolidate at a high level, and is also waiting for the specific basis point of the Federal Reserve's interest rate cut. In the short term, BTC is experiencing a retracement. Aggressive traders can consider trying to arrange long orders at 115500-115000. Once it falls below 115000, SL is carried out in time, with the target looking at 116500-117500.

BTCUSD Trade IdeaBTCUSD Market Analysis:
Bitcoin (BTCUSD) recently faced rejection around the 11,650 level, indicating resistance at that point. This rejection suggests that the price struggled to break above this zone, leading to a potential reversal or consolidation.
Key Support Levels:
Major Support: Near 108,500 – This is a significant level where buying interest might emerge, providing a potential floor for the price.
Minor Support: Near 110,500 – A less strong support level, which could temporarily halt downward movement if the price approaches it.
Implications:
The rejection around 11,650 hints at a possible downside, but the support levels at 108,500 and 110,500 are critical areas to watch. If the price approaches these supports, traders should look for confirmation signals before considering long entries, as a bounce could occur from these zones.
Trading Tips:
Monitor for bullish confirmation if the price nears support levels.
Watch for possible break below 108,500, which could signal further downside.
Use these levels for setting stop losses or take-profit targets.
Stay cautious and manage your risk accordingly!

Bitcoin Price To Climb Higher Amid Rising Institutional AdoptionBitcoin Price To Climb Higher Amid Rising Institutional Adoption, Yet Ethereum's Relative Value Puzzles Investors
The digital asset landscape presents a fascinating dichotomy. Bitcoin, the undisputed leader, appears poised for a significant ascent, with analysts increasingly confident in a rally toward the coveted $120,000 mark. This optimism is overwhelmingly fueled by a powerful and sustained wave of institutional adoption, underscored by staggering inflows into U.S. spot Bitcoin Exchange-Traded Funds (ETFs). However, a perplexing counter-narrative is unfolding with Ethereum. Despite its own significant institutional embrace and the successful launch of its own ETFs, the ETH/BTC price ratio remains stubbornly low, signaling a relative weakness against Bitcoin that has left many investors searching for answers.
Bitcoin's Bullish Momentum: The Unstoppable Force of Institutional Capital
The sentiment surrounding Bitcoin is palpably bullish. After a period of consolidation, the cryptocurrency has shown remarkable resilience, holding key support levels and demonstrating renewed strength. Bitcoin is trading at elevated levels, with technical analysts and market experts setting their sights on the next major psychological barrier of $120,000. A sustained break above this level is widely expected to trigger a fresh wave of buying pressure, potentially propelling the price toward new all-time highs.
A flurry of price predictions from various financial institutions and seasoned analysts paints a picture of widespread optimism. Forecasts range from conservative six-figure targets to highly bullish projections well above $200,000. These predictions are united by a common thread: the transformative impact of institutional adoption.
The primary engine driving this bullish outlook is the unprecedented success of U.S. spot Bitcoin ETFs. These investment vehicles have served as a regulated and accessible bridge for institutional capital to flow into the digital asset space. Recent weekly net inflows have been measured in the billions of dollars, reversing previous outflows and signaling a renewed and voracious investor appetite. Leading funds from major asset managers have been the primary beneficiaries, consistently attracting hundreds of millions in fresh capital.
This influx of institutional money represents a fundamental shift in how Bitcoin is perceived. Major institutions are actively adding exposure and incorporating Bitcoin into their long-term investment strategies. This is evidenced by the behavior of "whales"—large Bitcoin holders—who have been accumulating significant amounts, viewing price dips as buying opportunities. The growing institutional presence is also contributing to a reduction in Bitcoin's notorious volatility, making it a more attractive asset for diversified portfolios.
Further bolstering the bullish case are favorable macroeconomic conditions. With expectations for lower interest rates, the appeal of risk assets like Bitcoin is on the rise. A weaker U.S. dollar and lower borrowing costs historically create a fertile environment for assets with a fixed supply to thrive. The confluence of massive ETF inflows, strategic institutional accumulation, and a supportive macroeconomic backdrop has created a powerful tailwind for Bitcoin.
The Ethereum Conundrum: High Adoption, Low Ratio
While Bitcoin basks in the glow of institutional validation, the story for Ethereum is more nuanced. On the surface, Ethereum is experiencing its own institutional renaissance. The approval of spot Ethereum ETFs has been met with considerable enthusiasm, attracting billions in capital and providing a regulated pathway for traditional investors to gain exposure to the world's leading smart contract platform.
The inflow data for Ethereum ETFs has been impressive, at times even surpassing Bitcoin's on a monthly basis. Cumulative inflows have reached a significant figure, a clear testament to the growing recognition of Ethereum's value proposition, which extends beyond a simple store of value to encompass the vast ecosystems of decentralized finance (DeFi), non-fungible tokens (NFTs), and real-world asset (RWA) tokenization.
Institutions are not just buying ETH through ETFs; they are also actively participating in the network's staking mechanism. An unprecedented surge in staking activity has seen a significant portion of ETH's circulating supply locked away to secure the network and earn yield. This "supply squeeze" is fueled by both institutional players and large individual holders, underscoring the long-term conviction in Ethereum's future. With a large percentage of the total supply staked, the available liquidity on exchanges has dwindled, a factor that would typically be expected to exert strong upward pressure on the price.
Given this backdrop of robust adoption, significant ETF inflows, and a tightening supply, one would expect Ethereum to be gaining ground on Bitcoin. However, the ETH/BTC price ratio, a key metric that reflects the relative value of Ethereum to Bitcoin, tells a different story. This ratio has remained stubbornly below the 0.05 mark, a level that signals relative weakness for ETH. It currently hovers at a low level, far from its historical peak.
This persistent underperformance is a source of considerable debate. A higher ratio indicates that ETH is appreciating faster than BTC. The current suppression suggests that while absolute demand for Ethereum is strong, the demand for Bitcoin is even stronger.
Several factors may be contributing to this conundrum. Bitcoin's established brand and its narrative as "digital gold" give it a powerful first-mover advantage, particularly among institutional investors taking a conservative, phased approach. For many, Bitcoin is the initial and primary allocation.
Secondly, Ethereum's utility introduces complexities and risks compared to Bitcoin's simpler value proposition. The ongoing evolution of the network, while bullish long-term, may present a steeper learning curve for some investors.
Furthermore, a historical trend of Bitcoin outperforming Ethereum may have created market inertia, with capital continuing to flow into the asset with stronger recent relative performance. In essence, both assets are appreciating, but Bitcoin is doing so at a faster rate, keeping the ratio suppressed.
Beyond the Big Two: Other Trending Cryptos to Watch
While Bitcoin and Ethereum dominate, the broader cryptocurrency market is a hotbed of innovation. Investors are exploring a diverse range of projects with potential for significant growth, driven by several key trends.
Layer-2 Scaling Solutions: As Ethereum faces demand-driven congestion, Layer-2 solutions have become indispensable. Projects offering faster, cheaper, and more scalable environments for decentralized applications are capturing a growing share of activity and represent a crucial investment theme for ecosystem growth.
Integration of Artificial Intelligence and Blockchain: The convergence of AI and blockchain is gaining considerable traction, creating new possibilities in automated trading, decentralized organizations, and sophisticated dApps. Projects leveraging AI to enhance blockchain capabilities are attracting significant attention.
Tokenization of Real-World Assets (RWA): This is poised to be one of the most transformative trends. Representing physical assets like real estate and commodities as digital tokens on a blockchain has the potential to unlock trillions in illiquid assets, making them more accessible and tradable globally. This is expected to drive a new wave of adoption.
Meme Coins and Community-Driven Projects: While often speculative, meme coins continue to exert significant influence, demonstrating the power of community and viral marketing. Their enduring popularity highlights the importance of cultural relevance in the crypto space.
The altcoin market is characterized by higher volatility and risk. However, for investors with a high-risk tolerance, it offers the potential for outsized returns based on technological adoption and market trends.
The Road Ahead: A Market at a Crossroads
The cryptocurrency market is a study in contrasts. The overwhelming force of institutional adoption is propelling Bitcoin toward potentially historic highs. The success of Bitcoin ETFs has fundamentally altered the market structure, creating a sustained demand that shows no signs of abating.
Conversely, the curious case of the ETH/BTC ratio serves as a reminder of the market's complexity. While Ethereum's own institutional story is compelling, it has yet to translate into sustained outperformance against Bitcoin.
Looking ahead, the market's trajectory will be shaped by key factors. Central bank monetary policy will continue to play a crucial role. The continued growth of the ETF market will be a primary indicator of institutional sentiment. And ongoing innovation in scaling, AI, and tokenization will determine the next generation of leading projects.
For investors, the current environment offers both immense opportunity and significant risk. The bullish case for Bitcoin appears robust, but volatility remains. Ethereum's long-term value is undeniable, but its short-to-medium-term performance relative to Bitcoin is less certain. The altcoin market holds promise but requires careful navigation.
In conclusion, the narrative of rising institutional adoption is powerfully reshaping the digital asset landscape. As Bitcoin bulls eye their next target, the broader market watches closely, navigating the crosscurrents of innovation, regulation, and macroeconomic forces that will define the future of this transformative technology.

Is Bitcoin accumulating strength for an upward move or peaking? Bitcoin rebounded after hitting the minor support of the rising channel. The recent pattern is still in the stage of oscillation and accumulation, with the price running between the strong support level of 113200 and the strong resistance level of 116784. The bullish arrangement of the moving average and the engulfing pattern form a strong bullish resonance. The lows are also gradually rising, so this rebound is not over. Friends who opened long orders can continue to hold, with targets at 116784-118000-121000.

BTC/USD Bullish Order Block Setup – Targeting 114,328BTC/USD (1H) Analysis
Trend & Structure: Price has been respecting a rising channel with clear support and rejection lines. After testing the support line, it rebounded and is now consolidating.
EMA Strategy: Price is fluctuating around the 70 EMA (111,081) and 200 EMA (110,902), showing short-term consolidation. A bullish crossover above 70 EMA may confirm further upside momentum.
Order Block (OB) Zone: The marked OB Buying Zone (109,261 – 110,252) is a strong demand area where buyers are expected to step in.
Support & Resistance: Support lies at 109,261, while the next resistance/target is 114,328.
Risk-Reward Strategy: A potential long entry from the OB zone offers a favorable R:R ratio toward the 114,328 target point. Stop loss ideally below 109,246.
Price Action: Recent wicks suggest rejection of lower levels, strengthening the bullish bias.
✅ Signal: Buy from OB Buying Zone (109,261 – 110,252)
🎯 Target: 114,328
🛑 Stop Loss: Below 109,246
Overall Bias: Bullish continuation if price respects the OB buying zone and EMA support.

Can Bitcoin break through 120,000?The Bitcoin market as a whole showed obvious "flat consolidation" characteristics over the weekend. Today's price maintained a narrow sideways fluctuation pattern, with an upper and lower range of only about 1,000 points. The bulls and bears played a moderate game in the current range, and there was no obvious directional competition. The market is temporarily in a state of accumulation.
However, from a technical perspective, after Bitcoin successfully broke through the key resistance level at the 4-hour level, it did not pull back. Instead, it showed a trend of "continuously rising lows" - that is, the low point of each pullback is higher than the previous low point. This pattern is a typical signal of a bullish trend, indicating that the overall bullish power in the market is gradually accumulating, the short-selling pressure continues to weaken, and the market direction has shifted to the bulls.
Based on this judgment, there is no need to adjust positions due to short-term sideways fluctuations. You should continue to firmly hold the long positions you have established and remain patient to "let profits fly for a while." The short-term sideways movement is more of a post-breakout accumulation phase. Once the market digests the current range, it is likely to continue its bullish trend, further opening up upside potential.
I'm Matthew, an analyst focused on technical analysis. If you have any questions regarding specific operations or trend judgments, feel free to communicate and discuss with me at any time. Let's learn trading logic together and move forward steadily in the market!

$BTC Sunday Report Bitcoin touched 116.6K CRYPTOCAP:BTC Sunday Report
Bitcoin touched 116.6K right where we expected, and I’m still holding my short position with eyes on lower targets. If price pushes into the 120–125K zone, I’ll add more there.
We already saw a dump from 116K to 107K three weeks ago, and now BTC has returned to the 116K zone, but this hasn’t changed the overall picture. Market makers continue to push altcoins higher to trap liquidity before the real move down.
⚠️ The FOMC meeting a key event, with the policy statement scheduled for Sep 17 at 18:00 UTC, followed by a press conference at 18:30 UTC. Regardless of whether the Fed cuts rates or not, I expect the market to remain bearish as liquidity is still being engineered for a larger downside play.
Added more at 116.6K (average entry now around 115.5K)
Will add again if we revisit 120–125K
Targets stay the same at 105K → 100K → 95K → 90K

$WLFI Breakout Watch.$WLFI/USDT has just broken out of its downtrend and successfully retested the support zone.
If it holds this level, the next move could push it toward $0.2880, about 31% higher from here.
DYOR, NFA

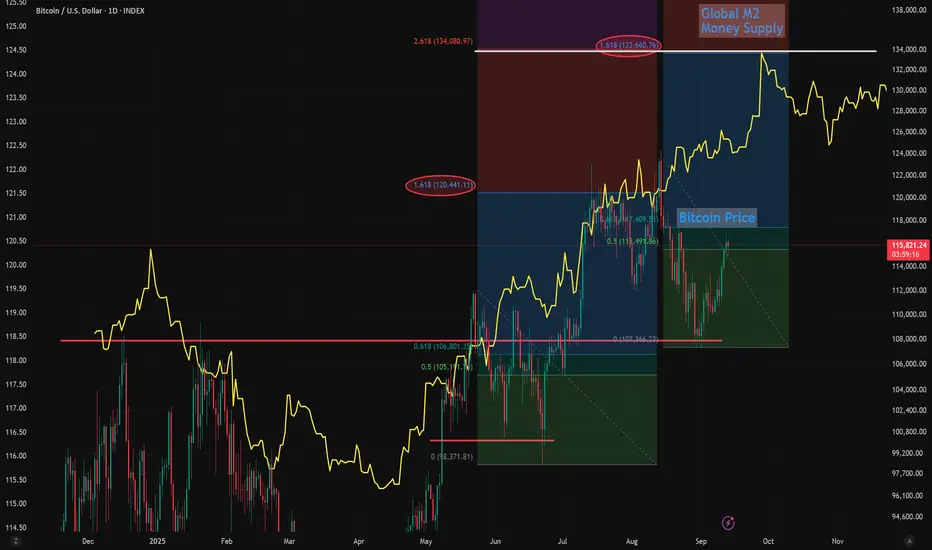
Global M2 and Bitcoin Fib Bounce Targets Point to $134K Next Global M2 has been leading Bitcoin which has been diverging, mostly due to an economic slowdown and waiting for interest rates to start dropping as a catalyst.
Since we're pricing in and high probability of 3 rate cuts starting in September, I expect Bitcoin to start pushing higher and several studies point toward $134k - $135k from here.
These Fibs studies aren't exactly correct, b/c I drew the high / low using the wiicks vs the real bocy, but still interesting.
The first Fib swing high/low correction forecast the pump to the 1.618 target.
So using the most recent high/low swing, points toward around $134k on the 1.618 which is coincidentally the 2.618 extension from the first Fibonacci.
My bull-flag targets on Bitcoin also point to a measured move of $134k-$135k as the next likely profit target, before another pullback and ultimately on the way to $150k this year I think.
Let me know your thoughts below.
- Brett
BTC Bearish QM pattern
On the daily timeframe, Bitcoin is showing signs of forming a potential Quasimodo (QM) bearish pattern. Price has recently created a Lower Low (LL) after failing to sustain the bullish structure. The key supply zone lies around 119k – 122k, where we may see a liquidity grab and bearish rejection. As long as the market reacts to this resistance area with weakness, the first target for the downside is 108,300 USDT. A clear break below 108k could open the path towards deeper levels around 100k – 95k.
For now, buyers are pushing price higher, but confirmation of a bearish reversal will only come after rejection from the blue zone.
📌 What do you think? Will BTC respect the QM setup and turn bearish from 119–122k, or will bulls push through the resistance?

BTC chart analysis – my assessment
Wave A was completed on September 1, 2024, and we are currently in wave B.
Wave C within the B structure is currently being extended. I expect a correction (wave 4) down to the green support zone, which also contains important Fib levels and a lot of liquidity.
I then expect a final upward movement to around USD 120,000. If this mark is broken on a sustained basis, I believe there is a high probability that we are no longer in a B correction, but already in wave 1 of the final wave 5. Until then, however, I expect a correction in the coming days or weeks.
Why a correction is likely:
The interest rate decision is due on September 17. I expect a cut, as the economy is weakening and inflation remains an issue. Historically, markets have tended to react bearishly to interest rate cuts, as these steps are seen more as a rescue measure.
My scenario:
First, there will be an increase to around $120,000 (market maker move), followed by a pullback to the range between $107,000 and $98,000. There is a lot of liquidity there. My first planned purchase range is between $107,000 and $106,000. From there, I expect a recovery and the formation of the final wave 5 by the end of the year. This could be followed by a major correction, partly in response to the late interest rate policy.
What do you think—could this scenario be plausible?
Best regards,
Trading Architecture

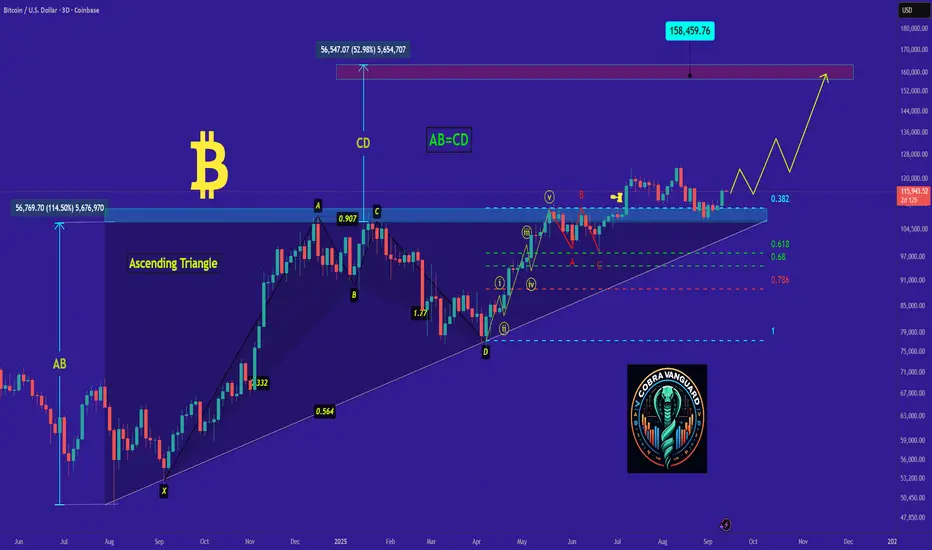
Bitcoin is bullish now & many Traders don't see it !!!Well, so far, the price has broken the triangle and the pullback is being completed. From here on, if nothing unusual happens, we can be hopeful that Bitcoin will reach $150k.
previous analysis
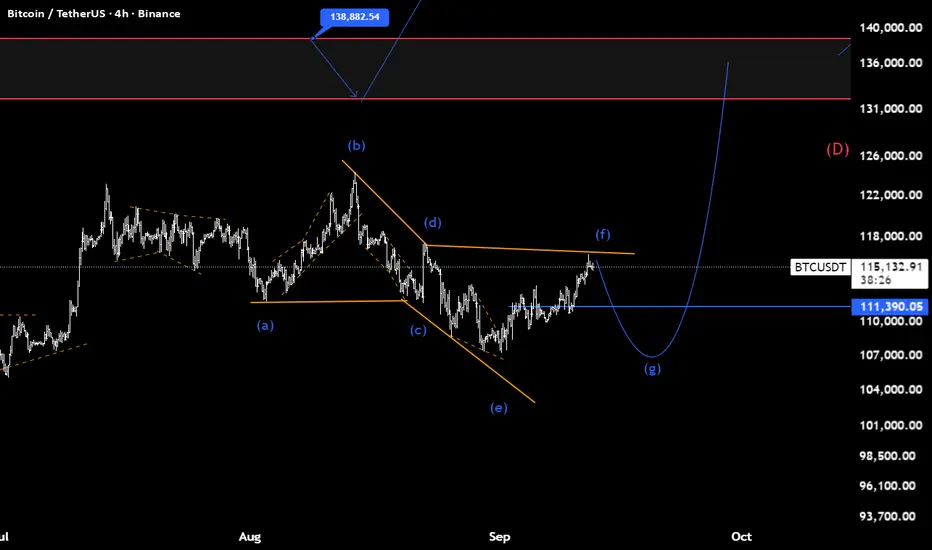
Bitcoin Road to September 17Good morning, this is my first time here.
Today we’ll take a detailed look at Bitcoin’s path leading up to the main Fed meeting later this month.
A small “impulsive” move up to 117K is still possible while the market remains weak. Weekends are always weak, and market makers take advantage of this for their manipulations.
Right now, their goal is to gather as much liquidity as possible before the next upward move. Market sentiment is not in their favor, but the weekend is helping them.
Next, there are two major liquidity clusters at 112K and 110K. By luring traders into a trap with a fake rally, the price can safely head lower. It’s hard to move down against strong bullish sentiment, but there’s no other option—otherwise, during a rally without corrections, long positions will lock in profits as the price rises, each “pulling” liquidity to themselves.
This doesn’t necessarily mean the drop will reach those exact levels. You always need to watch the market in real time, not just “guess with daisies.”
Please subscribe and support, and I’ll continue to analyze the market live as the moves unfold.
Wishing you a great weekend and all the best!

BTC / USDT : Falling wedge breakout confirmedBitcoin (Update)
BTC has confirmed a breakout from the falling wedge pattern. After some consolidation, we anticipate a strong bullish move toward the $124,000 zone.
Keep it on your radar — breakout confirmation is in place, momentum could build quickly. Always manage risk in volatile conditions.

All Eyes on 90–94K — The Next Big #BTC MoveCRYPTOCAP:BTC touched 116.6K, right where we expected. I’m still holding my position and waiting for lower targets. If price pushes into 120–125K, I’ll add more there. My main downside targets stay the same: 105K → 100K → 95K → 90K.
Don’t let price swings control your emotions. The real move is still ahead. Market makers are pushing altcoins higher just to trap liquidity before a big dump.

Allow profits to continue growing.Today, Bitcoin's price movement has demonstrated a healthy rhythm of "testing - retracing - re-attacking": in the early trading session, it first moved upward to test the previous key resistance level, then proactively retraced to the lower support to confirm the validity of the breakout. After completing the correction, it once again launched a challenge to today's high. This retracement and correction trend not only digests the selling pressure from short-term profit-taking orders but also further accumulates the bullish momentum in the market. Compared with the previous oscillating pattern where "a breakout is immediately followed by a pullback", the current trend is more sustainable, laying a foundation for the continuation of the subsequent trend.
From the technical perspective of the hourly chart, there are clear bullish signals: the moving averages have formed an upward divergence pattern, and the price has always stood firmly above all moving averages. The moving average system has switched from a "convergent oscillation" state to a "bullish arrangement". This indicates that the short-term market has gradually broken away from the previous range-bound consolidation and officially transitioned to a bullish trend. Based on the current trend judgment, there is no need to rush to adjust the positions we established earlier in accordance with the strategy; we should continue to hold the existing positions and "let profits run".
If you feel confused about the future market trend, or if you have not yet made profits in such a market, follow me and leave me a message – let me help you resolve this issue.

BTC(based on NEo wave)bitcoin is making a bow-tie diametric and finale wave is starting.
pay attention: do not buy bitcoin on this final correction,its a good time to buy altcoins like eth,doge,sol and others.
BITCOIN PREDICTION: NEXT MASSIVE MOVE TO HERE - INCOMING!!!!!!!Yello Paradisers! In this video, we have been going through multi-time frame analysis as professional traders using Elliott Wave Theory and other advanced technical indicators and analysis techniques.
On the ultra-high time frame, we have been going through the Elliott Wave price section since 2023. We have taken a look at the Moving Average Trendline Touch, which worked perfectly, the Channel Retest that is incoming, and the Bearish Divergence with Bearish Cross.
On medium and high timeframe charts, I have been sharing with you the completed zigzag and first wave. We are currently in the secondary wave, waiting for it to finish, along with resistances and bullish and bearish divergences.Together with that, there are shooting star patterns, and on a low timeframe, I have been sharing with you the triple top reclaim and the next possible resistances, and what the next resistance and target are from a multiple timeframe perspective.
Paradisers! Keep in mind to trade only with a proper professional trading strategy. Wait for confirmations. Play with tactics. This is the only way you can be long-term profitable.
Remember, don’t trade without confirmations. Wait for them before creating a trade. Be disciplined, patient, and emotionally controlled. Only trade the highest probability setups with the greatest risk to reward ratio. This will ensure that you become a long-term profitable professional trader.
Don't be a gambler. Don't try to get rich quick. Make sure that your trading is professionally based on proper strategies and trade tactics.

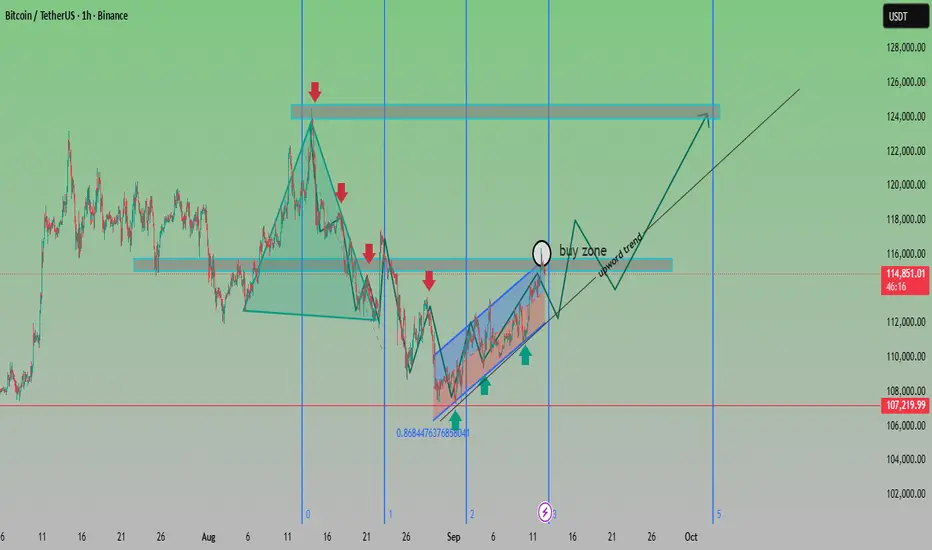
BTC Buy Zone Forming – Potential Bullish Breakout AheadAnalysis:
Trend Structure: After a corrective decline from the $124K resistance area, BTC has rebounded strongly, forming a rising channel (highlighted in blue).
Support Levels: Strong demand observed near $107,200, aligning with the 0.868 Fibonacci retracement, making it a crucial support zone.
Buy Zone: Chart highlights the $114K–$116K range as a buy zone before continuation of the upward trend.
Resistance Levels: Key resistance remains around $124K–$126K, which is the next major target if the bullish momentum sustains.
Outlook: As long as BTC stays above $114K support, the bias remains bullish, with a potential rally towards $120K–$124K. A breakdown below $112K would invalidate the bullish scenario.
✅ Bias: Bullish continuation
🎯 Targets: $120,000 → $124,000
🛑 Invalidation: Break below $112,000
Can Bitcoin still break through the highs?Today, Bitcoin's price has moved upward to test the key resistance level we mentioned earlier as expected, and this trend is fully in line with our previous strategic prediction of "exchanging time for space". Looking back at the previous market consolidation phase, we repeatedly emphasized that "there is no need to rush for short-term operations; let the bullets fly for a while" — this judgment was based on the understanding that the market needs time to accumulate momentum and wait for the trend to become clear. Now, as the price gradually reaches the target resistance level, the strategy of holding positions patiently in the early stage has reached a realization node. Currently, we can prioritize taking partial profits by closing some positions: this move not only locks in the considerable profits already obtained and avoids profit retracement caused by market pullbacks but also retains flexible space for subsequent operations.
From the perspective of subsequent market deduction, if the price is accompanied by significant volume expansionwhen testing the resistance level this time and successfully breaks through it, it indicates that the bullish momentum already has the energy to continuously drive the market. At this time, there is no need to rush to chase the rally; instead, we can wait for the price to retrace to confirm the validity of the breakout before following up to add positions and seize the new round of upward market. If the breakout fails to be supported by volume, we need to be alert to the risk of short-term pullback and maintain the existing positions for observation. In addition, we need to focus on the next resistance level above — around the 118,000 mark. This level is not only an important resistance zone formed by previous transactions but also highly correlated with market psychological expectations, and will become a core node for whether the subsequent market can further open up upward space.
If you lose your direction amid such market moves, you can follow me or leave me a message.
