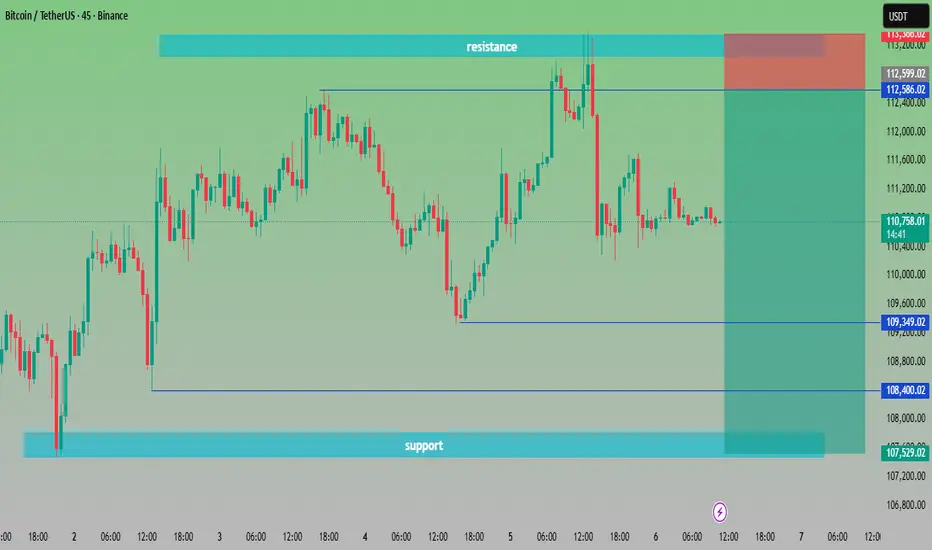
“BTC/USDT at Crossroads Key Levels to Watch🔎 Chart Analysis – BTC/USDT (45m)
Resistance Zone: Around 112,586 – 113,200 USDT. Price has tested this area multiple times but failed to break out, confirming strong selling pressure.
Support Zone: Around 107,529 – 108,400 USDT. Buyers have consistently defended this zone, making it a key demand area.
Current Price: 110,720 USDT, sitting in the middle of support and resistance.
📌 Scenarios:
Bullish Case 🟢🚀 – If BTC breaks above 112,586 USDT, momentum could push toward 113,500+ USDT.
Bearish Case 🔴📉 – If BTC fails to hold 109,349 USDT, price may retest the deeper support around 107,500 USDT.
⚖️ Trading Plan Idea:
Long Entry: Above 112,600 breakout ✅
Short Entry: Below 109,300 breakdown ❌
Target Zones:
Upside 🎯 → 113,500+
Downside 🎯 → 107,500
Btcusdanalysis
Bitcoin – H4 Mid-Term OutlookBitcoin – H4 Mid-Term Outlook
Good day Traders,
Bitcoin remains in a broad sideways range. Although the recent NFP release generated strong trading volume, the market has yet to confirm a dominant direction. For now, price continues to rotate within the 107k – 113k area.
Elliott Wave View
There are signs that Wave 5 has likely completed, while an A–B corrective phase is developing. Within this structure, the market could still deliver one more upward move before clarity emerges.
Trendline & Critical Levels
A descending trendline is capping upside momentum, offering potential early short entries. Still, a decisive break below 107k would be needed to confirm a mid-term bearish structure.
Alternatively, if price retests the trendline and rebounds, a wave C rally could unfold.
It is also worth noting that BTC remains above its rising channel, signalling that sellers have yet to take full control.
Possible Scenarios
Bullish Scenario:
Holding above 107k and breaking through 113k would open the way towards 115k – 118k. Long setups should ideally be backed by stronger volume or a confirming MACD signal.
Bearish Scenario:
A failure to defend 107k could accelerate selling pressure, dragging price back towards 104k – 101k, where key support lies.
Professional Insight
The market currently lacks clear direction in the mid-term. Monitoring price action at 107k and along the descending trendline will be critical for defining the next move. Until then, flexibility and strict risk management remain vital for traders navigating this environment.

BTC/USD – FVG Buy Zone Setup Targeting $113KChart Overview (BTC/USD 30m)
Price is currently trading at $110,517.
EMA 70 (111,276) above price → short-term bearish.
EMA 200 (110,598) acting as immediate support zone.
📐 Trend & Channel Strategy
Market is moving inside an ascending channel (support & projection line).
Price recently retraced to the support line → potential bullish continuation.
🎯 Supply & Demand / FVG Strategy
FVG Buying Zone: $109,583 – $110,217 highlighted (strong demand zone).
Entry around this zone expected to trigger a bullish reaction.
📊 EMA Crossover Strategy
EMA70 > EMA200 previously → bullish structure.
Current retest of EMA200 is key → holding above signals continuation to upside.
💎 Price Action Strategy
After strong drop, price tapped into support + FVG zone.
Wick rejection suggests buyers stepping in.
🎯 Target & Risk Management
Target Point: $113,053 – $113,064.
Stop Loss: Below $109,583 (to protect against breakdown).
Risk/Reward ratio looks favorable (approx. 1:3).
✅ Conclusion:
BTC is in an uptrend channel. After retesting the FVG buying zone & EMA200, buyers are likely to push price back toward $113,000 target 🚀📈. A break below $109,583 would invalidate this bullish setup.

Bitcoin: Edges HigherToday, Bitcoin is once again trading slightly higher than it was at the time of our update yesterday. As a result, it remains possible that price could soon make another move into the upper blue Target Zone ($117,553 – $130,891), so green wave B can form its final high. The subsequent wave C is then expected to drive BTC down significantly—ultimately completing the larger wave a and thus the first phase of the three-part wave (ii) correction in the lower blue zone ($62,395 – $51,323). Additionally, our alternative bullish scenario remains relevant. We currently estimate a 32% chance that Bitcoin is still advancing within blue wave alt.(i) and will climb into the orange alternative Target Zone ($148,363 – $168,443) to complete this move.

BITCOIN PREDICTION: SECRET PATTERN FORMING!!! (scary) Yello Paradisers! In this video, I have been analyzing Bitcoin for you on multiple time frames because we are doing professional trading analysis. On the ultra-high timeframe chart, I have been showing you the ABC corrective mode wave formation that we are doing right now and the next targets from an ultra-high timeframe perspective. Thanks to this, we can better understand the context of the overall market and make better trading ideas on lower timeframes.
On the high timeframe chart, I'm sharing with you that the zigzag of that ultra high timeframe degree B wave was, with the highest probability, finished. We are right now working on the first wave from a lower degree. I'm sharing with you also the bullish divergence.
On the medium timeframe chart, I'm putting your focus on the volume, which is dropping with the price rising. This is usually a sign of bulls being weak. Confluence this with being at resistance; it's usually a recipe for a reversal.We are also seeing two bearish divergences, which need to be confirmed, but the medium time frame is kind of bearish.
On the lower timeframe chart, I'm revealing to you the secret pattern formation: the ending diagonal. The Fibonacci sequence levels are sharing with you all the supports and resistances. I forgot to show you the confirmed bearish cross, but that's okay because the ending diagonal itself is revealing to us the next highest probability movement of Bitcoin.
Paradisers! Keep in mind to trade only with a proper professional trading strategy. Wait for confirmations. Play with tactics. This is the only way you can be long-term profitable.
Remember, don’t trade without confirmations. Wait for them before creating a trade. Be disciplined, patient, and emotionally controlled. Only trade the highest probability setups with the greatest risk to reward ratio. This will ensure that you become a long-term profitable professional trader.
Don't be a gambler. Don't try to get rich quick. Make sure that your trading is professionally based on proper strategies and trade tactics.

Outlook and Trading Ideas for Gold and Bitcoin in the FutureDriven strongly by the newly released non-farm payrolls data, the international gold price has achieved another breakthrough rally. It not only refreshed the recent high but also further consolidated the current bullish trend, which is fully consistent with our previous core view of "entering the market on retracements". For subsequent operations, we have a clear point: as long as there is no effective breakdown of the core support level at 3530, it is acceptable even if the entry point is more aggressive. The stop-loss distance should not be a reason to deter entry; simply reducing the position size will suffice. In the current strong trend, the "courage" to enter the market in line with the trend is far more important than obsessing over an extremely "precise entry point". Excessively pursuing a perfect entry point may instead cause one to miss out on the trending market.
In contrast, Bitcoin's performance during the same period was relatively moderate and failed to stage a strong breakout like gold. However, the market's resilience is still prominent: after multiple downward tests, the support level around 107,000 below has never been effectively broken. Moreover, judging from the trajectory of recent low points, there is a gradual upward trend, indicating that bearish momentum is continuously fading and the bottom area is becoming increasingly clear. For Bitcoin, it is recommended to adopt a strategy of "exchanging time for space": there is no need to rush to chase the rally; instead, wait for the price to retrace, then build long positions in batches and gradually. By holding positions patiently to absorb short-term fluctuations, we can wait for the release of upward space after the trend becomes clear.
Zoom out and BTC is in a downtrendIt's easy to get lost on mixed news and the YoY increase (although diminishing returns) and baby jumps over the last day or two. The big picture hasn't changed much! The trend and profit taking has weakened and the move to the bottom is very real. The S&P is held together by a few big tech companies - AI bubble - holding about 30% of the basket. This level of concentration is unprecedented. Noting that some are praying that cutting interest rates will fix the problem. The issue is way bigger! The US cannot keep this level of debt for much longer and all the cracks are showing. Historically, bad things happen in September and using PE / CAPE ratios among many other metrics, things are not looking good. BTC may go up, but not in a straight line. It still doesn't solve any real problems, increasing at a decreasing rate, and high transaction fees. Proceed with caution and this time it's not different, the only thing different is that it will drop harder! Best of luck and always do your own due diligence....

History Suggests Bitcoin Price Is Fated To ConsolidateBitcoin crossing the $112,500 resistance is encouraging, providing a path toward $115,000. This level is crucial for attracting new capital inflows, which would validate the recovery and increase the likelihood of sustained upward momentum.
However, historical patterns suggest consolidation remains likely. Bitcoin may settle under $115,000 or slip below $112,500, with sideways price action dominating the short term as the market absorbs recent volatility.
If profit-taking accelerates, Bitcoin could face sharper declines. A drop back to $110,000, or even a loss of this support, would weaken sentiment and invalidate the bullish thesis, leaving BTC vulnerable to extended consolidation or further downside.

NFP Jobs Data Could Trigger $116K or $105K Bitcoin MoveBitcoin is testing a critical breakout above $112,168 as markets prepare for tomorrow’s Non-Farm Payrolls report. The 4-hour chart has shown positive momentum, with BTC clearing resistance at $110,918 and pushing toward $112,856. If bulls can hold above $112K, the roadmap opens to $114,189 and $116,072. But if Bitcoin loses momentum, supports sit at $110,918, $108,592, and the deeper zone near $105,320.
The jobs report could be the catalyst that decides Bitcoin’s next big move. Consensus is around 75,000 jobs, just above last month’s 73,000. A weaker report could boost risk assets like Bitcoin as traders price in more Fed cuts. But a stronger print could cool risk sentiment and pressure BTC back into support. Either way, volatility is coming, and these levels will be key.

Bitcoin Daily SMA update- trend line tested and heldThis chart uses the SMA, Simple Moving Average
Red = 50, Blue = 100, Green = 128, Yellow = 200
As expected, PA came down and tested the trend line that has rejected PA since 13 August and has since bounced back up.
We will have to wait and see but this may have created a Higher Low as PA rose and now sits on the 100 as support.
Should PA continue to rise from here, the 50 SMA at 113254 is the line of resistance we Need to cross and test. This would then give is a Higher High.
After that, the next Higher High will be at a price after 119
Should PA get rejected, the 128 SMA is at 108995 and then the previous Low is at 107165
The Daily MACD seems to have Crossed above its signal line
This is "only Just " and so we wait to see where it goes form here but we are certainly looking Bullish in a longer term as Bulls show us they can respond.
The 4 hour BTC PA chart
This chart makes me a little cautious for now, waiting for confirmation of this move higher,
See how that 2nd Green candle after the bounce, came up and got rejected off the 100 SMA and the current candle is having the same problem.
We do seem to have support on the 50 SMA
PA is currently in a tight range above, with the SMA's very tight.
It is easier for PA to Drop from here so today could be a battle.
The 4 hour MACD is also at a point of crossing
The MACD here has NOT yet crossed the signal line and so we wait, watching to see what happens.
The Histogram shows positive momentum.
It should be remembered that we have the USA calling the possibility of Rate cuts this month.
If the FED goes against the grain, this could be damaging and should the FED decide to cut rates, we are off to the races.
This month is Pivotal.
Long term still Bullish, short term undecided..remaining Bullish CAUTIOUS

Bitcoin (BTCUSD) –> Retest Before the Next Drop?Hello guys!
After a strong run inside the ascending channel, Bitcoin has finally broken its trendline support. This is often the first warning that momentum is shifting from bullish to bearish.
Right now, price action is pulling back and looks ready to retest the broken trendline around the 111,300–111,400 zone. This level also aligns with a small supply area, making it an important zone to watch.
From a technical perspective, this retest could serve as the perfect setup for sellers to re-enter the market. If price gets rejected here, the next logical target sits at 109,857 , which is the nearest major support.
Scenario Outlook
🔼 Upside: Limited unless Bitcoin can reclaim 111,500 and hold above it.
🔽 Downside: A rejection at the retest zone opens the path for a move toward 109,857.
This makes the current structure look like a classic bearish retest setup: break → pullback → continuation.
📌 Scenario: Price touches the broken trendline, finds resistance, and then moves down toward 109,857 support.
Disclaimer: As part of ThinkMarkets’ Influencer Program, I am sponsored to share and publish their charts in my analysis.


New Bearmarket ideaHere we a have a deviation of an ascending channel, at these levels the market doesnt look lie itll have a hard sell off just yet and my overall look for bitcoin is about $26k to end this run. this bull market has been a tough pill for me to swallow but hey you live and you learn, its the only way to get better a the craft

Bitcoin at Decision Point: Will BTC Break 112K?Bitcoin remains range-bound on the 4-hour chart. The bullish case depends on holding support near 110,920 and eventually reclaiming resistance around 112,170 to open the path higher toward 114,200 and beyond. On the downside, losing 110,920 would shift focus to the 109,800–108,600 area, and a break below there could expose deeper supports near 105,300–104,800.
The main bias is still for more upside, but confidence comes only if resistance is reclaimed and momentum shifts back in favor of the bulls.

Bitcoin Daily SMA UPDATE This daily chart uses the SMA, Simple Moving Average
Red = 50, Blue = 100, Green = 128, Yellow = 200
PA got rejected yesterday from its rise over the 100 SMA and is currently testing that as support on a Daily chart.
If that fails, we could see PA retreat down to around 108900, where we have the 128 SMA and the descending line of resistance.
This line has not been tested as support yet.
As we can see on the chart, if this rejection continues down past 107165, we will have printed a Lower high, pointing towards continued price drops. with the 200 SMA at 104348
The Daily MACD has reached up to its Signal line
This could also be a point of rejection, keep your eye on this
The 4 Hour BTC PA chart shows us more near term detail
PA is currently testing the 50 as support after getting rejected from the 128 and falling through the 100.
If this fails, we can see PA will bump into the trend line, around 108900 - 108500.
To many extents, this would be a good move providing we then found support and bounced higher as it would create a Higher Low.
The 4 hour MACD
MACD has turned down and heading towards its signal line.
This may offer support but it will continue down Bearish if PA does reach down to the trend line.
Note how the Histogram has descending sharply.
Today we must sit and wait
For me, I think we could see the 109k - 108k area tested at some point over the next few days.
Maybe sooner than later

$BTC bounced to the 112K zone as expected, with even a shotCRYPTOCAP:BTC bounced to the 112K zone as expected, with even a shot at 115K possible, but I’m still holding my short from 116K. If we revisit my entry area, I’ll look to add more. For now, I’m staying in the trade and will share updates if anything changes. Targets remain 100K → 95K → 90K.

Bitcoin – Between Equilibrium and Transcendence.⊣
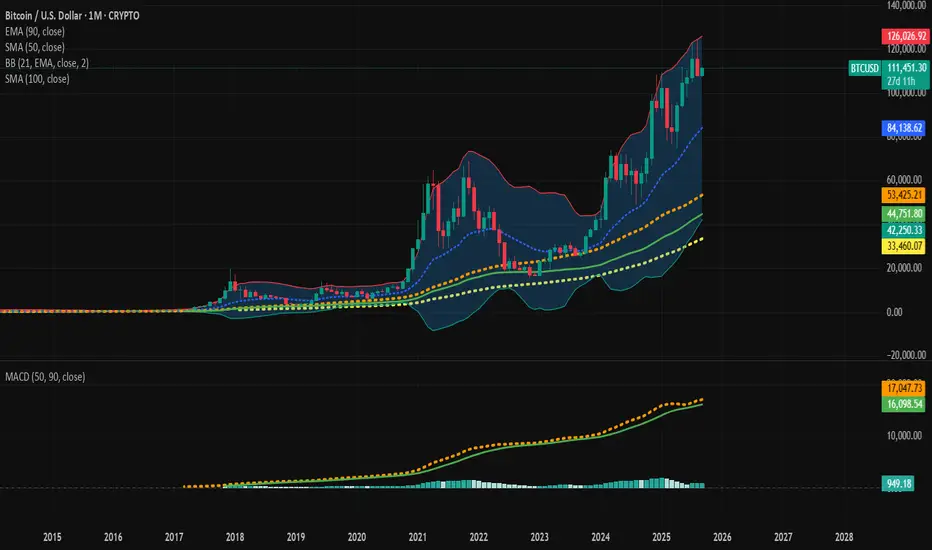
⟁ BTC/USD – BINANCE – (CHART: 1M) – (Sep 03, 2025).
◇ Analysis Price: $111,148.95.
⊣
⨀ I. Temporal Axis – Strategic Interval – (1M):
▦ EMA90 – $44,745.16:
∴ Deep-cycle moving average, historically preserved through bull markets;
∴ Distance buffer ≈ +$66.40K (+59.7%) above EMA90;
∴ No tests since the 2020 breakout -> macro trend intact.
✴️ Conclusion: EMA90 = deep structural anchor (bullish fortress intact).
⊢
▦ SMA50 – $53,419.17:
∴ Primary macro floor for post-halving cycles;
∴ Price stands +$57.73K (+51.9%) above this line;
∴ First high-timeframe defense in a major correction.
✴️ Conclusion: SMA50 = medium-term guardian support.
⊢
▦ SMA100 – $33,457.05:
∴ Extreme long-term anchor, rarely approached outside bear capitulations;
∴ Cushion +$77.69K (+69.9%) above;
∴ “Black-swan” only in current cycle context.
✴️ Conclusion: SMA100 = last-resort macro base.
⊢
▦ BB (21 ,2) - (Midline $84,111.14 / Upper $125,959.23 / Lower $42,263.04):
∴ Price rides the upper regime, sitting ~13.3% below the upper band (headroom ≈ $14.81K);
∴ Distance to midline (equilibrium) ≈ $27.04K (+24.3%) -> strong cushion;
∴ Bands are widened -> volatility expansion phase of the macro trend.
✴️ Conclusion: BB = mature expansion; (midline $84.1K) is the balance axis.
⊢
▦ MACD (50, 90) - (Line 947.03 / Signal 17,045.04 / Histogram 16,098.01):
∴ Long-cycle configuration filters noise and tracks halving waves;
∴ Histogram magnitude strong -> impulse still alive at the macro scale;
∴ No imminent bearish crossover on this slow setting; trend health preserved.
✴️ Conclusion: MACD = bullish regime with durable momentum.
⊢
🜎 Strategic Insight – Technical Oracle:
∴ Structure: Price is well above all macro bases (SMA50 $53.4K, EMA90 $44.7K, SMA100 $33.5K) and operating in the upper Bollinger regime; (midline $84.1K) marks the structural equilibrium;
∴ Momentum - (single pillar): MACD (50, 90) remains decisively positive, consistent with a continuing bull cycle;
∴ Risk rails: Upside trigger = sustained push toward/through ($125.96K - BB-upper); downside mean-reversion rails = ($99–$84K - prior clusters/BB mid).
✴️ Conclusion: The monthly chart remains Bullish-Structural and in mature expansion. As long as Bitcoin holds above the (BB midline ~$84.1K), the macro up-cycle stays intact; clearance toward ($126K) would reopen upside discovery.
⊢
𓂀 Stoic-Structural Interpretation:
✦ Structure of Trend:
∴ The price hovers far above the macro fortresses (SMA50 $53.4K, EMA90 $44.7K, SMA100 $33.5K). These remain untouched, signaling the structure’s resilience;
∴ Bollinger (midline at $84.1K) is the true axis of equilibrium: as long as it holds, the market breathes in the upper realm of expansion;
∴ The upper Bollinger bound ($125.9K) is not yet pierced, leaving the cycle suspended between present strength and future compression.
✦ Momentum of Will:
∴ The MACD (50, 90), slow and deliberate, projects a force aligned with the long halving waves: histogram positive, crossover intact, momentum unfaltering;
∴ The market’s will remains bent toward continuation, though each candle at this altitude tests the resolve of buyers;
∴ Stoic principle: strength endures until proven otherwise; momentum persists until equilibrium demands balance.
✦ Flow of Capital:
∴ Wide Bollinger bands whisper volatility unchained, inviting both euphoria and caution; liquidity expands but seeks its balance at the ($84.1K mid);
∴ Capital rotates but does not abandon the structure; the exodus of liquidity is absent from the long frame;
∴ The inflow of discipline dominates - patience governs capital flows.
✦ Interpretation of Fate:
∴ Above ($125.9K) = release into new discovery, fate embraces uncharted peaks;
∴ Between ($99K and $84K) = mean-reversion crucible, where structure is tested but not destroyed;
∴ Below ($84K) = stoic descent, a return toward (SMA50 / EMA90) bastions.
✴️ Conclusion: The monthly essence is Bullish-Structural, with fate aligned to the continuation of expansion. Yet, Stoicism reminds: no trend ascends without pause; ($84.1K) is the sacred balance, ($125.9K) the gate to transcendence.
⊢
· Cryptorvm Dominvs · MAGISTER ARCANVM · Vox Primordialis ·
· Dominivm Cardo Gyratio Omnivm · Silence precedes the next force. Structure is sacred ·
⊢
BITCOIN PREDICTION: WHY IS NOBODY TALKING ABOUT THIS!!?(warning)Yello Paradisers! In this video, we are again, as professional traders, analyzing the multi-time frame context of the market. On an ultra-high time frame, we are seeing the medium moving average touch. We are also discussing the possible channel retest, plus I'm sharing with you the bearish cross and bearish divergence.
On the high time frame chart, we are having the zigzag finished, probably with the highest probability. The first ultra-high time frame wave is starting, that is the question of this video, which we are answering, and we are seeing the bullish divergence.
On the medium timeframe, we are seeing that as we are touching the resistance, the volume is dropping, which is a bearish sign. We are seeing two bearish divergences on RSI and MACD histogram, and with the highest probability, we are finishing the first wave.
On the low timeframe chart, I'm discussing the ending diagonal with you, and I forgot to tell you about this, but we are also having a bearish cross there.
Paradisers! Keep in mind to trade only with a proper professional trading strategy. Wait for confirmations. Play with tactics. This is the only way you can be long-term profitable.
Remember, don’t trade without confirmations. Wait for them before creating a trade. Be disciplined, patient, and emotionally controlled. Only trade the highest probability setups with the greatest risk to reward ratio. This will ensure that you become a long-term profitable professional trader.
Don't be a gambler. Don't try to get rich quick. Make sure that your trading is professionally based on proper strategies and trade tactics.

BTC - WEEKLY PRICE UPDATE🟩 #BITCOIN - Weekly Price Update
🔸 Monthly: Bullish, macro uptrend is intact! 📈
🔸 Weekly: Neutral zone between $116,000 - $110,700
Following my previous outlook and livestream, price tapped the $107,000 area as expected. ✅
Here’s what I’m watching: If CRYPTOCAP:BTC pushes and holds above $110,000 daily, we could see another wave up and potentially new ATHs, trend would stay strong!
Currently, the technical setup is bullish📈
→Daily lagging span still above the cloud and SSB
→D1 candle just closed inside the KUMO = classic bullish continuation signal!
💡 My expectations:
Short-term:
→If bulls defend $110,000+ = bullish zone, see a leg to $115,600 - $116,000 next!
→If we get a D1 close & breakout above $116,000, expect further upside toward $120K+ 🚀
→Breakdown under $107,000 = negative, could trigger deeper selloff.
📊Big picture:
Momentum remains solid above $100,000 and especially $94,000 support.
Expect some green days for #alts if we hold above level mentionned as well in the coming sessions!

BTCUSD Bircoin drop, sell your minning farm, but just for nowThis Diagonal is still valid for me, selll @ 113.400
Targets 105.000 / 102.000 and 99.000
GG

BTC starts to show signs of recovery💎 BTC PLAN UPDATE – START OF WEEK (09/03/2025 )
Mid-week BTC Analysis
Currently, BTC is reacting around the support zone ~111,000 – 110,500 (confluence of EMA200 D1 and 0.5 Fibonacci). This is an important short-term support area; if it holds, a rebound may occur in the next few sessions.
If BTC bounces from this level, it could retest short-term resistance levels at:
• 111,900 – 112,200 (EMA34 + nearest resistance)
• 114,100 – 114,500 (0.382 Fibonacci)
• 116,000 – 117,000 (0.236 Fibonacci + previous strong resistance)
If the 110,500 support is broken, price could easily drop toward:
• 108,400 – 108,000 (mid-term support)
• 104,800 – 105,000 (major support, extended Fibonacci zone)
Trend:
• Mid-term: still in a corrective downtrend.
• Short-term: possible technical rebound from current support zone, with the first target around 114,000 – 116,000.
👉 In summary: Mid-week, BTC is at a critical zone. Holding 110,500 – 111,000 favors a rebound scenario; if this area breaks, downside pressure may extend toward 108K – 105K.

Has Bitcoin's long-short trend reversed?Recently, Bitcoin has demonstrated strong resilience at the key support level of 107,000: this level has undergone multiple downward tests, with no effective breakdown occurring; instead, it has rebounded quickly after each touch, confirming the market recognition of this support zone and the strength of buying interest. As the bottom support is confirmed, the price momentum has gradually strengthened and has now successfully broken through the previous resistance level on the 4-hour timeframe. Technically, a bullish structure of "valid support - broken resistance" has been formed, and the short-term trend has shifted from consolidation to a bullish bias. Based on this market change, our trading strategy needs to be adjusted accordingly: we can take a small-position long trade when the price retraces to the support level.

#BTC/USDT Bullish Divergence on 1H, Low Risk Trade#BTC
The price is moving within a descending channel on the 1-hour frame, adhering well to it, and is poised to break it strongly upwards and retest it.
We have a bearish trend on the RSI indicator that is about to be broken and retested, supporting the upside.
There is a major support area in green at 108062, which represents a strong basis for the upside.
For inquiries, please leave a comment.
We are in a consolidation trend above the 100 Moving Average.
Entry price: 108450
First target: 108959
Second target: 109541
Third target: 110325
Don't forget a simple matter: capital management.
When you reach the first target, save some money and then change your stop-loss order to an entry order.
For inquiries, please leave a comment.
Thank you.
