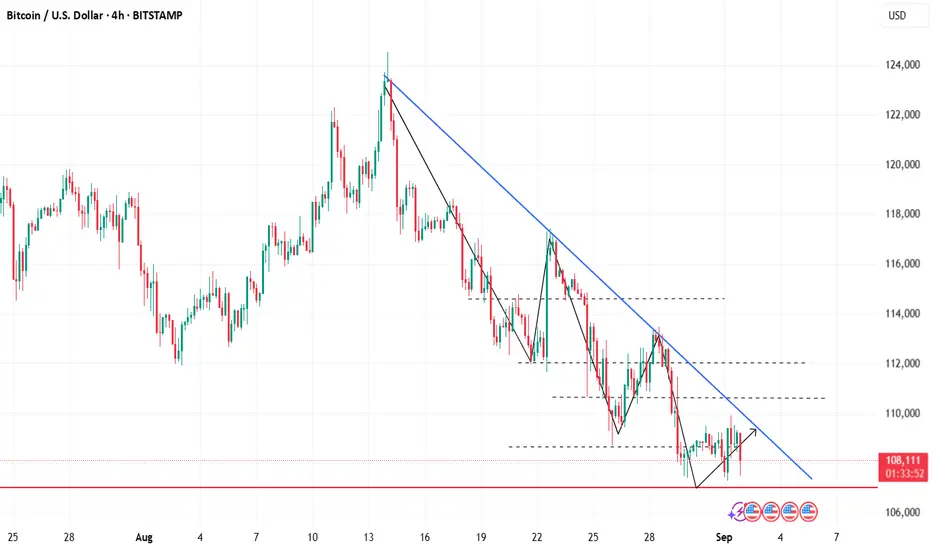
Lock in profits and go with the trend.As previously analyzed and predicted, Bitcoin has started a pullback as expected after hitting the key resistance level on the 4-hour chart. Looking at the current market, the price has broken below the support of the short-term 5-day moving average, with a MACD death cross signal appearing on the hourly chart. Bearish momentum has initially been released, and the short-term downward trend has become relatively clear.
Friends who entered positions earlier can appropriately reduce some holdings to lock in profits. If the price breaks below 107,000 later, you can continue to enter short positions after a rebound.
Btcusdanalysis
In a range-bound market, the main strategy is to short at highs.The recent movement of Bitcoin has once again validated the predictive logic put forward last week. It was previously clearly stated that "after price retests the lower support level, there may be a minor rebound" – and the current market is unfolding exactly as this rhythm suggests: after touching the key support zone, the price has indeed rebounded, but judging from the chart performance, the rebound momentum is noticeably weak.
Regarding the subsequent operation direction, before the rebound can break through the key resistance level on the 4-hour timeframe, the overall trading strategy should still focus on "shorting at highs". Pay attention to the resistance level around 110,000 on the upside, and the recent low around 107,000 on the downside.

BITCOIN PREDICTION: WHALES PREPARING HUGE MOVE!!!? (damn)Yello Paradisers! In this video, as professional traders, we have been going through multi-time frame analysis. First, we went through an ultra-high time frame where I shared with you that we are touching an important moving average trend line. Because of that, we understand that a channel retest is possible, but we need to be careful because there is a bearish divergence, and we already got a confirmational bearish cross.
On the high timeframe chart, we have seen that the ABC zigzag is already finished. Right now, we are forming a possible first ultra-high timeframe wave, and from that, we are starting the first motive mode wave. We are seeing bullish divergence, and what I forgot to say is that if we start moving to the upside and creating the secondary high timeframe wave, we will touch the CME futures gap and close it. Which is another confluence.
After that, we have been shifting our focus to the medium timeframe. I've told you that what's important is also what you don't see in the market and we are seeing so far no bearish divergence plus what I have didn't show you but there are also two bullish hammer candlestick patterns candles I have been sharing with you the moving average trend line the Fibonacci time zone and the next resistances finally at low time frame chart we have been going through the ending diagonal.
Paradisers! Keep in mind to trade only with a proper professional trading strategy. Wait for confirmations. Play with tactics. This is the only way you can be long-term profitable.
Remember, don’t trade without confirmations. Wait for them before creating a trade. Be disciplined, patient, and emotionally controlled. Only trade the highest probability setups with the greatest risk to reward ratio. This will ensure that you become a long-term profitable professional trader.
Don't be a gambler. Don't try to get rich quick. Make sure that your trading is professionally based on proper strategies and trade tactics.
I apologize; I accidentally turned off the video in the middle. Unfortunately, TradingView doesn't allow me to continue, so the next video will be here on TradingView on Wednesday. Stay tuned.

BTCUSD Bearish Since March 13, 2023, the BINANCE:BTCUSD has consistently traded above its weekly 50-period Simple Moving Average (SMA), demonstrating sustained bullish momentum. The price has tested the weekly 50 SMA on three occasions, each time finding support and maintaining its position above Moving Average. However, a significant bearish divergence is evident on the weekly chart, signalling potential weakening momentum despite the upward price trend. Given this divergence and historical price action, there is a high probability that BTCUSD may retest the $95,851–$100,000 support zone in the near term. Traders should monitor this critical area for potential price reaction.

Is Btc Ready to Fly As shown in chart inverted head and shoulder pattern ‼️ Bullish Pattern works more then Bearish Pattern.. its just my observation... what you guys think ?

LETS GIVE BTC A LITTLE BREAK SHALL WE, LET IT BOUCE A BIT, YEAH Expect a bit of bounce from this point !! Retailers have sold all their coins and now MM is gona buy back from these poor souls. BUT the end is inevitable for the ALGOS have spoken (Sorry about the messy chart guys, didn't get the time to clean it up!)

Bitcoin - Inflows Whisper Calm, Structure Awaits Discipline.⊣
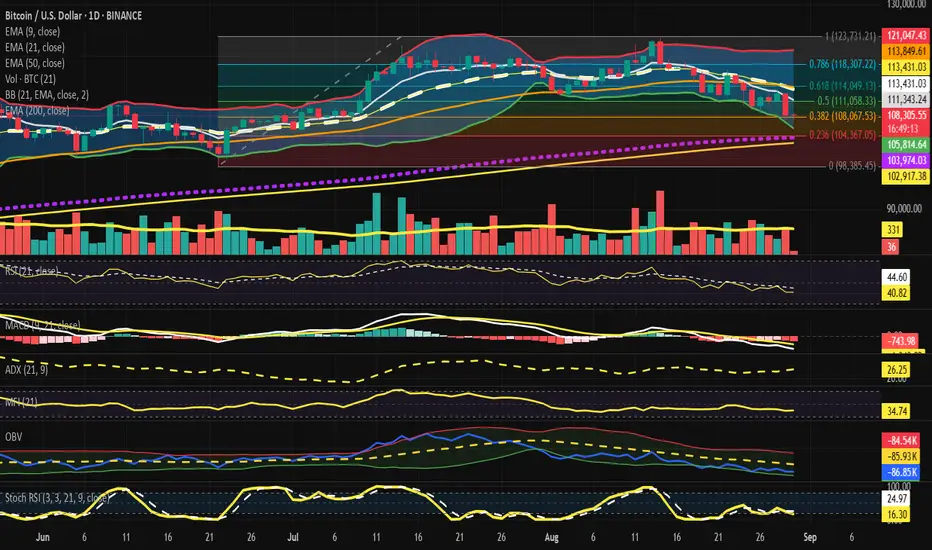
⟁ BTC/USD – BINANCE – (CHART: 1D) – (Aug 30, 2025).
◇ Analysis Price: $108,377.41.
⊣
⨀ I. Temporal Axis – Strategic Interval – (1D):
▦ EMA9 – $111,357.61:
∴ Price remains below EMA9, confirming immediate bearish control;
∴ EMA9 has flipped into dynamic resistance after multiple failed retests;
∴ Short-term recovery requires a clean daily close above EMA9.
✴️ Conclusion: EMA9 acts as near-term resistance, bearish short bias intact. Logic sealed.
⊢
▦ EMA21 – $113,437.56:
∴ EMA21 aligns with Fib 0.618 ($114,049), forming a resistance cluster;
∴ Persistent rejection since Aug 21 emphasizes mid-term weakness;
∴ Reclaiming EMA21 is the first real bullish trigger.
✴️ Conclusion: EMA21 = critical pivot to shift from bearish to neutral. Logic sealed.
⊢
▦ EMA50 – $113,852.43:
∴ Slightly above EMA21, adding weight to the $113.4 / 113.9k resistance zone;
∴ Until broken, this confluence acts as a bearish supply wall;
∴ A reclaim here reopens upside toward Fib 0.786 ($118.3k).
✴️ Conclusion: EMA50 reinforces resistance cluster. Logic sealed.
⊢
▦ EMA200 – $102,917.45:
∴ Long-term fortress, still untested in this cycle;
∴ Confluence with Fib 0.236 ($104,367) = macro defense zone;
∴ Bears’ ultimate target if current supports give way.
✴️ Conclusion: EMA200 stands as macro citadel. Logic sealed.
⊢
▦ Bollinger Bands (21, 2) – $121,042 / $113,437 / $105,833:
∴ Price riding lower band at $105.8k;
∴ Bands widening = volatility expansion with bearish tilt;
∴ Failure to revert to midline confirms continuation risk.
✴️ Conclusion: Bands highlight bearish volatility regime. Logic sealed.
⊢
▦ RSI (21, 9) – 40.90 / 44.62:
∴ RSI below neutral 50, momentum bearish;
∴ Not oversold (<30), leaving room for more downside;
∴ No bullish divergence present.
✴️ Conclusion: RSI validates sellers’ momentum. Logic sealed.
⊢
▦ MACD (9, 21, 9) – Line: –2,079.96 / Signal: –1,342.25 / Histogram: –737.71:
∴ Bearish cross intact below zero-line;
∴ Histogram remains deeply negative, no sign of contraction;
∴ Momentum acceleration still favors bears;
✴️ Conclusion: MACD entrenched in bearish phase. Logic sealed.
⊢
▦ ADX (21, 9) – 26.25:
∴ Above 25 confirms trend strength;
∴ With DI– dominance, direction is bearish;
∴ Indicates continuation rather than reversal.
✴️ Conclusion: ADX confirms strengthening bearish trend. Logic sealed.
⊢
▦ MFI (21) – 34.75:
∴ Below 50 = capital outflows dominate;
∴ No oversold signal (<20) yet;
∴ Market still has selling pressure capacity.
✴️ Conclusion: MFI aligns with distribution bias. Logic sealed.
⊢
▦ OBV (21, BB2) – (–86.84K):
∴ OBV trending lower, confirming distribution;
∴ Volume does not show accumulation footprint;
∴ Confirms sellers dominate liquidity.
✴️ Conclusion: OBV validates distribution regime. Logic sealed.
⊢
▦ Stoch RSI (3, 3, 21, 9) – K: 16.30 / D: 24.97:
∴ In oversold territory (<20);
∴ No confirmed bullish crossover yet;
∴ Relief bounce possible if crossover occurs.
✴️ Conclusion: Oversold condition may allow relief, but not structural reversal. Logic sealed.
⊢
▦ Fibonacci Retracements (0 = $98,385 -> 1 = $123,731):
0.786 -> $118,307 – (upper resistance);
0.618 -> $114,049 – (current battlefield, confluence EMA21/50);
0.500 -> $111,058 – (reclaim point for neutralization);
0.382 -> $108,067 – (current support pivot);
0.236 -> $104,367 – (deeper target, near EMA200).
✴️ Conclusion: Market clings to 0.382; Loss exposes 0.236 + EMA200 fortress; Logic sealed.
⊢
🜎 Strategic Insight - Technical Oracle:
∴ Short-term structure: price pinned under EMA9 and EMA21/50 cluster, bearish dominance confirmed;
∴ Momentum: RSI below 50, MACD negative, ADX >25 = sellers in control;
∴ Capital flows: MFI <50, OBV falling = distribution not yet exhausted;
∴ Only counterpoint: Stoch RSI oversold; potential for technical bounce, not structural reversal.
✴️ Conclusion: The battlefield is 0.382 Fib ($108k). Bulls must reclaim $111k -> $113.4k to neutralize; failure drags price toward ($104 / 103k). Logic sealed.
⊢
∫ II. On-Chain Intelligence - (Source: CryptoQuant):
▦ Exchange Inflow Total + EMA9 - (All Exchanges):
∴ Current inflow readings remain low-to-moderate, no spikes comparable to 2022 capitulation phases (>200K BTC);
∴ EMA9 of inflows trending stable/declining since Q2 2025;
∴ Lack of exchange deposits suggests no broad panic selling.
✴️ Conclusion: Inflows do not confirm capitulation; sellers are present but not aggressive. Logic sealed.
⊢
▦ Historical Context:
∴ Spikes above ~150K BTC inflow (e.g. 2022–2023) correlated with sharp price drawdowns;
∴ 2024–2025 shows inflows mostly <50K BTC/day, even during corrections;
∴ Current cycle corrections appear orderly rather than panic-driven.
✴️ Conclusion: Current inflow regime supports controlled distribution, not mass liquidation. Logic sealed.
⊢
▦ Liquidity Implications:
∴ Absence of exchange inflow surges implies supply pressure limited to tactical sellers;
∴ On-chain wallets continue holding, whales not rushing coins into exchanges;
∴ Technical breakdowns (EMA clusters, Fib 0.382) would require derivative/liquidation cascades rather than spot-led panic.
✴️ Conclusion: Structural downside must be driven by futures leverage, not spot panic flows. Logic sealed.
⊢
𓂀 Stoic-Structural Interpretation and On-Chain Oracle:
∴ Structure: EMA stack inverted; Fib 0.382 ($108k) = present bastion; EMA200 ($103k) = macro citadel;
∴ Momentum: RSI, MACD, ADX in alignment with descent, affirming stoic acceptance of downward will;
∴ Capital Flow: OBV and MFI declare liquidity leaving, distribution sealing bearish fate;
∴ Oracle: Oversold Stoch RSI whispers of fleeting respite, not salvation;
∴ Structure of Flow: Unlike past cycles, inflow discipline holds; coins remain largely in cold storage;
∴ Momentum of Will: Market decline is technical, not yet forced by whales. Bears act by structure, not by panic;
∴ Fate of Distribution: Without inflow surges, spot-driven capitulation remains unlikely; path to $103K relies on derivative liquidation.
⊢
✦ Structure Thus:
∴ The market embodies stoic compression;
∴ Only a reclaim >$113.4k reopens neutrality;
∴ Loss of $108k pulls destiny to ($104 / 103k);
∴ Fate sealed in bearish compression, awaiting expansion - logic sealed;
∴ On-chain inflows confirm the absence of mass panic;
∴ Technical charts dominate destiny;
∴ Bears have structure, but not yet blood;
∴ Bulls retain a chance if they defend $108K with low inflows sustained.
⊢
⚚ Unified Insight (Technical + On-Chain):
∴ Technical: Bitcoin clings to Fib 0.382 ($108K); failure = ($104 / 103K). Momentum + OBV favor bears.
∴ On-Chain: No whale capitulation; inflows remain muted, meaning downside is not spot-led.
✴️ Consequence: If inflows stay low, bulls may engineer a bounce at $108K -> $111K. If derivatives trigger cascade, EMA200 ($103K) becomes the stoic fortress.
⊢
· Cryptorvm Dominvs · MAGISTER ARCANVM · Vox Primordialis ·
· Dominivm Cardo Gyratio Omnivm · Silence precedes the next force. Structure is sacred ·
⊢
BTCUSD Short Opportunity, Bears Take Control BTCUSD is currently trading around 116,980, facing strong rejection near the 117,200–117,500 resistance zone. The recent price action suggests that sellers are gaining control as bullish momentum fades. A sustained move below 116,800 could trigger further downside pressure, pushing Bitcoin toward 115,500 and 114,800 in the short term. If the bearish structure remains intact, the next major target lies near the psychological level of 110,000, which aligns with previous demand zones and a key Fibonacci retracement level. Stop-loss should ideally be placed above 117,600 to protect against any false breakouts. Watch for increased volatility during US trading hours and upcoming macroeconomic data releases, as these could accelerate the move. Overall bias remains strongly bearish as long as BTC trades below 117,500.

$BTC: -$4000 in 10min – panic or opportunity?Here's our take:
🔹 Historically, such sharp CRYPTOCAP:BTC drops used to cause -20% to -40% crashes in altcoins.
Now, some alts are holding, others correcting mildly, and a few are even rallying.
🔹 In the last 24 hours, $840M was liquidated.
Roughly 80% were long positions.
Historically, reversals often start after $1.1–1.3B in total liquidations.
🔹 BTC Dominance (BTC.D) and Tether Dominance (USDT.D) are forming readable, consistent patterns.
👉 Current thesis: OKX:BTCUSDT will likely continue its movement inside the falling purple channel.
If price reaches $107–108K, we’ll consider closing our short bot to reassess market conditions.
💬 What’s your perspective? Share below.
______________
◆ Follow us ❤️ for daily crypto insights & updates!
🚀 Don’t miss out on important market moves
🧠 DYOR | This is not financial advice, just thinking out loud.

Bitcoin SOPR #3- Quick Update.
- Everything is in graphic.
- Check SOPR + Green Circles.
- Did some smart hands took their benefits ?
- Yes.
- Does it means BTC price will crash ?
- No.
- Does it means we are in a correction ?
- Not really.
- Does it means it's a boring phase ?
- Yes.
Happy Tr4Ding !

BTC/USD – H1 Trading Plan | Key Levels in FocusBitcoin is still trading within a clear downtrend under the H1 descending trendline. After the recent drop, price is consolidating around short-term equilibrium zones, setting up potential sell continuation setups while leaving room for a possible short-term bounce from demand areas.
📊 Technical Outlook
113,393 → Key resistance (confluence of supply + descending trendline).
111,407 → Short-term support, could provide a reaction.
108,793 → Major demand zone, critical for potential bullish bounce.
📝 Trading Scenarios
Scenario 1 – Sell the pullback (Primary Bias)
Entry: 113,000 – 113,400
Stop Loss: Above 114,000
Targets: 111,400 → 110,000 → 108,800
Scenario 2 – Buy from demand (Countertrend idea)
Entry: 108,800 – 109,000
Stop Loss: Below 108,300
Targets: 110,500 → 111,400 → 113,000
⚠️ Risk Notes
Main trend remains bearish – buy setups are only for short-term retracements.
A clean breakout above 113,400 may shift structure, opening the way towards 115,000+.
H1 may create false signals; wait for confirmation from price action before executing trades.
👉 What do you think? Will BTC continue its drop towards 108,800 📉, or will buyers defend demand and push for a rally back above 113k 🚀?

ALTSEASON TIME (PART2)Hello friends
In the previous post, we talked about Ethereum dominance and altcoins, now we need to take a look at Bitcoin dominance.
Well, you see that the channel we had was broken and now there is a very important number for us, which is the support number 54. If the number 57 is broken, we can reach the number 54, and if we reach this number, we will go for lower numbers. This will cause the growth of Ethereum and altcoins.
Keep in mind that support 54 is a very important support and they tried to break it before but failed, so our key support is this number and we should pay attention to it.
*Trade safely with us*

BTC Breakout Watch🚨 BTC Breakout Watch
Massive volume spike. Clean breakout. Now it’s all about follow-through.
📍The Alpha View:
In the 1/2 hour, these levels matter:
✅ Above Green Line→ Bullish🐂
🟡 Above Yellow Line → Cautiously Bullish
🟨 Below Yellow Line → Cautiously Bearish
😡Below Red Line → Bearish 🐻
This is where momentum decides who owns the next move — bulls must hold the line, or it’s just another fakeout in disguise.
➼Stay Sharp. Stay Disciplined. Stay Ready.

BTCUSD Short: Targeting Channel Support at 107800Hello, traders! The price auction for BTCUSD has been clearly contained within a descending channel for an extended period. This bearish structure was established by key pivot points that defined the upper supply zone near 117350 and the lower demand territory. Since the formation of this channel, every rally attempt has been met with significant selling pressure from the supply line, consistently confirming that sellers are in control of the dominant trend.
At present, the price has completed another impulsive move downwards within this structure. BTCUSD is now trading at a critical juncture, directly testing the major horizontal demand level at 111000. The market is currently pausing at this support, which represents the upper boundary of the wider 111000 - 110300 demand area, a key battleground for market participants.
The working hypothesis is a short continuation scenario. It is anticipated that after a brief dip into the demand area, a minor corrective bounce may occur. However, this rally is expected to fail, with sellers reasserting control. This failure would confirm that the bearish momentum remains dominant, setting the stage for the next leg down. The take-profit is therefore set at 107800 points, targeting the lower demand line of the channel. Manage your risk!

Bitcoin Profits Hit 2-Month Low, How Are Investors Reacting?BINANCE:BTCUSDT current price is $111,653, falling through the $112,500 support level. This zone has held strong since early August, offering a key buffer against deeper losses. For now, price action shows consolidation rather than collapse.
In the span of one week, BINANCE:BTCUSDT profits have declined sharply, hitting a two-month low. The price drop has pushed several addresses out of profit, reducing overall realized gains. Such drawdowns often follow overheated conditions, which may have marked a recent market top.
Given the current sentiment and net accumulation, BINANCE:BTCUSDT could see a bounce to $115,000 . If buying pressure increases and macro support builds, BTC might stabilize above this resistance. Alternatively, it may continue to trade sideways between $112,500 and $115,000 until clarity returns.
However, if accumulation slows and selling resumes, BINANCE:BTCUSDT may drop to $110,000. A move this low would mark a near two-month bottom and could expose BTC to increased downside risk.

BITCOIN MASSIVE CRASH TOWARDS $44K JUST STARTED!!!? (warning) Yello Paradisers!
In this video, I'm sharing with you the CME futures gap that we have created and what needs to be done to close it. On the ultra-high time frame, I'm sharing with you the bearish cross. We are shifting our focus afterward to the high time frame where I'm seeing the bullish divergence. I'm telling you where the daily candle cannot close.
Then, we move our focus to the medium time frame, where I'm sharing with you the RSI bullish divergence plus the support. On the lower time frame, we will look in the next video.
Paradisers! Keep in mind to trade only with a proper professional trading strategy. Wait for confirmations. Play with tactics. This is the only way you can be long-term profitable.
Remember, don’t trade without confirmations. Wait for them before creating a trade. Be disciplined, patient, and emotionally controlled. Only trade the highest probability setups with the greatest risk to reward ratio. This will ensure that you become a long-term profitable professional trader.
Don't be a gambler. Don't try to get rich quick. Make sure that your trading is professionally based on proper strategies and trade tactics.

Bitcoin Weekly NEOWAVE AnalysisBitcoin appears to be nearing a potential major market top. Since its breakout in October 2024, price action has been unfolding as a Running Contracting Triangle with clear alternation. Once this triangle completes, the thrust should resemble the magnitude of Wave A’s rally, though not necessarily replicate it in form. At this stage, Wave E cannot yet be confirmed as complete; however, a decisive break below Wave D would strongly suggest that the top is in place.

BTC adjusts down, market suspects interest rate cut💎 BTC PLAN UPDATE – Early Week (08 / 25 )
🔎 BTC Analysis
After retesting the 117k resistance zone (117,566 USD), the price reacted with a sharp drop. This indicates that the selling pressure in this area remains very strong.
Currently, the price is falling near the EMA200 (red line ~111,664) – which is a key short-term support level.
📌 Key Reaction Zones
111k – 110k:
This is the confluence of EMA200 + Fib 0.5.
If the price holds, there’s potential for a rebound back to 113k–115k.
109k – 108k:
Next strong support.
If 111k breaks, this zone will be the next critical reaction point.
105k – 104k:
Major long-term support (confluence of Fib extension + old demand zone).
In a bearish scenario, the price could test this zone before bouncing back up.
🌐 Market Sentiment & Expectations
After BTC was rejected at 117k, market sentiment has turned cautious and somewhat bearish in the short term.
However, many traders still expect BTC to hold above the EMA200 to trigger a rebound → if this level holds, sentiment may shift back to bullish, targeting 115k–117k again.
On the contrary, if the price breaks deep below 110k, the market may enter short-term panic and shift focus toward the strong support at 104k.

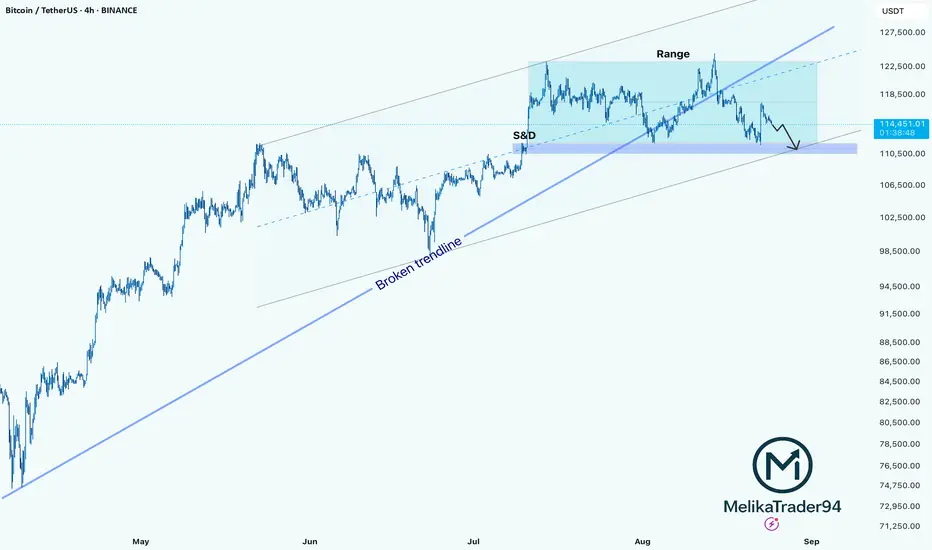
BTC Testing Key Demand Zone After Range BreakdownHello guys!
Bitcoin has been trading inside a clear range after breaking the previous trendline.
We had a Supply & Demand (S&D) reaction at the range’s beginning, and price is now moving lower after failing to hold above the broken trendline.
Currently, Bitcoin is approaching the demand zone (highlighted in blue). If price respects this area, we could see a bounce. Otherwise, a breakdown could trigger further downside movement along the lower channel.
For now, the bias remains cautious, watching how the price reacts to the 111,000–112,000 USDT zone will be key.
BTC/USD Bearish Retest Setup – Eye on 106.6K TargetTrend: BTC is in a downtrend channel (rejection line above, support line below).
EMA Signals: Price is trading below EMA 70 & EMA 200 → bearish bias remains strong.
Supply & Demand:
Support zone: around 112,000 – 112,500 (price just bounced).
RBR Supply zone: 114,300 – 116,000 where sellers are likely waiting.
📊 Strategies in play
Support–Resistance: Bounce at support, retest expected at supply zone.
EMA Strategy: Bearish since candles trade under 200 EMA.
Break & Retest: Price could retest supply before resuming drop.
Target Projection: If rejection at supply holds, target = 106,600 zone (chart target point).
⚖️ Risks
A clean break above 116,000 would invalidate bearish setup and open room for reversal.
Range trading possible between 112k–116k before breakout.
✅ Summary: BTC short-term bias remains bearish. Expect retest of 114.3k–116k supply before continuation lower toward 106.6k target. Only a strong breakout above 116k flips the trend bullish.

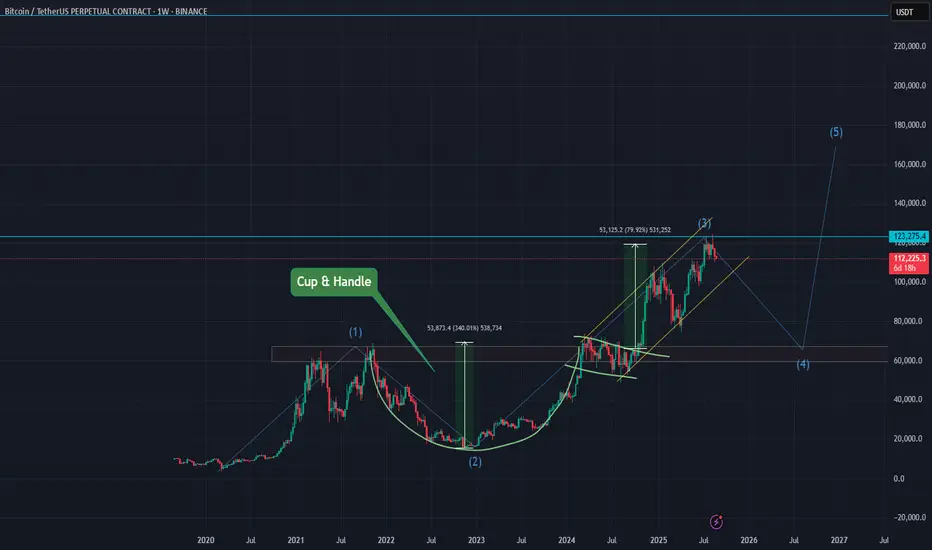
BTC Update – Wave (4) Unfolding as Expected Description:
In my previous idea, I mentioned that the cup & handle pattern had already completed and BTC was likely entering wave (4) after topping near $123K in wave (3).
We are now seeing the correction phase begin exactly as anticipated. Price has rejected from the $123K resistance and is moving down, confirming the start of wave (4).
Key Points:
Cup & Handle breakout is complete.
Wave (3) top formed near $123K.
Wave (4) correction in progress — possible retrace into the $60K–$70K zone.
After consolidation, wave (5) could take BTC to new ATHs beyond $160K.
Patience here is key — this corrective wave is healthy before the final push.
Not financial advice.
BTC recently broke through the descending channel Market picture and sentiment
The price is trading around $114,942, down slightly by about -0.65% on the day. Daily range: high - $115,833, low - $114,583.
The medium-term and long-term trend remains bullish, supported by large capital infusions (ETFs, institutional purchases).
Bernstein analysts suggest that the current bull rally could last until 2027, which is significantly different from the usual four-year cycles.
Support and resistance levels
Resistance:
The nearest zone is $120K-121K, where growth was expected to slow and consolidation.
The long-term target is $135K, and even $150K by 2026, according to analysts' forecasts.
Support:
Multiple bounce point at $110K–112K is critical to maintain bullish momentum.
Nearest technical support at $111.9K, followed by $107.4K and $105.2K.
Technical Momentum and Structure
Consolidation is seen around $113.8K, with volumes rising (to $48B), signaling pent-up interest despite short-term fatigue.
BTC recently broke out of its downward channel, a positive sign. RSI remains favorable, and declining balances on platforms indicate institutional accumulation.
A breakout of $114K could trigger upside potential to $143K (25%) and further to $200K, according to Rosenberg Research.

BTC: Trend or Trap? A Deep Dive AnalysisDisclaimer: In the past, my analyses have frequently deviated due to the erratic movements of BTC whales. Therefore, I advise you to read this study not as investment advice, but purely as a technical explanation.
With growing institutional interest in BTC (ETFs, corporate investments, etc.), I hope it will gain more stable potential. For this reason, I expect it to exhibit fewer "erratic" movements and become more predictable compared to the past. However, the manipulative strategies of large investors, whom we call "whales," have always been devastating for retail investors. Still, money talks, and we can't predict how whales will move. When taking a position, if you are not a large investor, I recommend you never forget that you are a small fish.
With the hope of long-term stability supported by ETFs and institutional investors, we can begin to examine BTC using classic technical tools.
When we look at the monthly timeframe over a wide period, a typical Elliott Wave structure stands out:
In compliance with all impulse rules, I believe BTC is about to complete the 5th wave. But when we look at the momentum oscillators, do they confirm this 5th wave?
Looking at the RSI value, while the price makes a new high, the RSI has formed a lower high. This indicates a bearish divergence.
If we were to check for a signal of a trend reversal or a decrease in wallet data:
Neither the wallet data nor the transaction volumes show an outlook that supports the chart's positive sentiment. Based solely on this data, it's plausible to say that a downtrend might begin.
I recommend that instead of immediately interpreting upward breaks at these levels as a "bull trend," you should first confirm whether it's a fakeout.
Volume and money flow indicators are signaling a clear lack of interest, consolidation, and energy accumulation. This environment provides a very suitable ground for a potential climactic volume. The longer the consolidation and low volume, the more violent the subsequent move can be.
Here too, the negative divergence is clearly visible.
In summary: Although the market appears strong and healthy from the outside, it is exhibiting an uptrend that is running out of energy from the inside. The record-breaking prices are creating a dissonant picture with the decreasing money flow and weakening volume momentum. This increases the probability that the trend is not sustainable and may soon experience exhaustion, a correction, or a reversal.
The ADX shows that the trend still maintains its strength.
The Aroon indicator signals that buyers remain strong while sellers continue to weaken.
When we include the Bollinger Bands and Keltner Channel, an interesting picture emerges:
Price-Volume-Momentum indicators → signal risk.
ADX, Aroon, Bollinger, and Keltner → suggest the trend remains strong.
As I said at the beginning, BTC has always had its "erratic" movements. We can interpret this contradiction as the schizophrenic behavior of an "anarchist" asset.
In short, in my opinion, the trend is not strong; on the contrary, it is weakening, and the chart does not fully reflect reality. However, we cannot say that the trend is completely over either. In a trend that seems to be forcing its way up, avoiding FOMO (Fear Of Missing Out) would be the wisest strategy.
Strategy and Risk Management
If you open a short position, you risk getting caught in a climactic volume, which is highly risky.
If you open a long position, you might find yourself falling off a cliff on the back of the trend after the final surges.
Therefore, what will protect you more than my or any other analyst's comments are your own stop-loss and take-profit strategies.
If the price moves upward contrary to my expectation, your loss would actually be "a profit you never had." However, if you remain in a trend that is about to fall, you are risking your existing capital. That is the real danger.
Always act based on your own observations; do not invest based on rumors. Proceed by taking minimum risk.
A potential M-Top (Double Top) formation is visible, nearing completion within the Bollinger and Keltner channels. The steps of the candle spikes on the band ("walking the bands") are clearly evident.
You can confirm whether the M-Top will complete—and whether it is truly an M-Top—with a monthly close below the current candle's low. If the closes extend down to the Bollinger Band (BB) midline, the possibility of the uptrend reaching figures like 160k–200k–300k would be eliminated, at least for this season.
For those willing to take risks:
It might be logical to determine a position at levels where the BB midline acts as support during the corrective moves that follow this close.
In a continued decline, the loss would be minimal.
In a newly emerging trend, maximum profit could be captured.
Indicators can be misleading when prices are at their peak. That's why I tried to interpret the indicators on the monthly period, as it is less prone to manipulation.
In terms of chart and candle patterns, my first impression on the monthly chart is these two candles, which I believe will form an Evening Star formation.
Before pointing to this formation, I want to draw attention to the harmonic pattern that the candle I suspect will form the Evening Star is drawing on the weekly timeframe.
If we assume that the yet-to-be-completed D-leg of the weekly harmonic pattern (which is forming within the monthly Evening Star) will find support at the Fibonacci 1.27 - 1.24 levels, in alignment with past accumulation zones, we can expect a chart like this to emerge in the coming weeks:
This means we could expect a resistance test between 132K and 127K on the retest of the harmonic pattern. If the simulation I've tried to draw materializes in line with technical measurements, the monthly Evening Star candle formation will also have been completed, thanks to the fractal harmonic pattern.
This would provide a confirmation that we can combine with many other patterns like the hanging man, double top, bull trap, etc.
Literally, this formation is expected to cause a decline. In that case, it could be a formational confirmation that substantiates the explanations we mentioned in the indicators section, such as climactic volume and fakeouts.
Of course, what I have said are inferences based on existing structures that have not yet occurred. This is a simulation graphic. I am trying to catch nascent formations to provide a perspective on potential future scenarios.
As we continue to simulate formations on the monthly period, another harmonic pattern, consistent with our previous measurements and analysis, can give us an idea about old supply zones.
The harmonic pattern above is the main pattern that encompasses the Evening Star and double top formations. In a way that supports the signals from indicators and oscillators, it can inform us about the support zones where prices might retreat.
Looking back, we can also see chart formations that literally told us the levels today's prices might reach.
When we depict the all-time price movements within a Fibonacci channel on the weekly timeframe, the all-time accumulation zones become apparent. Based on this channel data, we can predict that a potential retest could occur slightly below the 90K levels.
If, contrary to our expectations, prices form a new upward trend, I believe a new trend channel will form after the 140K levels by following this channel.
Note: This analysis is for informational purposes only and does not constitute investment advice.
