$BTC to 108k easily....should have bought BTCZ on Friday!I've been trying to warn folks months, weeks, and days ago about this and it's quickly unraveling. History may not repeat itself, but it rhymes and BTC is whistling all the way down the next support level of 108k then 100k, then 70k"ish." BTC correlates with Nasdaq and many companies are not doing well and the economy is doing worse than reported figures. If you're holding, let it go before you are left with worthless digital coins. Every major technical indicator shows weakness and history has not been kind to BTC (major drop to follow after ATH).
Best of luck out there!
Btcusdanalysis

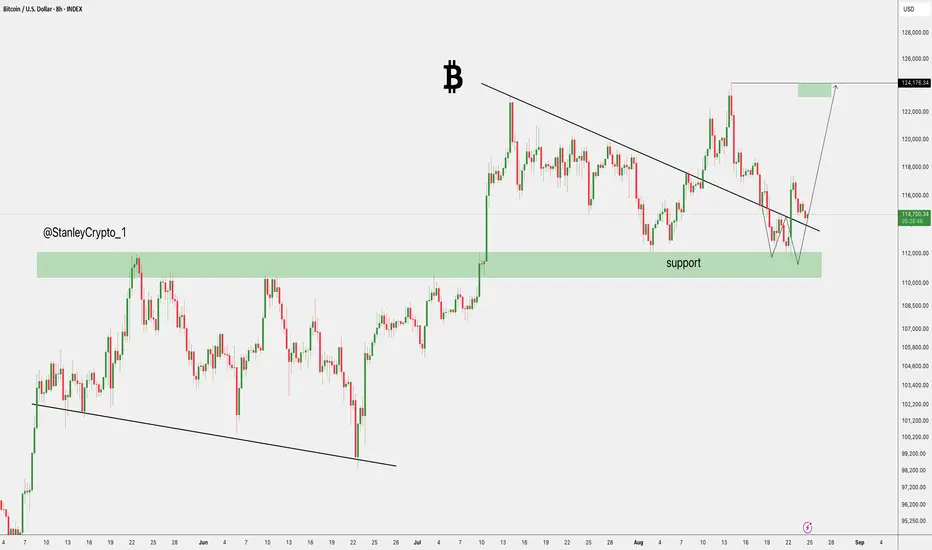
$BTC Looks Ready to Break OutCRYPTOCAP:BTC is holding steady above its support zone and showing signs of breaking out of the downtrend.
If it holds this momentum, a move toward the 124,176 level could be on the table, keeping the bullish setup alive.
DYOR, NFA
$BTC (BITCOIN) 1H UpdateBTC is retracing after the sharp move up, now hovering just above 113,800 support. A liquidity sweep into 112,800–113,200 could set the stage for the next leg higher.
Once demand kicks in, the upside target sits near 117,300–117,600 to complete the measured move. Patience until the sweep confirms.

BTCUSD LongBitcoin: Small Bull Flag After Structural Shift – Upside Targets Ahead
After last Friday’s bullish surge following Powell’s speech, Bitcoin has shifted structure and is currently consolidating in a small bullish flag. This pullback appears to be a healthy retracement of the previous impulsive move, setting the stage for another potential leg higher.
Key Levels to Watch:
Immediate Retracement Zone: $45,100 – a potential area to seek new long positions if price dips.
Upside Targets: Looking for a move first toward $117 (likely referring to $117K if BTC breaks ATHs), with an extended upside potential to $123K–$124K.
Macro Tailwinds:
The broader crypto market remains constructive. Expectations of interest rate cuts are fueling risk-on sentiment, which could further enhance upside momentum in crypto assets. Any confirmed dovish pivot or macro easing could accelerate flows into Bitcoin and the wider crypto space.
Trading Plan:
Watch for continuation patterns breaking to the upside, confirming the bull flag resolution.
Manage risk around invalidation zones below recent swing lows.

#Bitcoin Bearish Setup: $BTC is facing heavy resistance at 120k#Bitcoin Sunday Update Bearish Setup:
CRYPTOCAP:BTC is facing heavy resistance at the long-term trendline (around 115K–120K). Volume is dropping, a double top has formed, and retail entries are clustered above 110K–120K, creating a strong trap.
🔸 Support 93K–95K:
This aligns with the CME gap, weekly EMA50 retest, and liquidity pool. Market makers likely drive price into this zone to flush weak hands before the next leg higher.
🔸 Upside Target: 135K–150K (after correction)
Once the correction plays out and retail gets washed out, BTC is expected to resume its bullish cycle and push into new highs.
🔸 Risk Level at 124K:
A clean weekly close above 124K with strong spot demand would invalidate the short-term bearish thesis.
🔸 Outlook:
Short area remains 110K–124K. Best strategy is gradual profit-taking on spot and step-by-step short positioning until the correction into 90–95K plays out. Reload lower for the next bullish leg.

Bitcoin – Medium-Term AnalysisBitcoin – Medium-Term Analysis
Hello traders,
BTC made a strong breakout recently, reacting precisely at the 117k level as anticipated. At the moment, price is undergoing a correction, clearing liquidity from last Friday’s bullish candle. The firm rejection at 117k suggests we should reassess the medium-term structure.
The main scenario still favours the upside. The 113.4k zone is an attractive level for long entries, as buyers previously dominated this area and short-side liquidity remains in play. From a market psychology perspective, this could trigger short covering and push price towards 115.7k. A confirmed break above 117k would strengthen the medium- to long-term bullish outlook, opening the way for further long positions.
Alternatively, if price reacts lower from 115.7k, it may offer a medium-term short opportunity. Should support at 111.7k give way, BTC could extend down to 110k, a level that has seen multiple strong rejections in the past and could provide a solid base for renewed long positions.
This outlook is guided by support/resistance dynamics and major liquidity zones. Always trade with discipline and keep risk management as your priority.
What’s your perspective on BTC right now? Share your thoughts in the comments so we can refine our strategies together.

Dark / UsdtGATEIO:DARKUSDT
Dark holding it's support area It will explode soon.
Disclaimer : Not financial advice..

Will a Fed Rate Cut Cause Bitcoin to Fall? A Look at the Market'As September approaches, the financial world is on high alert for the next Federal Reserve meeting. After a period of high inflation, the Fed has been holding interest rates steady, but recent comments from Fed Chair Jerome Powell have raised expectations for a rate cut. While many might think a rate cut is great news for risky assets like Bitcoin, the reality is more complex. The market's reaction could be a classic case of "buy the rumor, sell the news."
The "Buy the Rumor, Sell the News" Effect
For months, traders have been speculating that the Fed would eventually cut rates. This anticipation has already been a major factor in the recent rally of Bitcoin and other cryptocurrencies. When investors believe that borrowing money is about to get cheaper, they are more willing to move their money out of safe investments, like government bonds, and into riskier assets that have the potential for bigger gains. This is a key reason why Bitcoin has been performing well.
However, this is where the risk lies. The market has likely already "priced in" a September rate cut. This means that the current high price of Bitcoin already reflects the expectation of this event. When the Fed actually announces the cut, there may not be a new reason for the price to go up. In fact, many traders who bought in anticipation of the news might decide to sell their holdings to lock in their profits, causing a short-term drop in price. This is a common pattern in all financial markets.
Looking at the Broader Picture
While a rate cut is generally seen as a positive for Bitcoin in the long run, the short-term impact is not guaranteed to be a straight shot up. The Fed's decision is just one piece of the puzzle. Other factors that could influence Bitcoin's price include:
Inflation: The Fed's main job is to control inflation. If inflation remains stubbornly high, the Fed might signal that this is the only rate cut for a while, which could dampen market enthusiasm.
Economic Outlook: If the Fed cuts rates because the economy is showing signs of weakness, investors might pull back from all risky assets, including Bitcoin, out of fear of a recession.
Regulatory News: Any new regulations or statements from governments about cryptocurrencies could also cause a significant market reaction, regardless of what the Fed does.
⬇️ Sell now or sell on 115669.0
⭕️SL @ 116080.0
🔵TP1 @ 113449.0
🔵TP2 @ 111600.0
Risk Warning
Trading Forex, CFDs, Crypto, Futures, and Stocks involve a risk of loss. Please consider carefully if such trading is appropriate for you. Past performance is not indicative of future results.
Conclusion: Caution is Key
For traders and investors, the key takeaway is to approach the upcoming Fed meeting with a healthy dose of caution. While a rate cut is widely expected, it's not a guaranteed path to higher prices. The smart move is to understand the different scenarios and not to get caught up in the hype. Bitcoin's price has already been influenced by the rumors of a rate cut. The actual announcement could very well lead to a period of volatility and even a temporary pullback as traders take profits.
If you liked our ideas, please support us with your likes 👍 and comments.

BTC OUTLOOKWith price taken out liquidity, this could only mean one thing for sellers to come in once supply is validated at 122,800.
There’s also chance for buyers at demand at 113,000 after minor structural phase shift for a potential retracement to 122,800.

Bitcoin Eyes $100K Re-Entry: Retest, Support Zone,Then Push 130kChart Analysis
1. Price Structure & Trendlines
The chart displays a former upward trendline that has been broken, leading to a corrective pullback.
Following that, price is perched within a “retest zone” (the red-shaded rectangle), which aligns with both historical horizontal resistance—now turning into support—and an area of previous consolidation. This is a classic setup: price often retests key breakout levels before resuming its move.
2. Support Levels
The main support is clearly drawn around the $100K zone, highlighted by a grey bar below the retest zone. This is a psychological and structural area to watch for potential strong buying.
Immediate support appears near $110K–$112K, as noted by the lower edge of the red retest area—this zone has shown to catch corrections before in technical analysis and news reports
AInvest
Mudrex
Barron's
.
3. Resistance & Upside Targets
If the retest holds, the chart charts a potential bounce toward the upper rising trendline and beyond, potentially aiming for the $126K–$130K region, as marked by Fibonacci retracement levels.
This aligns with several external forecasts suggesting resistance or target zones in that range
AInvest
Mudrex
Barron's
.
4. Potential Price Path & Scenarios (Denoted by Red Arrows)
Bearish Scenario: Price may dip down into the retest zone, test support, and—if the breakdown occurs—continue lower toward $100K—a key area of interest.
Bullish Scenario: The support holds, leading to a V-shaped recovery that propels price back above $115K, potentially triggering a rally toward $122K–$130K.
Summary Table
Key Zone / Level Significance & Note
$110K–$112K Critical near-term support; breakdown risks move toward $100K
AInvest
Mudrex
Retest Zone (~$114K–$115K) Area combining horizontal support and trendline; serves as pivot for next move
Mudrex
AInvest
$120K–$123K Major resistance where a breakout could fuel continuation toward $127K–$130K
Mudrex
Barron's
Broader Context & Market Sentiment
Bitcoin is currently consolidating after setting new highs near $124K
MarketWatch
The Economic Times
Barron's
Cointribune
.
Analysts observe that sustaining above the $110K–$112K band is essential to the bullish case; falling below it could invite deeper downside
Barron's
Cointribune
AInvest
.
Conversely, a decisive move above $120K–$123K could validate continuation toward $127K–$130K, and even higher—some forecasts extend to $135K and beyond
Mudrex
Indiatimes
Barron's
CoinCodex
.
Final Thoughts
Your chart beautifully illustrates the classic “retest after breakout” dynamic:
Hold above the retest zone? Look for a rebound toward $120K+, with the potential for a full bullish revival aiming for $130K.
Break below $110K–$112K? Watch for a possible move toward $100K—a critical support level.
Stay alert to macro catalysts too—like Federal Reserve interest rate signals, institutional inflows (ETFs), and regulatory developments—which could steer the next leg substantially

BTC/USD Bullish Breakout Toward 124K🔎 Chart Analysis
1. Support & Resistance Zones
Support Zone: Around 113,600 – 115,000, holding price from further downside.
Resistance Zone: Around 116,000, where price faced rejection previously.
2. Trend Structure
The price has broken out of the descending channel (rejection line & support line).
This breakout suggests a bullish reversal signal.
3. Moving Averages (EMA)
EMA 70 (~115,080) and EMA 200 (~116,182) are converging.
If the price sustains above EMA 200, it will confirm a bullish continuation.
4. Candlestick Price Action
Recent bullish engulfing from support zone strengthens the case for upward momentum.
Consolidation near resistance indicates accumulation before a breakout.
5. Target Projection
If breakout above resistance is successful, target lies around 124,449 – 124,484 (next major resistance level).
📌 Trading Plan (Example)
Entry: Around 115,260 – 115,600 (after confirmation above EMA 200).
Stop Loss: Below 113,600 (support zone).
Target: 124,449 – 124,484.
⚡ Summary
Bitcoin is showing signs of a bullish breakout from a descending channel. If price sustains above the resistance and EMA 200, a strong move toward 124K is likely. The support at 113,600 remains a critical invalidation level.

Bitcoin Outlook – Breakout from the Downtrend ChannelBitcoin Outlook – Breakout from the Downtrend Channel
Hello traders,
BTC has broken out of its descending channel with a strong impulsive candle, in line with the corrective rally scenario. At present, price is reacting around 117k, confirming a clear structural shift. For the medium term, the dominant trend should now be viewed as bullish. Pullbacks towards 114.5k – 113k may provide attractive opportunities to add long positions.
From an Elliott Wave perspective, BTC appears to be in the final ABC sequence. The current leg is wave B, and traders should look to position long as wave C develops.
Upside targets: 120k – 121k, where a mild correction is likely as liquidity is cleared.
This is my personal perspective on Bitcoin. Stay disciplined, monitor price closely, and manage risk carefully.
What’s your outlook on BTC at this stage? Share your thoughts in the comments so we can refine our trading together.
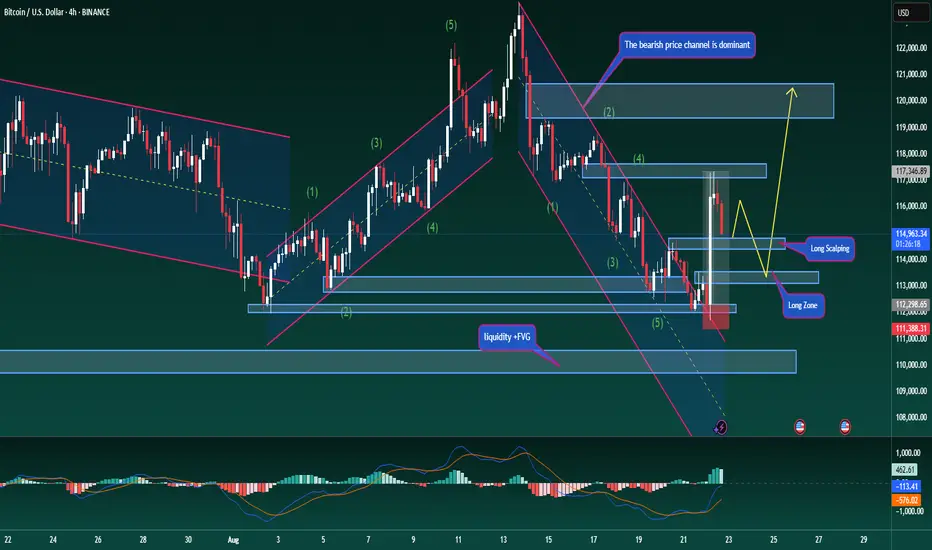
Bitcoin – Medium-Term Outlook for Long/Short TradersBitcoin – Medium-Term Outlook for Long/Short Traders
Hello traders,
BTC continues to respect the descending channel structure. Recently, price bounced strongly from the solid support around 112k, and it is now only about 2k away from the swing long target zone.
If BTC can break above the 114.8k resistance, a short-term reversal could unfold, with potential to extend towards 117.5k before resuming the broader downtrend. This scenario may also act as a trap for those holding longer-term short positions.
The structure is showing early signs of change: price is trading above the descending channel trendline, while MACD indicates rising volume and its moving averages are curving upward. These signals point to a possible corrective rally in the near term.
Strategy: Consider long entries near current levels, with the option to scale in if price breaks 114.8k.
Medium-term short positions from around 115k remain valid, targeting the 110k zone, which could also serve as a new accumulation area.
This is my personal view of the BTC market. Stay disciplined and manage risk accordingly.
What’s your outlook on Bitcoin here? Share your perspective in the comments below.

Bitcoin Explodes to $116,000 After Fed Speech SignalBitcoin Surges Past $116,000 as Federal Reserve Signals Historic Policy Shift
The cryptocurrency market experienced a dramatic reversal of fortune as Bitcoin rocketed past $116,000, recovering from a challenging period that had seen the digital asset touch six-week lows. The catalyst for this remarkable turnaround came from an unlikely source: Federal Reserve Chair Jerome Powell, whose dovish remarks at the prestigious Jackson Hole Economic Symposium sent ripple effects through global financial markets, fundamentally altering the trajectory for risk assets and digital currencies alike.
The Jackson Hole Moment That Changed Everything
In what many market observers are calling a pivotal moment for monetary policy, Jerome Powell delivered a speech that effectively cemented market expectations for an interest rate cut in September. The immediate reaction was nothing short of spectacular. Within minutes of Powell's comments hitting the wires, Bitcoin surged over 2%, climbing from approximately $114,200 to breach the psychologically significant $116,000 level. This rapid appreciation represented not just a technical bounce, but a fundamental reassessment of the cryptocurrency's near-term prospects in a changing monetary environment.
The significance of Powell's speech cannot be overstated. The Jackson Hole Economic Symposium has historically served as a platform for Federal Reserve chairs to signal major policy shifts, and this year proved no exception. Powell's carefully calibrated remarks suggested that the Federal Reserve's aggressive rate-hiking cycle, which had been implemented to combat persistent inflation, might finally be approaching its conclusion. For Bitcoin and the broader cryptocurrency ecosystem, which had struggled under the weight of tighter monetary conditions for much of the past two years, this represented a potential game-changer.
The market's interpretation was unambiguous. Federal funds futures immediately repriced to reflect a 90% probability of a rate cut at the September Federal Open Market Committee meeting, up from roughly 70% before Powell's speech. This dramatic shift in expectations triggered an immediate reallocation of capital across asset classes, with risk assets being the primary beneficiaries and the US dollar experiencing notable weakness.
A Broader Market Rally Takes Shape
While Bitcoin's surge captured headlines, the positive sentiment extended far beyond the cryptocurrency market. Ethereum, the second-largest cryptocurrency by market capitalization, staged an even more impressive recovery, rebounding 8% after having endured a painful 12% correction in the preceding sessions. This outperformance by Ethereum suggested that investors were not merely buying Bitcoin as a hedge against monetary policy uncertainty, but were expressing renewed confidence in the broader digital asset ecosystem.
Traditional financial markets also responded enthusiastically to Powell's dovish pivot. US equity indices gained approximately 1%, with technology stocks leading the advance. The yield on benchmark Treasury securities dropped to 4.27%, reflecting bond traders' expectations for a less restrictive monetary policy stance going forward. Gold, that traditional safe-haven asset and frequent competitor to Bitcoin for investor attention, rose 0.6%, demonstrating that the appetite for alternative stores of value remained robust even as risk sentiment improved.
This synchronized movement across asset classes highlighted an important dynamic that has become increasingly evident in recent years: the growing correlation between cryptocurrency markets and traditional financial assets during periods of significant monetary policy shifts. While Bitcoin was originally conceived as an uncorrelated asset that would provide portfolio diversification benefits, its behavior during major macro events has increasingly mirrored that of other risk assets, particularly growth-oriented technology stocks.
Understanding the Whale Dynamics
Beneath the surface of the price action, on-chain data revealed fascinating insights into how different market participants positioned themselves ahead of Powell's speech. Most notably, Bitcoin whales – entities holding large quantities of the cryptocurrency – had been quietly accumulating during the recent downtrend. According to blockchain analytics, these major holders added approximately 16,000 BTC to their positions during the period of price weakness, suggesting that sophisticated investors saw value at lower levels and were positioning for exactly the type of policy-driven rally that ultimately materialized.
This accumulation pattern by whales deserves closer examination, as it often serves as a leading indicator for future price movements. The fact that these large holders were adding to positions while retail investors were capitulating speaks to a divergence in market sentiment that often precedes significant trend changes. The 16,000 BTC accumulation represents over $1.8 billion at current prices, demonstrating serious conviction among institutional and high-net-worth investors about Bitcoin's medium-term prospects.
The whale accumulation also highlights the maturation of Bitcoin markets. Unlike the wild speculation that characterized earlier cycles, current market dynamics show signs of more sophisticated trading strategies and longer-term investment horizons. These large holders appear to be treating Bitcoin less as a speculative vehicle and more as a legitimate asset class worthy of strategic allocation within diversified portfolios.
The Federal Reserve's Delicate Balancing Act
The enthusiasm surrounding Powell's dovish turn must be tempered with an understanding of the complex challenges facing the Federal Reserve. Some cryptocurrency strategists have sounded alarm bells, warning that a significant Bitcoin surge could potentially clash with the Fed's broader economic goals. If cryptocurrency markets experience excessive speculation leading to wealth effects that stimulate consumer spending, this could complicate the Fed's efforts to bring inflation back to its 2% target.
This concern is not without merit. The cryptocurrency market's total capitalization now exceeds $2.5 trillion, making it large enough to have meaningful macroeconomic impacts. A sustained rally in digital assets could create wealth effects that filter through to the real economy, potentially reigniting inflationary pressures just as the Fed believes it has gained the upper hand in its fight against rising prices. This dynamic creates a fascinating feedback loop where the very monetary policy easing that benefits Bitcoin could ultimately be constrained by Bitcoin's success.
Furthermore, the Federal Reserve must consider the international implications of its policy decisions. A weaker dollar resulting from rate cuts could have significant consequences for global trade and financial stability. Many emerging market economies have dollar-denominated debt, and a rapidly weakening dollar could create challenges for these nations. Additionally, other major central banks might be forced to adjust their own policies in response to Fed actions, potentially triggering a global easing cycle with unpredictable consequences.
Technical Analysis and Market Structure
From a technical perspective, Bitcoin's surge past $116,000 represents a significant development in market structure. The cryptocurrency had been trading in a descending channel for several weeks, with each rally attempt meeting selling pressure at lower highs. The Powell-induced breakout decisively violated this bearish pattern, suggesting a potential trend reversal is underway.
However, technical indicators present a mixed picture that warrants careful consideration. The Bitcoin Bull Score Index, a composite metric that aggregates various momentum and sentiment indicators, has been signaling fading momentum despite the recent price surge. This divergence between price action and underlying momentum suggests that while the immediate reaction to Powell's speech was strongly positive, questions remain about the sustainability of the current rally.
Volume patterns also deserve attention. The surge past $116,000 occurred on elevated but not exceptional volume, suggesting that while there was genuine buying interest, we haven't yet seen the kind of capitulation from bears or FOMO from sidelined buyers that typically characterizes major trend changes. This could mean that the market is still in the early stages of processing the implications of the Fed's policy shift, with more significant moves potentially ahead as participants fully digest the changing macro landscape.
Support and resistance levels have also shifted following the breakout. The $114,000-$115,000 zone, which previously acted as resistance, should now serve as support on any pullbacks. Above current levels, the next major resistance lies around $120,000, which represents both a psychological level and the site of significant selling during previous rallies. How Bitcoin behaves around these key levels in coming sessions will provide important clues about the strength of the current uptrend.
The Broader Implications for Cryptocurrency Adoption
Beyond the immediate price implications, the Federal Reserve's policy shift could have profound effects on cryptocurrency adoption and development. Lower interest rates reduce the opportunity cost of holding non-yielding assets like Bitcoin, making them relatively more attractive compared to traditional fixed-income investments. This dynamic could accelerate institutional adoption of cryptocurrencies as portfolio diversifiers.
Moreover, a more accommodative monetary policy environment could reignite interest in decentralized finance (DeFi) protocols, which had seen diminished activity during the period of rising rates. Lower rates in traditional finance make the yields available in DeFi more competitive, potentially driving renewed capital flows into these innovative financial platforms. This could create a virtuous cycle where increased DeFi activity drives demand for cryptocurrencies like Ethereum, which serves as the backbone for most DeFi applications.
The changing monetary landscape also has implications for central bank digital currency (CBDC) initiatives. As traditional monetary policy tools become less effective in a low-rate environment, central banks might accelerate their exploration of CBDCs as alternative mechanisms for implementing monetary policy. While CBDCs could potentially compete with cryptocurrencies in some use cases, they might also serve to legitimize digital currencies more broadly, ultimately benefiting the entire ecosystem.
Risk Factors and Considerations
Despite the current optimism, several risk factors could derail Bitcoin's bullish momentum. First, the Federal Reserve's commitment to rate cuts is contingent on continued progress in reducing inflation. Any resurgence in price pressures could force the Fed to maintain or even increase rates, potentially triggering another leg down in cryptocurrency markets.
Regulatory risks also remain omnipresent. While the regulatory environment for cryptocurrencies has generally improved in recent years, with the approval of Bitcoin ETFs and growing institutional participation, the potential for adverse regulatory actions remains. Any major regulatory crackdown, particularly in the United States or European Union, could quickly reverse current gains.
Geopolitical tensions represent another wildcard. While Bitcoin has sometimes benefited from geopolitical uncertainty as investors seek alternatives to traditional financial systems, extreme events could trigger broad-based risk aversion that negatively impacts all speculative assets, including cryptocurrencies. The ongoing conflicts in various regions and tensions between major powers create an environment where sudden shocks remain possible.
Technical vulnerabilities within the cryptocurrency ecosystem itself also warrant consideration. While Bitcoin's network has proven remarkably resilient over its history, the broader cryptocurrency space has experienced numerous hacks, exploits, and technical failures. Any major security breach or technical failure could undermine confidence and trigger selling pressure across digital assets.
Market Psychology and Sentiment Dynamics
The psychological aspect of the current rally deserves special attention. After months of ranging price action and failed breakout attempts, many market participants had grown pessimistic about Bitcoin's near-term prospects. The sudden reversal triggered by Powell's speech has likely caught many traders off-guard, potentially setting up a powerful short squeeze as bearishly positioned traders scramble to cover their positions.
This shift in sentiment is already visible in various metrics. Funding rates in perpetual futures markets have turned positive, indicating that traders are willing to pay premiums to maintain long positions. Social media sentiment, as measured by various analytical tools, has shifted from predominantly bearish to cautiously optimistic. The fear and greed index, which had been mired in "fear" territory for weeks, has begun moving toward neutral readings.
However, this rapid shift in sentiment also creates vulnerabilities. Markets that move too far, too fast often experience sharp pullbacks as early buyers take profits and late entrants get shaken out. The key for sustained upward movement will be whether the current rally can attract new capital from investors who have been waiting on the sidelines, rather than simply representing a reshuffling of existing positions.
The International Perspective
The Federal Reserve's policy shift has global implications that extend far beyond US borders. Other major central banks, including the European Central Bank and the Bank of Japan, will need to carefully consider their own policy stances in light of the Fed's dovish turn. This could potentially trigger a synchronized global easing cycle, which would likely be highly supportive for risk assets including cryptocurrencies.
For Bitcoin specifically, international dynamics are particularly important given its global nature. Demand from regions experiencing currency devaluation or financial instability has historically been a significant driver of Bitcoin adoption. If the Fed's rate cuts lead to dollar weakness, this could accelerate Bitcoin adoption in emerging markets as a hedge against local currency depreciation.
The Asian markets, particularly China despite its official ban on cryptocurrency trading, remain influential in Bitcoin price dynamics. Any shifts in Chinese policy toward cryptocurrencies, or changes in how Chinese investors access Bitcoin through offshore channels, could have significant impacts on global prices. The recent rally has already seen increased activity from Asian trading hours, suggesting renewed interest from this important region.
Looking Ahead: The Path Forward
As markets digest the implications of Powell's Jackson Hole speech, the path forward for Bitcoin appears more constructive than it has in months. The combination of potential monetary easing, continued institutional adoption, and improving regulatory clarity creates a favorable backdrop for digital assets. However, the journey is unlikely to be smooth, with volatility remaining a defining characteristic of cryptocurrency markets.
The September Federal Open Market Committee meeting looms large on the horizon. While markets have largely priced in a rate cut, the magnitude of the cut and the Fed's forward guidance will be crucial in determining whether the current rally has legs. A more aggressive easing stance than currently expected could propel Bitcoin toward new all-time highs, while a more cautious approach might lead to some near-term disappointment.
Beyond monetary policy, several other catalysts could influence Bitcoin's trajectory in coming months. The continued development of the Lightning Network and other scaling solutions could enhance Bitcoin's utility as a payment method. Growing environmental consciousness and Bitcoin mining's increasing use of renewable energy could address one of the persistent criticisms of the cryptocurrency. Additionally, further institutional adoption, particularly from major corporations adding Bitcoin to their treasury reserves, could provide fundamental support for prices.
Conclusion: A Pivotal Moment in Bitcoin's Evolution
The surge past $116,000 following Jerome Powell's dovish signals represents more than just another rally in Bitcoin's volatile history. It potentially marks a pivotal moment in the cryptocurrency's evolution from speculative asset to recognized component of the global financial system. The fact that Federal Reserve policy now has such direct and immediate impacts on Bitcoin prices underscores how integrated cryptocurrencies have become with traditional financial markets.
For investors and observers, the current environment presents both opportunities and challenges. The potential for significant gains exists, particularly if the Federal Reserve follows through with monetary easing and the global economy achieves the sought-after "soft landing." However, the risks remain substantial, and the cryptocurrency market's inherent volatility means that dramatic reversals remain possible.
What seems clear is that Bitcoin has successfully weathered another period of adversity and emerged with renewed momentum. The quiet accumulation by whales during the recent downturn, followed by the explosive response to Powell's speech, demonstrates that demand for digital assets remains robust among sophisticated investors. As the financial world continues to evolve and adapt to technological innovation, Bitcoin's role appears increasingly assured, even if its exact price trajectory remains uncertain.
The coming weeks and months will be crucial in determining whether this latest surge represents the beginning of a new bull cycle or merely another rally within a broader consolidation phase. What is certain is that Bitcoin continues to capture the imagination of investors worldwide, and its correlation with macro policy decisions ensures it will remain at the center of financial market discussions for the foreseeable future. As traditional monetary policy reaches its limits and financial innovation accelerates, Bitcoin stands ready to play an increasingly important role in the global financial ecosystem, with the $116,000 level potentially representing just another milestone on a much longer journey.

BITCOIN PREDICTION: PUMP TO $135K STARTING???! (Buy Now?) Yello Paradisers! In this video, I'm sharing with you the high time frame chart, the double shooting star candlestick pattern, double top formation, bearish divergence that needs to be confirmed, and its channel that we are trying to break to the downside. High time frame chart, I'm sharing with you the ABC zigzag and the potentiality of that C move being already finished. If not, the previous low needs to hold, and we are looking at things on a medium time frame. The bullish things on a medium time frame are the bullish divergence, and on a low time frame chart, the Elliott wave count that seems to be completed to the downside. If the previous low is going to hold, we are starting a new impulse towards $129,000 as a higher degree third wave. Then we will have a fourth wave, and the final fifth wave will take us towards $135,000. Watch the video where I'm explaining all the confirmations and the price action dynamics, and how we will be developing with the highest probability.
Paradisers! Keep in mind to trade only with a proper professional trading strategy. Wait for confirmations. Play with tactics. This is the only way you can be long-term profitable.
Remember, don’t trade without confirmations. Wait for them before creating a trade. Be disciplined, patient, and emotionally controlled. Only trade the highest probability setups with the greatest risk to reward ratio. This will ensure that you become a long-term profitable professional trader.
Don't be a gambler. Don't try to get rich quick. Make sure that your trading is professionally based on proper strategies and trade tactics.

Altseason Checklist! To spot the beginning of an Altseason, there are several key charts you need to track on TradingView. These indicators show whether capital is really leaving Bitcoin and flowing into altcoins.
1. Altseason Starts with ETH
Almost every time, the first signs come from Ethereum (ETH). When ETH gains strength, the rest of the altcoins usually follow.
2. BTC Dominance (BTC.D) ⬇️
Condition: forming Lower Low / Lower High
Interpretation: money is rotating out of BTC and looking for better opportunities in altcoins.
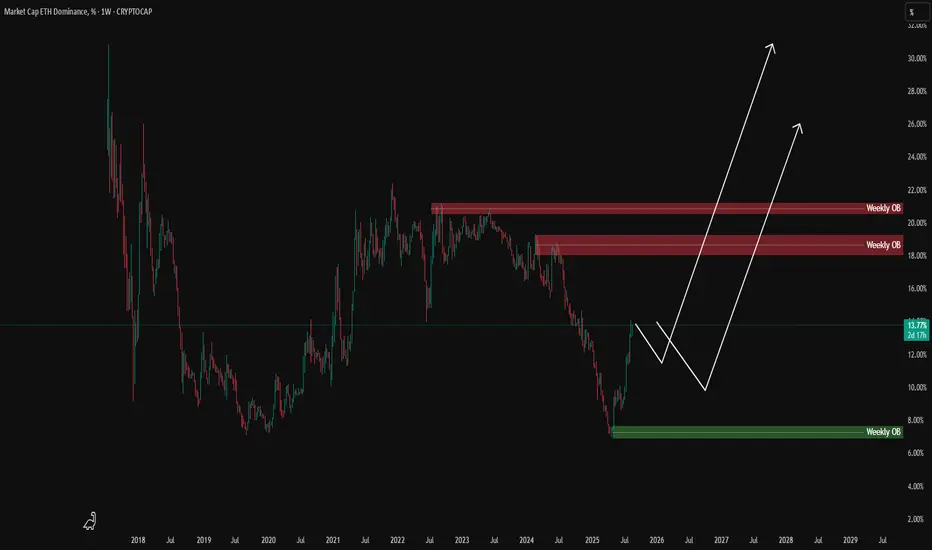
3. ETH Dominance (ETH.D) ⬆️
ETH’s share of the market is increasing.
This shows Ethereum is taking leadership over the flow of capital.
4. ETH/BTC Pair (ETHBTC) ⬆️
Key: breakout to the upside with weekly confirmation
This ratio reveals whether ETH is truly outperforming BTC.
When ETHBTC breaks up ⇒ strong trigger for ETH leadership.
5. TOTAL2ES ⬆️
Represents market cap of all altcoins excluding BTC.
Growth here means real money is flowing into alts, not just cycling into stables.
6. TOTAL3ES ⬆️ (with delay)
Represents market cap of all altcoins excluding BTC and ETH.
When this chart starts rising ⇒ after ETH, the rest of the alts join in.
This is usually the final confirmation of Altseason.
7. USDT Dominance (USDT.D) ⬇️ or ↔️
Should move down or at least stay flat.
If it rises too much ⇒ capital is not entering alts, it’s parking in stablecoins ⇒ Altseason trap.
⚠️ Key Note – Watch Out for the Trap
The biggest trap is when BTC.D is dropping and ETH.D is rising, but USDT.D is also climbing.
That doesn’t mean Altseason – it means money is leaving BTC but hiding in stablecoins instead of flowing into alts.
📌 Summary:
Starts with ETH
Confirm with BTC.D ⬇️, ETH.D ⬆️, ETHBTC ⬆️
Money entering alts ⇒ TOTAL2ES ⬆️
Expansion to full alt market ⇒ TOTAL3ES ⬆️
Watch USDT.D to avoid the trap.
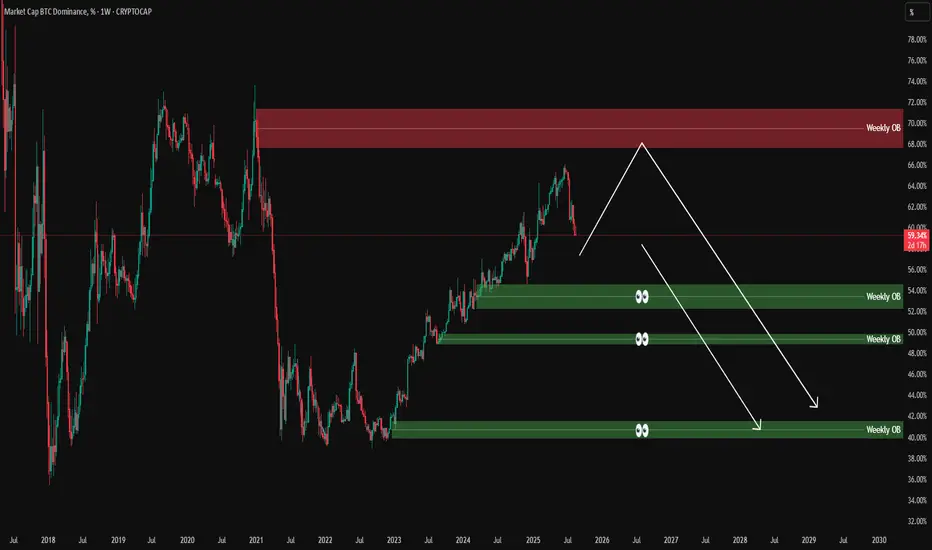
BTC Dominance analysis – 1W OB & Market Structure/ AltseasonOn the weekly chart, Bitcoin dominance has rejected from the 70% Weekly OB supply zone and is now pulling back.
We currently have three major Weekly OB demand zones below:
54–55% OB
48–50% OB
40–42% OB
Possible scenarios:
1️⃣ A temporary bounce before continuation lower.
2️⃣ A steady decline into one of the OB zones (50% or 42%).
3️⃣ A strong breakdown below 50%, signaling a deeper shift in market structure.
⚡ Key Altseason Signal: If this decline in BTC dominance happens while Ethereum’s price rallies in Daily or Weekly timeframe, it will be a strong confirmation of the start of Altseason, with ETH leading and alts following aggressively.
📊 ProfitaminFX | Gold, BTC & EUR/USD
📚 Daily setups & educational trades
BTC last few movesJust for my haters
what and when BTC will do
From end of Aug or beg of Sept we gonna pump till 24 +-few days of September
From 1st week of november - DIP till end of November/beg of December! (altcoins even longer will go down till 10-12 of Dec)
From there one last pump till end of Jan 2026

Feeling the charts, forecast for August 22, 2025.
I am engaged in the extrasensory of stock charts, that is, the feeling of the energy of the future chart, this is a meditative technique, and the feelings are mainly tactile.
Forecast for August 22, 2025, I have drawn my feelings for tomorrow on the chart - I expect a fall at the very beginning of the day and at the end...
At the moment, I do not analyze the prices, I only pay attention to the price movement impulses. I consider my forecast to be good if the outline of the real chart matches the outline of the chart I drew as a forecast, meaning that the direction and time period of the price movement are correctly indicated.

pullbackI think the next bit will have a correction period and the price will not hold the $120,000 floor.


BTC Short Trade Setup – Bearish Momentum
🎯 **BTC Short Trade Setup – Bearish Momentum**
📌 **Instrument:** BTC
📉 **Direction:** SHORT
💰 **Entry Price:** \$115,200
🛑 **Stop Loss:** \$116,500
🏹 **Take Profit:** \$111,500
📏 **Position Size:** \$5M (1% of \$500M account)
💪 **Confidence:** 65%
⏰ **Timing:** Enter at market open
⚠️ **Key Risks:**
* Market volatility can trigger rapid moves.
* Breakout above \$116,500 invalidates setup.
* Macro correlations may amplify risk.
✅ **Rationale:**
* Lower highs & lower lows = bearish momentum
* Price below key MAs, weakening bullish conviction
* Technical indicators support short entry
🔥 **TradingView / Social Tags:**
\#Bitcoin #BTCShort #CryptoTrading #CryptoAnalysis #FuturesTrading #TechnicalAnalysis #TradingSignals #RiskManagement #MarketAnalysis #CryptoAlerts #HighConvictionTrade #BearishSetup #PriceAction #TradingStrategy #CryptoMarket

Bottom-building stage, waiting for riseYesterday, Bitcoin experienced a minor rebound after testing the support level near $112,000. However, during the early trading session, it fluctuated and declined, erasing yesterday's gains. As shown on the hourly chart, the $112,000 level has proven to be a strong support, having withstood three tests under pressure. Currently, Bitcoin is in a consolidation phase, and once this phase is completed, we can expect a significant upward movement. For those who are bullish on Bitcoin, it is recommended to consider entering long positions around $113,000, with a stop-loss set near $112,000.
