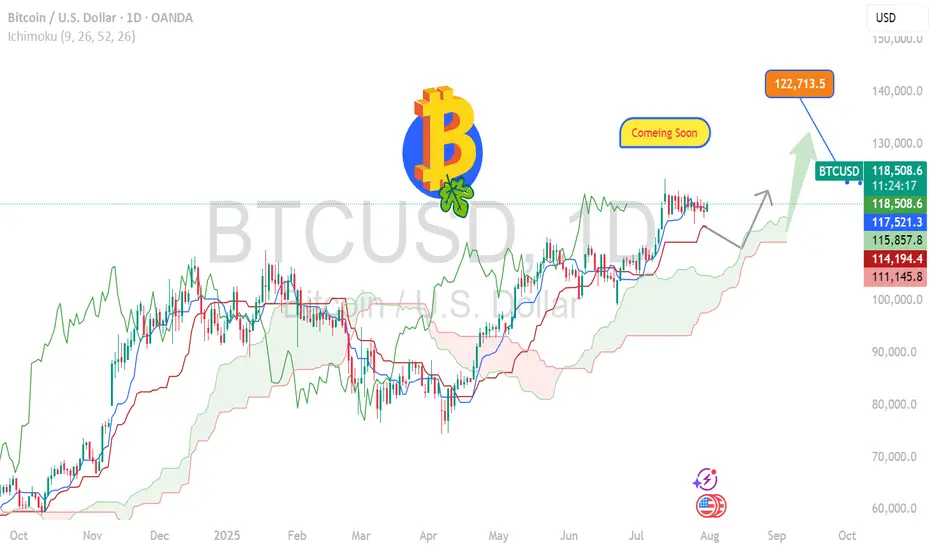
BITCOIN- Charging Towards 122k Momentum Building BTC/USD Long Setup – Targeting 122K 🔥
Bitcoin is holding strong above 118500, signaling bullish momentum.
✅ Price broke key resistance & forming higher lows.
🟢 Current structure favors buy-side continuation with next major target at 122000.
Support Zones:
🔹 117800 – intraday bullish retest
🔹 116500 – strong demand zone
Resistance Ahead:
🔸 120200 – short-term reaction
🔸 122000 – major target
🚀 Expecting bullish wave continuation.
If momentum sustains above 118K, 122K breakout highly probable!
#BTC #Bitcoin #CryptoSetup #BTCUSD #CryptoTrading #BTC122K #ChartAnalysis #BullishBreakout
Btcusdanalysis
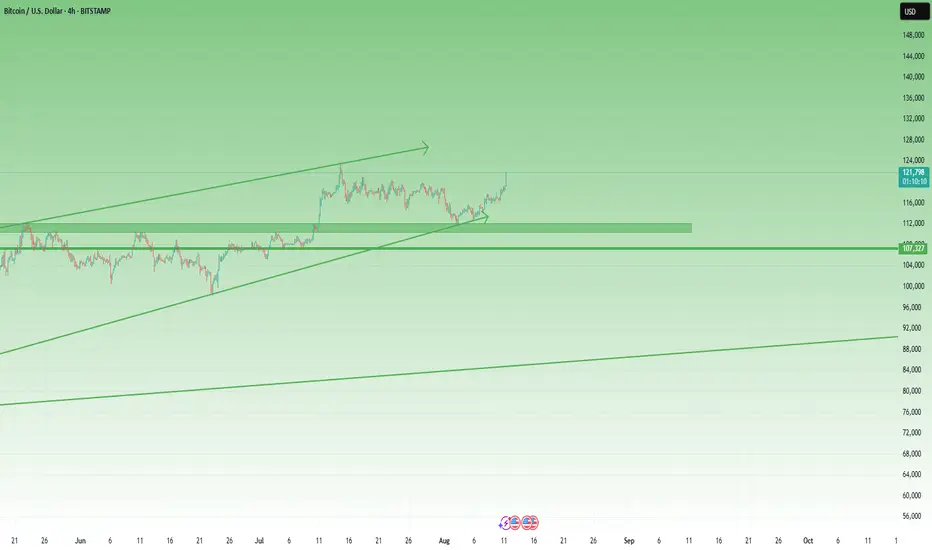
BTCUSDT 111k first then UPHi fellow traders,
Here’s my current BTCUSDT view on the 4H chart, based on Elliott Wave principles.
After a corrective structure, we’ve seen a strong bounce, and price is now approaching a key area of interest. I’ve marked the zones I’m watching for potential buys and sells:
🟨 Lower box: Potential buy zone if price pulls back with a corrective structure.
🟨 Upper box: Area of interest for taking partials or looking for potential short setups, depending on how price reacts.
If momentum continues, we could see BTC pushing into the 125K region, which aligns with fib extensions from previous swings.
As always, I’m waiting for confirmation before making any entries.
Let me know what you see on your end!

BTC Bulls Back in Control – 130K in SightIn my previous BTC analysis, I highlighted that the price was sitting right in a confluence support zone, with strong odds for a bullish reversal.
That scenario played out well — bulls regained control. After a retest of the low pruces in the middle of last week and a modest initial bounce, momentum accelerated today, pushing BTC close to its previous all-time high at the time of writing.
Looking ahead, I don’t expect the old ATH to be a major obstacle for buyers. A clean break above should open the path toward 130K+ as the next logical upside target.
For now, as long as BTC trades above 114K, bulls have no reason for concern.
$BTC/USDT Breakout: $128K Next?CRYPTOCAP:BTC just broke out of a falling wedge on the 6H chart, a strong bullish sign.
It's now trading above key moving averages, showing solid momentum.
If this breakout holds, we could be looking at a move toward $128K.
Keep an eye on the $118K zone for a possible retest before the next leg up.
DYOR, NFA

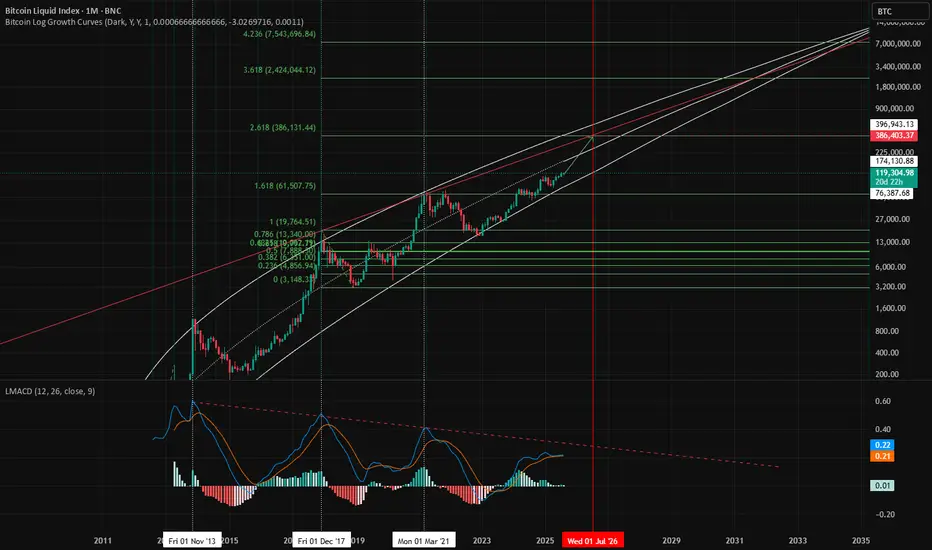
Math is Not Magic - BTCUSD Price Prediction 2026Looks like this pump will be extended. Using fibs on time and price, 380K is my target, timeframe is between March thru June of 2026. Watch for alts afterwards for rotation.
Good luck.
Bitcoin Btc usdt Daily analysis
Time frame daily
As you can see byc is moving up and down in the green tunnel
My last target (yellow rectangle) is touched and byc couldn't break the upper side of tunnel
Now, my target is 120.000 $ ( red rectangle)
If this time , btc can break the green uptrend line as resistance line , my next target is 145.000$,
👉👉Important notice 👈👈
Here is not suitable Time for entry the long or short position because btc is in the middle of the tunnel

Bitcoin trading ideasLooking at the 4-hour chart, Bitcoin has broken out of its downward channel, marking the end of a nearly two-week correction. The market will continue to test previous highs. Trading strategy remains unchanged, with a focus on buying on pullbacks and exiting the market on profit taking near previous highs. If you have any trading questions, please leave a comment and we'll respond to them.

BITCOINBTC is going up slowly, we need to get a correction down soon if it is planning to go up and break ATH.
Disclosure: We are part of Trade Nation's Influencer program and receive a monthly fee for using their TradingView charts in our analysis.

BTCUSD - Important signals and levelsMarket Dynamics and Trend
Current price is around $118,558, +1.18% per session. Daily range: $116,468 – $118,655.
The trend remains bullish despite the consolidation period below $120,000. Institutional interest and stable buying pressure support further gains.
Important signals and levels
A large purchase of 274 BTC (~$32 million) is a signal of large institutional demand, which often precedes volatility spikes. Monitor funding dynamics and volumes.
Capital activity - BTC is held above $114,500 due to inflows into crypto instruments; this strengthens the bullish sentiment.
Cup and Handle Pattern + Bullish MACD - Technical analyst Katie Stockton expects a raid to $134,500 (~14% upside from current levels) due to a breakout of a new ATH.

#Bitcoin Sunday Analysis: $BTC is holding near $118,330 #Bitcoin Sunday Analysis:
CRYPTOCAP:BTC is holding near $118,330 after last week’s bounce from $112,398, maintaining strong bullish momentum. Macro developments — including Trump’s $12.5T pension fund order allowing BTC inclusion, pro-crypto Fed nomination, and anti-debanking executive order — mark historic steps toward full BTC integration into the U.S. financial system.
🔸 Key Support Zone at $112,000–$113,000:
Liquidity pools remain here; market makers may dip price into this zone before resuming upside. This area offers a high-probability long entry.
🔸 Upside Target: $120,000 (Short-Term)
A breakout above range resistance could open the path to $125,000–$130,000 mid-term, fueled by whale accumulation, strong ETF inflows, and returning retail interest.
🔸 Risk Level at $110,000:
A sustained loss below this zone could slow bullish momentum, but macro and on-chain data suggest dips are buying opportunities.
🔸 Outlook:
Watch $112K–$113K for entries. Stay bullish above $110K. Prepare for possible volatility with CPI data Tuesday and PPI Thursday as potential breakout catalysts.

btc signalThe analysis went well, but put the breakeven and would you like me to put more signals? I would be happy to hear your comments.Two signals and two profits. Thank you for your attention.

BTC key zones for continueBTC needs to hold this zones for continue and there is some liquidity. Because dominance get breakout we want to see much higher prices for altcoin but maybe we will see sharp correction and continue up.
Feel free to ask for some altcoin analysis.

BTCBitcoin in bull-trend so entry in any correction.
EN: 117.300
SL:115.790
TP: 119.000 - 121.000 - 122.777
please control risk management

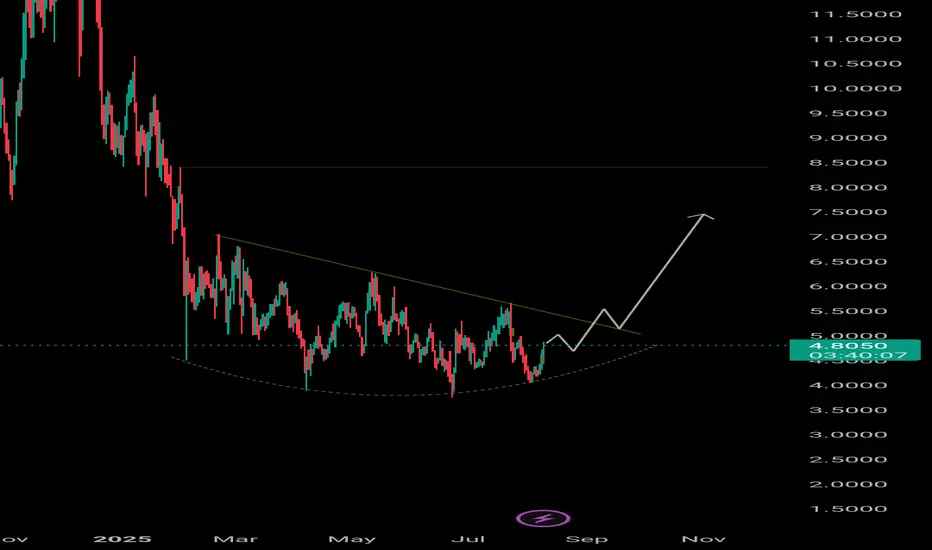
Apt/usdt Bull Analysis AMEX:APT holders will be smiling very soon ❤️
AMEX:APT is forming a beautiful rounded bottom, showing signs of a potential trend reversal. 📈
I’ll be watching closely for a breakout above the descending trendline — but my entry will only be on confirmation in the marked red zone.
If it plays out, the path toward $6.5–$7.5 could be wide open. 🚀🚀
$BTC Finally Historical Profit Done at $122K & Now $123K of ATH CRYPTOCAP:BTC tying to push price upward movement and if it's Breakout the $120K-$122K Price Level area than it could be reached $128K - $136K price level area.
I'm guess it will be happened. Always Pattern indicate and say price movement of Bitcoin. I was many Prediction of popular coin and i will succeed in 2025. I'm long term analyst of long term investment of Traders.
🚦From News: Bitcoin Holds Firm Above $115K Support as Charts Point Toward $150K Target
Bitcoin holds above $115K support with charts pointing to a potential $150K Elliott Wave target.
Hashrate hits all-time high as energy value model places BTC valuation 45% above current price.
U.S. policy shift enables 401(k) crypto access, opening a $9 trillion market for Bitcoin adoption.
Bitcoin has held firm above the $115,000 support and is now showing signs of a large move on the charts. Price patterns and rising adoption trends are aligning as BTC prepares for a possible rally. At the time of writing, BTC was trading at $116,620, showing steady upward momentum.
Technical Structure Points Toward Upside Continuation
According to an analysis prepared by Lau, Bitcoin has taken the $115,000 support and may be preparing to break its all-time high. On Binance, the BTC/USDT daily chart displays a breakout from resistance near $116,438.79. The price reached a new high before retracing to $111,917.37, where it found support.
BTC’s price structure continues to show higher lows, aligning with the Elliott Wave pattern that targets $150,000. Key support levels remain at $98,385.45 and $89,326.51, confirming a strong technical base. According to Daan Crypto Trades, Bitcoin is steadily rising toward the $120,000 zone, where a cluster of stop losses and liquidation points may fuel further upside.
The current bullish flag formation is still intact, supported by the 50-day SMA at $113,154. The RSI has moved to 54, indicating recovering momentum without being overbought. Analysts view a break above $117,350 as a key signal for another upward push.
On-Chain Metrics and Market Drivers Support Growth
Bitcoin’s energy value stands at $167,800, which is around 45% above the current market price. According to Charles Edwards, founder of Capriole Investments, “Hash rates are flying and Bitcoin Energy Value just hit $145K.”
This model links BTC’s value to miner energy inputs and network security. Bitcoin’s hashrate reached an all-time high of 1.031 ZH/s on August 4, based on data from Glassnode. Alongside this, adoption is growing in the U.S. market.
President Trump’s policy allowing 401(k) crypto inclusion has opened a $9 trillion market. Crypto-linked equities and ETFs have also seen strong inflows, supporting long-term price action.
#highlights #everyone #premium #BinanceSquareFamily #Binance #BTC☀ #SUBROOFFICIAL
Disclaimer: This article is for informational purposes only and does not constitute financial advice. Always conduct your own research before making any investment decisions. Digital asset prices are subject to high market risk and price volatility. The value of your investment may go down or up, and you may not get back the amount invested. You are solely responsible for your investment decisions and Binance is not available for any losses you may incur. Past performance is not a reliable predictor of future performance. You should only invest in products you are familiar with and where you understand the risks. You should carefully consider your investment experience, financial situation, investment objectives and risk tolerance and consult an independent financial adviser prior to making any investment.

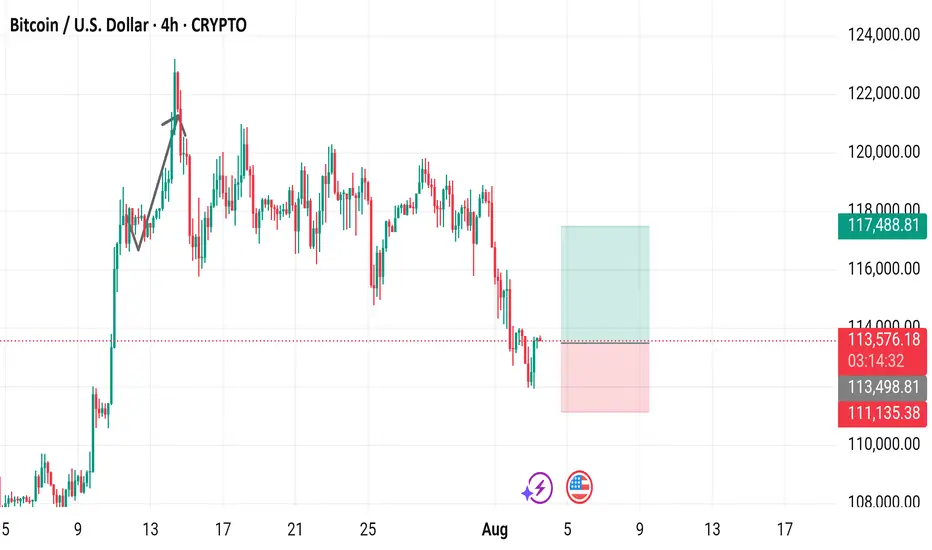
Bitcoin / U.S. Dollar 4-Hour Chart (BTCUSD)4-hour chart displays the price movement of Bitcoin (BTC) against the U.S. Dollar (USD) from late July to August 3, 2025. The current price is $113,570.31, with a 24-hour change of +$1,064.77 (+0.95%). The chart shows a recent upward trend followed by a sharp decline, with key levels marked at $113,570.31 (buy/sell price) and $111,135.38 (support level). The trading volume and price range are highlighted, with a notable drop below the $113,570.31 level as of 03:16:00 on the chart.
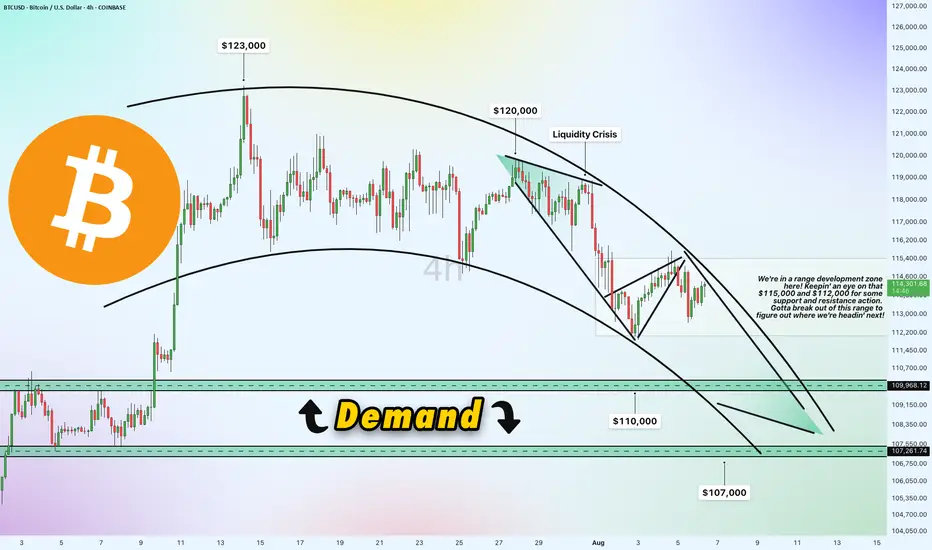
Bitcoin 4h Chart Update [Tight Range / Breakout Opportunities]Breakout Opportunities
We're in a range development zone here! The chart shows Bitcoin (BTC/USD) trading within a tight range, with key levels at $115,000 and $112,000 acting as critical support and resistance zones. The price recently peaked near $123,000 but has since pulled back, forming a liquidity crisis zone around $120,000 where selling pressure kicked in. A breakout above $115,000 could signal a move toward $120,000 or higher, while a drop below $112,000 might push it toward the demand zone. Gotta break out of this range to figure out where we're headin' next!
Demand Zone
$110,000 & $107,000
Price slipped down from $120,000 due to a lack of buying liquidity, potentially it will land into a demand zone between $110,000 and $107,000. This area could act as a strong support level where buyers might step in. If the price holds here, it could bounce back toward the $112,000-$115,000 range. However, a failure to hold this zone might see it test lower support around $107,000 or even $105,000.
Direction and Possible Ranges
Upward Potential: If Bitcoin breaks above $115,000 with strong volume, the next targets could be $120,000 (liquidity crisis zone) and potentially $123,000, aligning with recent highs. A sustained move above $120,000 might open the door to $125,000 or beyond.
Downward Risk: Should the price fail to hold above $112,000 and break below, it could slide into the demand zone ($110,000-$107,000). Further weakness might push it toward $105,000, a psychological and technical support level.
Current Trend: The chart shows a descending trendline from the $123,000 peak, suggesting bearish pressure unless a decisive breakout occurs. The 4-hour timeframe indicates indecision, with the range-bound action hinting at a potential volatile move once direction is confirmed.
Keep an eye on these levels for the next big move!
BTCUSD – Bearish Retracement Towards Key Liquidity Zone📊 BTCUSD – Bearish Retracement Towards Key Liquidity Zone
BTCUSD is currently trading near 116,425, showing signs of a potential bearish retracement after testing the previous resistance zone around 117,000–119,000. The chart structure highlights multiple Break of Structure (BOS) points, confirming shifts in market sentiment.
Technical Breakdown
Previous Resistance Rejection
Price failed to hold above the 117,000 mark, indicating strong selling pressure from the prior supply zone.
The rejection aligns with a liquidity grab above the recent highs, suggesting smart money distribution.
Liquidity & Fair Value Gaps
There’s a visible Liquidity/Fair Value Gap from the late July rally, which may now act as a magnet for price.
The market tends to fill these inefficiencies before deciding the next major trend move.
Target & Support Zone
The next key support and liquidity pool rests between 113,500 – 114,000, highlighted as the target zone.
This area has confluence with previous accumulation phases, making it a probable point for a bullish reaction if tested.
Volume Profile Context
Volume nodes indicate heavier trading activity below current levels, suggesting that a drop towards 114,000 could be met with increased buyer interest.
Market Outlook
Primary Bias: Short-term bearish retracement.
Immediate Target: 114,000 liquidity zone.
Invalidation: A daily close above 117,500 may shift sentiment back to bullish, opening the path toward 119,000–121,000.
Trading Insight:
Aggressive traders may look for short setups below 116,500, targeting 114,000. Conservative traders may wait for price to tap into the support/target zone for potential long opportunities with tight risk management.

Bitcoin market analysisBitcoin has been fluctuating downward since it hit a new high on July 14. It rebounded upward after testing the downward support level on August 3. What we need to pay attention to now is the upper resistance level of the downward channel. If it breaks through, this adjustment will end and you can go long on the pullback. We need to pay attention to the support near 11,200 below. You can consider going long with a light position near 11,200, with a stop loss of 1,000-1,500, and see the strength of the rebound.

Bitcoin : Stay heavy on positionsSame view as before. No change.
Bitcoin : Stay heavy on positions (2x)
For new Bitcoin entries, now is the time.
If you're using leverage, I’d wait for a scale-in signal before jumping in.

BTC At Key Support! Will Bulls Breakout From $116K? Don’t Miss **💎 BTC TRADE SETUP — HOLDING SUPPORT FOR NEXT LEG UP**
📈 **Market Bias:** Mixed → Short-term pressure, long-term bullish
🔍 **Key Level:** Price holding near **50-SMA** support
⚡ **Potential:** Consolidation could fuel breakout toward **\$117.5K**
**🛠 Setup:**
* **Direction:** LONG
* **Entry:** \$116,132.70
* **Stop Loss:** \$114,500 (below support)
* **Take Profit:** \$117,500
* **Size:** 1 contract (1x leverage)
* **Confidence:** 70%
* **Timing:** Market open
📌 **Why Long?**
* BTC above major moving averages — bullish trend intact
* RSI & MACD hint at possible upside momentum
* Favorable risk-reward near key support zone
⚠ **Risk Note:** Breakdown below **\$113,069** (50-SMA) flips bias bearish. Volatility can cause sharp swings — position sizing matters.
---
**#BTC #Bitcoin #Crypto #BTCUSD #CryptoTrading #Cryptocurrency #CryptoSetup #DayTrade #SwingTrade #PriceAction #CryptoSignals #TechnicalAnalysis #BitcoinPrice #BreakoutTrading #SupportAndResistance #BTCAnalysis #MovingAverages #RSI #MACD #CryptoInvesting #BullishSetup #CryptoMarket**

WE HAVE PREDICTED EVERY MOVE OF BITCOIN - HERE IS WHAT’S NEXT!! Yello Paradisers! we have predicted every single movement on Bitcoin in the past few months, and in this video, I will reveal to you what's going to happen next with the highest probability. Again, on the high time frame chart, we are seeing the ABC zigzag, and right now, we are trading inside of the C wave. Further in the video, we are zooming into the fourth wave.
On the medium time frame, we are seeing bearish divergence that is showcasing an absorption. We are describing Heron-Chorda's target and taking a look at the channel in which the zigzag is being formed. On the low time frame, we are analyzing the Elliott Wave Theory Triple Three pattern, and on the ultra-low time frame, we are analyzing the impulse.
We are describing what kind of conformations we are waiting for. Basically, it's a five ways to the downside. Then, we will be increasing our portfolio exposure on a corrective mode wave to the upside where we will be able to create a tight risk-to-reward ratio position and a high-probability trade setup. Trade smart, trade with a professional trading strategy, be tactical, and enjoy your weekend.
Remember, don’t trade without confirmations. Wait for them before creating a trade. Be disciplined, patient, and emotionally controlled. Only trade the highest probability setups with the greatest risk to reward ratio. This will ensure that you become a long-term profitable professional trader.
Don't be a gambler. Don't try to get rich quick. Make sure that your trading is professionally based on proper strategies and trade tactics.

$BTC Head and shoulders forming....elevator to 110kOver the last few days BTC has been in a downward channel and recently got a boost from the not so "free market" Trump's policies to open up highly volatile crypto to people looking to save and retire. One would expect a much bigger spike, but 117k resistance seems to be holding firm and retailers appear to be the exit liquidity for institutions. No crystal ball on where BTC will be, but there will be massive volatility along the way and in the short term 110k (or below) seems to be very much in the realm of possibilities. We're in a recession and all the lagging indicators are showing red flags. Enter BTC at your OWN RISK! If you're up, take your profit. If you're down, check out other strategies (like VIX strategies for downside protection).
