BITCOIN Risky Short!
HI,Traders !
#BITCOIN grew up fast
But then hit a horizontal
Resistance level of 117678.7
From where we are already
Seeing a nice pullback
And we will be expecting
A further local move down !
Comment and subscribe to help us grow !
Btcusdanalysis

BITCOIN SIGNAL: HUGE MOVE IN DIRECTION NOBODY EXPECTED INCOMING!Yello Paradisers! Let me know your thoughts in the comment section below!
And Paradisers! Keep in mind to trade only with a proper professional trading strategy. Wait for confirmations. Play with tactics. This is the only way you can be long-term profitable.
Remember, don’t trade without confirmations. Wait for them before creating a trade. Be disciplined, patient, and emotionally controlled. Only trade the highest probability setups with the greatest risk to reward ratio. This will ensure that you become a long-term profitable professional trader.
Don't be a gambler. Don't try to get rich quick. Make sure that your trading is professionally based on proper strategies and trade tactics.

btcusdtI think Bitcoin is making a fake move and will fall from here, and it's not bullish at all. What do you think? Will it go up?

BTC/USDT ; Is the shedding over?Hello friends
Due to the price correction we had, the price has bounced back into a good support area where there were many buy orders and has reacted well.
Now it remains to be seen whether it will succeed in defeating the trading pain or not.
If buyers continue to support the price, it could break the range and move towards the specified targets.
*Trade safely with us*

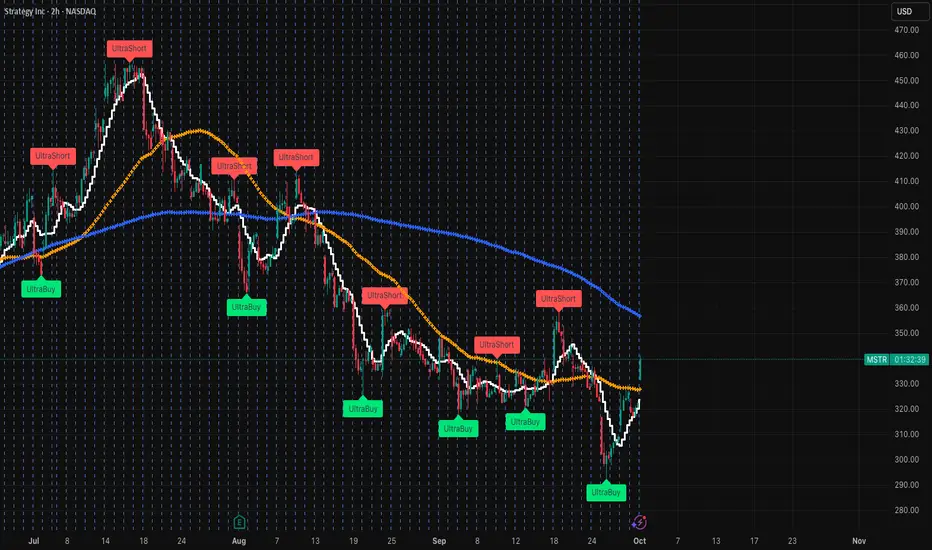
MSTR is still in a downward channelWhile it looks promising that MSTR is making some small gains, it's still in a very real downward channel. These type of gains are typically very short lived as many in this space are short term / profit takers. Technicals and soon UltraShort signals are confirm this, but would not bet the fam on any of this f&ckery!
Bitcoin Price Eyes $120,000 as Seller Exhaustion Sets InBitcoin is trading at $116,502, attempting to hold $115,000 as a new support level. Securing this area is vital as the cryptocurrency also works to break out of the two-month downtrend that has capped its upward momentum since midsummer.
If conditions improve, Bitcoin could rally beyond $117,261. Breaching this level would open the door to $120,000. This would reinforce optimism among traders and institutions anticipating further growth in the crypto king’s valuation.
However, failure to maintain current levels would invalidate the bullish outlook. Bitcoin could fall back to $112,500 or even $110,000, extending the bear run. Such a move would dampen sentiment, signaling renewed vulnerability in the world’s largest cryptocurrency.

BTCUSDT Cut n Reverse Area? what's next??#BTCUSDT - perfect holdings upside as we discussed in our last idear regarding Bitcoin and now market just reached at his ultimate area/region, that is around 107500-700
keep close that region because that is market full n final region for buyers.
dont hold your buying positions below that.
NOTE: we will go for cut n reverse below that that region.
good luck
trade wisely

BTC Analysis: Support, Market Structure & My Trade Plan📊 Bitcoin (BTC) has been rallying strongly and remains in a clear bullish trend 🚀.
🔎 At this stage, I’m watching for price to pull back into support. If BTC can hold that level and then confirm with a bullish break of market structure on the 30-minute chart ⏱️, it would provide a potential long entry setup 🎯.
📈 The broader momentum remains bullish, so I’ll be patient and wait for confirmation before getting involved.
⚠️ Disclaimer: This analysis is for educational purposes only and not financial advice. Always trade with proper risk management.

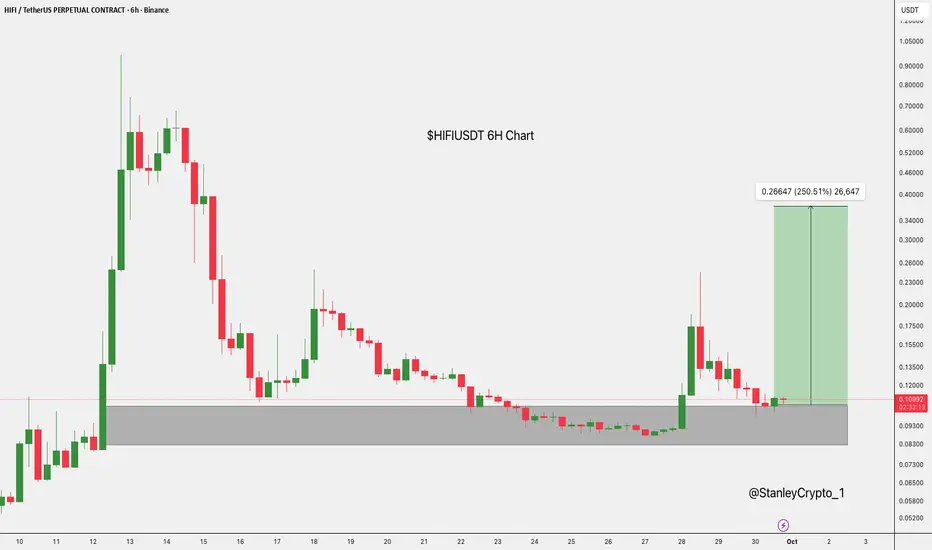
$HIFI showing strength at key support, potential upside ahead$HIFI is holding steady in a key demand zone.
This area has sparked strong reactions before, hinting at accumulation.
If it holds, the price could rally toward 0.37240, representing a roughly 250% move. But if the zone breaks, the setup turns bearish.
DYOR, NFA
$BTC Wyckoff DistributionPreliminary supply, or PSY:
Occurs when significant interests start to sell lots of shares following a sharp upward trend. Volume increases and the price spread widens, indicating the possibility of a trend change.
BC:
buying climax, characterized by frequently significant rises in volume and price spread. The intensity of purchasing peaks, with professional interests filling heavy or urgent public demand at prices close to their peak. Since large operators require enormous public demand to sell their shares without reducing the stock price, a BC frequently occurs in conjunction with excellent earnings reports or other positive news.
AR:
Automatic reaction. After the BC, the strong buying significantly decreased, but the heavy supply persisted, and an AR occurred. The lower border of the distribution TR is defined in part by the selloff's low.
ST:
Stands for the secondary test, in which the price returns to the BC region to evaluate the demand/supply situation at the current price levels. Supply must exceed demand for a top to be confirmed, so volume and spread should decline as the price moves closer to BC's resistance zone. An ST could appear as an upthrust (UT), in which case the price goes above the resistance indicated by the BC and perhaps other STs before abruptly reversing to close below resistance. Price frequently tests the TR's lower boundary after a UT.
SOW—sign of weakness:
A downtrend to (or just barely past) the TR's lower border, typically accompanied by an increase in spread and volume, is an indication of weakness (SOW). The AR and the initial SOW(s) point to a shift in the stock's price movement, with supply now in control.
Last point of supply, or LPSY:
A weak rally on a tight spread following a test of support on a SOW indicates that the market is having significant difficulties advancing. Strong supply, low demand, or both may be to blame for this market's inability to recover. Before markdowns start in earnest, LPSYs signify the end of the demand cycle and the final distribution waves from large operators.

$BTC not too late to get outWe've been seeing a downward channel and bounce down off the top wedge. Technicals confirm this as well as UltraShort signals. There's a bit more to give (bleed). If you're up now, it's a good time to get out and stay on the sides. With the looming gov shutdown and ultra high markets, the recipe for a good pullback is high. Inverse ETFs CBOE:MSTZ CBOE:UVIX could play nicely.

ANFIBO | BTCUSD will go to 109,000 USD?Hi guys, Anfibo's here ! This is my BITSTAMP:BTCUSD – In-Depth Analysis & Trading Plan
In the most recent session, BTC showed a positive reaction at the $111,000 support level, bouncing back above $112,000. This indicates that short-term buying pressure remains present around this key zone. However, on the H4 timeframe, I believe BTC is likely to form a double bottom pattern around the $109,000 region – which is precisely where I am waiting for a strategic buy entry with a favorable risk-to-reward setup.
Here's My Trading Plan:
>>> BUY ZONES:
- ENTRY: 108,000 - 110,000
- SL: below 107,000 (depending on risk appetite)
- TP1: 117,500
- TP2: 122,000
- TP3: 128,000
Key Resistance Levels Before Reaching TP
For BTC to achieve the targets, it must first clear several intermediate resistance levels:
$117,500
$119,000
$122,000
These will serve as critical checkpoints, as price reactions here will determine whether the recovery trend can sustain momentum.
Important Support Zones to Watch
In the event of further weakness, the following support levels will be crucial:
$109,500
$105,000
$101,000
Notably, $101,000 is a decisive level on the higher timeframe. Should this support break convincingly, we must prepare for a major trend reversal scenario, potentially opening the door to a deeper decline.
Conclusion, Personal Outlook
BTC is currently moving within a key support area and is showing signs of forming a short-term bottom. My primary strategy is to buy around $109,000, aiming for a recovery toward the $120,000 – $125,000 range, while maintaining strict risk management in case the $101,000 level is broken.
In this environment, short-term traders can take advantage of corrective rallies, while long-term investors should remain patient and monitor the 101k zone closely – as it represents a potential “line in the sand” that could redefine the next major cycle.
WISH ALL YOU THE BEST, MY FRIENDS!

My view on BTCBitcoin has shown renewed strength in momentum after tapping into a strong support zone.
From a structural standpoint, price first printed a lower low, then followed with a higher low, which is a classic signal of improving momentum and potential trend reversal.
If price can break decisively above the 117,900 level with high volume, I think it opens the path for BTC to rally into the order block near the all-time high.
🎯 Conclusion: My outlook leans bullish — the shift from a lower low to a higher low highlights building momentum, and a break above 117,900 with strong volume would likely accelerate the move toward the upper order block. Still, markets are unpredictable, and this is only my view.
👉 For more structured market insights and professional analysis, follow along.

BTC Rally – New Highs or Bull Trap?Hey Traders, IG:BITCOIN is currently trading within established descending channel since August highs at $124k , The recent bounce has now pushed price back up, currently sitting at the 38.2% Fibonacci retracement and likely heading into a critical supply zone at 115K–116K , which also aligns with the 50% Fib level .
This confluence, combined with RSI nearing overbought territory and the potential formation of a hidden bearish divergence (price making lower highs while RSI makes higher highs), suggests that momentum is weakening as we approach resistance. Historically on this chart, bearish divergences have often preceded meaningful pullbacks.
Unless bulls can break decisively above this zone and invalidate the channel structure, the probability favors rejection and continuation lower . My short‑term outlook points toward a move back into the demand zone, with Target 1 and Target 2 marked as key levels to watch for the next leg down.
Scenarios
🔴 Bearish (Higher Probability)
Rejection from 115K–116K supply zone (Fib 50–61.8 + channel resistance).
Short-term correction toward 110K, with deeper moves into 107K–105K demand zone.
🟢 Bullish Alternative
Break & close above 116K (channel + supply + 61.8 Fib) would invalidate this setup.
Opens room for a rally toward 120K+, but less likely given RSI divergence and supply pressure.

BTC new ATH and peek euphoria incoming!Wave 4 of the 5 of the 3 is complete after a complicated WXY new target 118K to 122K window. We will see how this finishes, either a slow grind higher or straight up then straight down.

Bitcoin’s Next Big Move: Buy the Dip Before $138K!Hello guys!
Bitcoin is once again at a critical stage, and the chart is giving us a clear roadmap for the next move. Let’s break it down:
Current Setup
Price is holding above $108K–109K and has shown strength around the $103K support zone.
The structure remains bullish as long as BTC trades above $100K.
Strategy
1- Entry zones for buying:
Current market price (~$109K)
Support zone around $103K (a good second chance for buyers).
2- Stop-loss: Around $99K, just below the psychological and structural support of $100K.
3- Target: Upside potential points toward $138K , which aligns with the next major resistance zone.
⚠️ Risk Factor
If BTC breaks below $100K, the bullish phase ends, and we should expect a bearish shift in momentum. In that case, caution and defensive trading will be the smarter play.
📌 Conclusion
For now, the play is simple:
👉 Stay bullish and buy dips while BTC is above $100K.
👉 Watch the $103K zone for re-entries.
👉 Protect your capital with a $99K stop-loss.
👉 Aim high-> the next big target sits around $138K.

mrmoney limited BTC/USD swing trading ideaprice approached a key level of support zone on the weekly timeframe which is giving a buy signal

BTC Accumulates in Downtrend - CorrectionBTC Analysis
BTC is currently moving in line with the broader trend structure. After a strong bearish leg, the price reacted precisely at the 108k demand zone, rebounding sharply by around +4,000 points. This confirms that buyers are still actively defending this critical level.
At present, BTC is trading near 112k, with the next resistance levels to watch at 113,925 – 116,132. A short-term bullish continuation into these zones is possible, but strong selling pressure is expected there.
If the price fails to hold above the 113k – 114k area, a pullback toward the 109k demand zone could follow. A deeper bearish continuation would then likely target 106k – 106.2k, which aligns with the next key Fibonacci extension and a major support area.
Key Notes:
• The broader trend remains intact; buyers successfully defended 108k.
• Watch resistance at 113.9k – 116.1k for potential reversal signals.
• Key support zones: 109k (demand) and 106k (major target).

BITCOIN SIGNAL: MOST PEOPLE ARE DOING THIS NOW (wrong)Yello Paradisers! In this video, we are going through multi-timeframe analysis on Bitcoin as professional traders. We are using advanced technical indicators, and we are properly analyzing with an Elliot Wave perspective. We are digging deep into the sub-waves and structure. Enjoy.
And Paradisers! Keep in mind to trade only with a proper professional trading strategy. Wait for confirmations. Play with tactics. This is the only way you can be long-term profitable.
Remember, don’t trade without confirmations. Wait for them before creating a trade. Be disciplined, patient, and emotionally controlled. Only trade the highest probability setups with the greatest risk to reward ratio. This will ensure that you become a long-term profitable professional trader.
Don't be a gambler. Don't try to get rich quick. Make sure that your trading is professionally based on proper strategies and trade tactics.

4HOUR ANALYTICAL FRAMEWORK FOR BTCUSD, 29TH SEPT,2025The top leading coin has been bullish since the onset of this year. As of April, the digital coin reached an all-time high in value, increasing in value to approximately $120,000. which shortly after a few weeks into its new performance retraced back down, and ever since, the markets have remained below as the price has been moving to find balance and fill orders and liquidity gaps left while moving up in value, thereby finding fair prices between supply and demand before deciding a new direction of movement. The question is, will the price remain lower or find balance and resume its increase in value as it started in the early days of April 2025?

$8 Billion Bitcoin Accumulation Could Launch Price to $115,000At the time of writing, Bitcoin is trading at $111,966, just shy of the $112,500 resistance. The recent bounce from below $110,000 reflects investor demand, but breaching key resistance remains critical for further upside momentum.
If Bitcoin successfully climbs past $112,500, the crypto king could reclaim $115,000 as a support level. This would open the door for a rally toward $120,000 in the coming days, fueled by accumulating investor demand and reduced selling pressure on exchanges.
However, failure to overcome $112,500 resistance would expose Bitcoin to further downside risks. A drop back to $110,000 or even $108,000 remains possible. This would invalidate the bullish outlook and trigger renewed skepticism about Bitcoin’s near-term recovery.

Don’t Blink! BTC Signal Turns Bearish# BTC Quant Signals Stock 1M Prediction — 2025-09-28
CRYPTOCAP:BTC Quant Signals Kline Signal
📊 **CURRENT MARKET STATUS**
* Current Price: **$48.71**
* Data Quality: **Good**
* Timeframe: **1-Minute Bars (Scalping)**
---
🎯 **SCALPING PRICE PREDICTIONS**
* 30-Minute Target: **$48.32 (-0.81%)**
* 2-Hour Target: **$48.39 (-0.66%)**
* End-of-Day Target: **$48.49 (-0.45%)**
📌 Extended Outlook
* Final Target: **$48.39 (-0.66%)**
* Predicted Volatility: **21.8%**
* Expected Range: **$48.30 – $48.83**
---
📈 **SCALPING TREND ANALYSIS**
* Direction: **BEARISH**
* Confidence: **64%**
* Support: **$48.30**
* Resistance: **$48.83**
* Range Size: **1.1% of current price**
---
💰 **INTRADAY TRADE RECOMMENDATION**
* Direction: **SHORT**
* Entry Price: **$48.71**
* Target: **$48.45**
* Stop Loss: **$49.44**
* Confidence: **64%**
* Risk/Reward: **0.35 : 1**
* Session: **Intraday (1m bars)**
* Trend: **BEARISH**
#BTC #Crypto #Scalping #QuantSignals #TradingView

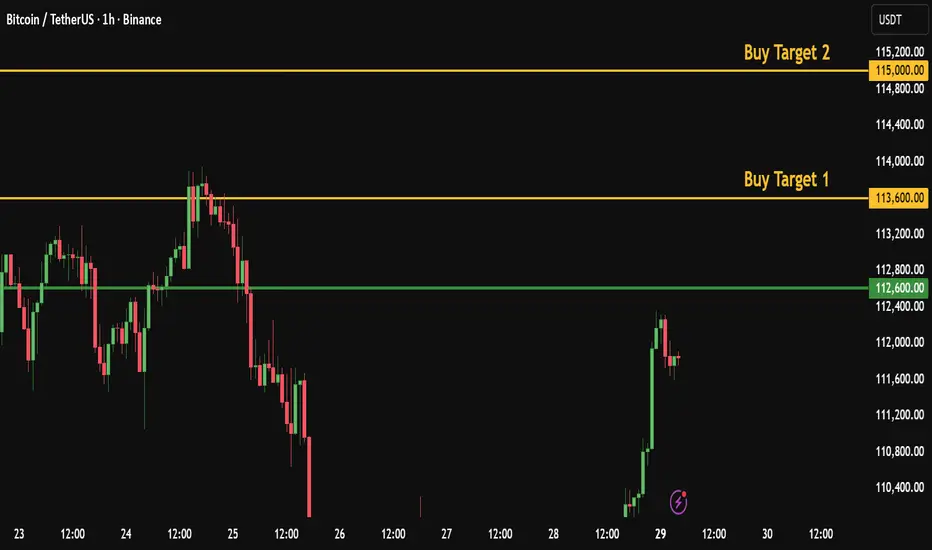
Daily Bitcoin Signal: Watching the 112,600 Breakout, target 115K
Bitcoin Daily Numeric Analysis
Bitcoin is currently showing signs of strength as it tests the key resistance level around 112,600. A confirmed breakout above this zone could trigger fresh bullish momentum, opening the door for higher targets in the short term.
My Personal Long Setup
If price breaks and closes a 1H candle below 109,150, I will enter a short trade.
🎯 Target 1: 108,250
🎯 Target 2: 107,500
❌ Stop-loss: 110,600
👍 Don’t forget to boost this trading idea if you found it helpful,
and follow me for more daily crypto insights and trade setups.
Please note:
This is not financial advice – I’m only sharing my personal trades.
Always do your own research before taking action.
Best of luck 🌹