BITCOIN isn't diverging from 2022 at all!Bitcoin (BTCUSD) continues to replicate the 2022 Bear Cycle almost in the exact same fashion. This is of course a concept we introduced back in October for the first time and so far it has fulfilled all conditions set in its way.
The most recent is the 1D MA100 (green trend-line) rejection, which in 2022 happened on March 02 and after another Support test, BTC rebounded for the final rejection on the 1D MA200 (orange trend-line). As mentioned before, that could be around $100k.
Assuming the 2026 Bear Cycle continues to repeat the 2022 price action, the next Support level should be around $70k, then $51-52k and finally around $45000.
So do you think it will unfold like 2022? Feel free to let us know in the comments section below!
---
** Please LIKE 👍, FOLLOW ✅, SHARE 🙌 and COMMENT ✍ if you enjoy this idea! Also share your ideas and charts in the comments section below! This is best way to keep it relevant, support us, keep the content here free and allow the idea to reach as many people as possible. **
---
💸💸💸💸💸💸
👇 👇 👇 👇 👇 👇
Btcusdsignals

BTC/USD PROFESSIONAL CHART ANALYSISPrice Action Breakdown
The breakdown candle shows strong momentum and volume, suggesting institutional participation.
Post-breakdown, price formed a lower low → bearish structure confirmed.
The current price action is a pullback into supply / resistance, not a reversal.
Trade Idea Marked on the Chart
Entry Zone (Short)
Entry area around 89,600 – 90,200
This zone aligns with:
Previous support turned resistance
Breakdown level retest
Psychological 90k level
Targets
1st Target: ~87,350
Local support
Likely intraday bounce area
Final Target: ~85,600
Strong demand zone
Prior range base / liquidity pool
Key Levels
Resistance:
90,200 – 91,000 → strong rejection zone
Support:
87,300 (minor)
85,500–85,600 (major)

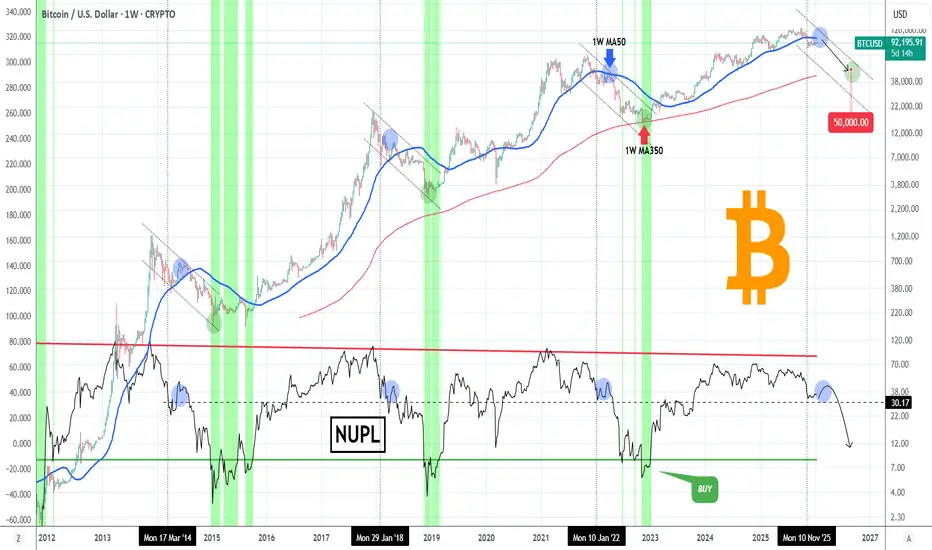
BITCOIN is done if it closes below the 1M Bollinger Basis.Bitcoin (BTCUSD) is trading for the third straight month on the 1M Bollinger Bands Basis (black trend-line) and with only 5 days left to close the monthly candle, time is running out for a reversal.
That's because every time in the past 12 years that BTC closed a 1M candle below the BB Basis, it initiated Phase 2 of the Bear Cycle, and right now the price is sitting under it.
If it closes this way, Phase 2 should take it to at least the 1W MA200 (orange trend-line), which has always been hit historically during a Bear Cycle and is in fact where the January 2015 and December 2018 bottoms got priced. Based on the last Bear Cycle though, we should even test the 1W MA350 (yellow trend-line), which is where the November 2022 bottom was formed.
If that happens, the Bear Cycle should bottom around $50000, which falls exactly in the middle of the 0.382 - 0.5 Fibonacci retracement zone, again consistent with all previous Cycle bottoms. Notice that only when BTC reclaimed and closed above the 1W MA200 again (March 2023) was the new Bull Cycle confirmed.
So what do you think? Will a 1M candle closing below the Bollinger Basis be that bad for Bitcoin? Feel free to let us know in the comments section below!
---
** Please LIKE 👍, FOLLOW ✅, SHARE 🙌 and COMMENT ✍ if you enjoy this idea! Also share your ideas and charts in the comments section below! This is best way to keep it relevant, support us, keep the content here free and allow the idea to reach as many people as possible. **
---
💸💸💸💸💸💸
👇 👇 👇 👇 👇 👇

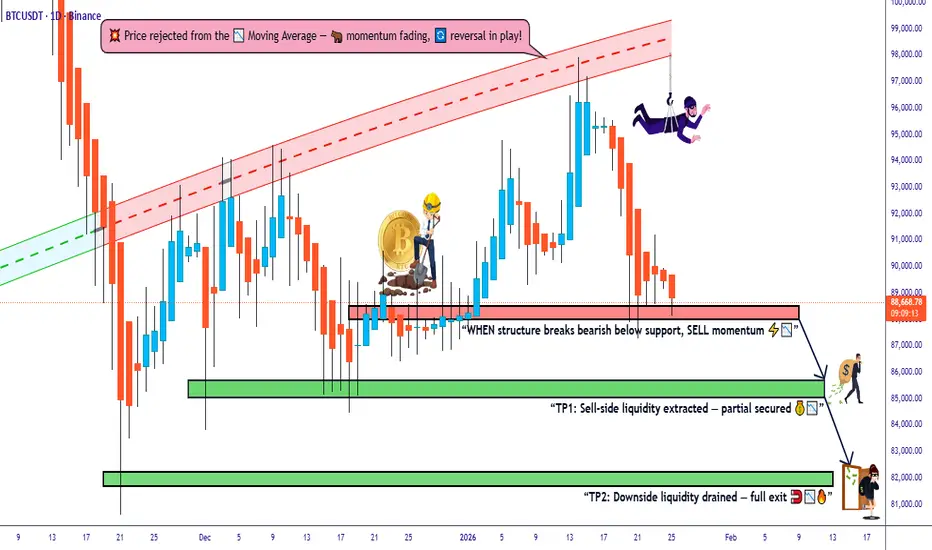
Bitcoin vs Tether: Structure Breakdown Trade Plan📊 BTC/USDT "BITCOIN VS TETHER" CRYPTO MARKET PROFIT PATHWAY SETUP 💰
🎯 TRADE TYPE: Day / Swing Trade - Bearish Bias w/ Bullish Rejection Signals
💡 REAL-TIME MARKET DATA (As of January 25, 2026) ✅
Bitcoin is currently trading around $88,516.85 USD, showing consolidation after recent volatility. BTC/USDT is down approximately 0.40% in the last 24 hours, with the market experiencing what analysts describe as a critical technical squeeze pattern.
🔥 TECHNICAL SETUP BREAKDOWN 🔥
📍 CURRENT PLAN: Bearish trend confirmed with multiple bullish rejection attempts at resistance zones
🎯 ENTRY ZONE: Support level breakout @ $88,000 📉
Pro Tip: Watch for volume confirmation on breakdown before entering position
🎯 TARGET 1: $85,500 (Initial profit-taking zone)
🎯 TARGET 2: $82,000 (Extended bearish target)
🛑 STOP LOSS: $91,000 placed at recent swing high resistance
⚠️ RISK DISCLOSURE ⚠️
Dear Trading OG's & Market Warriors 🏴☠️
These are MY technical levels based on current market structure. This is NOT financial advice! You're the captain of your own ship 🚢
✅ Your money, your rules, your responsibility
✅ Adjust TP/SL according to YOUR risk tolerance
✅ Never risk more than you can afford to lose
✅ Position sizing is KEY to survival in this game
📈 CORRELATED PAIRS TO WATCH 💎
Recent correlation data shows BTC exhibiting strong alignment with major cryptocurrencies, with Solana showing near-perfect correlation at 0.99, Ethereum at 0.89, and XRP at 0.86.
Monitor these pairs for confluence:
🔹 ETH/USDT (Ethereum) - Correlation: 0.89 | Trading ~$3,100
🔹 SOL/USDT (Solana) - Correlation: 0.99 (Almost identical movement!) | ~$175-$180
🔹 XRP/USDT (Ripple) - Correlation: 0.86 | Trading ~$1.89-$2.00
🔹 DOGE/USDT (Dogecoin) - Correlation: 0.87 | Meme power tracking BTC
🔹 ADA/USDT (Cardano) - Correlation: 0.86 | Parallel movement patterns
💡 KEY INSIGHT: The unusually high correlations suggest the market is moving in unison, with broad sentiment overriding individual asset characteristics. When BTC moves, expect these pairs to follow!
📰 FUNDAMENTAL & ECONOMIC FACTORS 🌍
🔴 CRITICAL MACRO EVENTS INFLUENCING THIS TRADE:
1️⃣ Regulatory Landscape Shift 🏛️
Institutional experts highlight that regulatory clarity, particularly the potential passage of the Digital Asset Market Clarity Act, could be a key driver for Bitcoin's recovery path. The CLARITY Act aims to establish the CFTC as the primary regulator for digital commodities and end "regulation by enforcement."
2️⃣ Institutional ETF Flows 💼
Bitcoin spot ETFs accumulated over $1.9 billion in net inflows during the first week of January 2026, showing continued institutional appetite despite price weakness. However, recent patterns show a $1.2 billion inflow followed by a $243 million outflow, typical of tight consolidation phases.
3️⃣ Bollinger Bands Squeeze Alert! 📊
Bitcoin's Bollinger Bands have narrowed to less than $3,500, the tightest compression since July 2025, signaling an imminent major price move in either direction. This technical pattern historically precedes significant volatility explosions.
4️⃣ Market Sentiment Analysis 😰
Current market sentiment shows "extreme fear" conditions, which can actually be a contrarian bullish indicator. Historically, periods of extreme fear have coincided with attractive entry points for long-term investors.
5️⃣ Interest Rate Environment 📉
Potential Federal Reserve rate cuts and a more accommodating monetary policy stance toward crypto could support Bitcoin in 2026, though geopolitical uncertainties and elevated equity valuations create a complex investing environment.
6️⃣ Expert Price Forecasts 🎯
Industry analysts forecast a wide range for Bitcoin in 2026, from lows of $75,000 to highs of $225,000, with major institutions like Standard Chartered and Citi projecting targets between $143,000-$150,000.
7️⃣ Supply-Demand Dynamics ⚖️
Corporate treasuries and sovereign reserves have absorbed Bitcoin's annual production by a factor of 4.7 in 2026, creating a significant supply-demand imbalance that could support long-term price appreciation.
🎲 UPCOMING CATALYSTS TO WATCH 📅
🔸 January FOMC Meeting - Fed policy decisions impacting risk assets
🔸 U.S. Midterm Elections (2026) - Political uncertainty factor
🔸 GENIUS & CLARITY Acts - Legislative developments
🔸 AI Investment Sustainability - Tech sector correlation effects
🔸 Geopolitical Tensions - Safe-haven vs risk-off dynamics
🧠 TECHNICAL CONFLUENCE CHECKLIST ✔️
✅ Multiple bearish rejections at resistance
✅ Support level identified at $88,000
✅ Volume analysis confirming selling pressure
✅ Bollinger Bands squeeze = volatility explosion incoming
✅ RSI positioned neutrally (room to move either direction)
✅ 720-day moving average intact at $86,000 as long-term support
✅ Key resistance cluster at $94,000-$95,000 zone
💪 PROFESSIONAL TRADER MINDSET 💪
Remember:
🎯 Plan your trade, trade your plan
🎯 Risk management > Being right
🎯 Markets reward patience and discipline
🎯 One trade doesn't define your career
🎯 Protect your capital like it's your last dollar
📢 FINAL THOUGHTS 🚀
This setup offers a defined risk-reward opportunity in a market experiencing historically low volatility that typically precedes major price movements. The confluence of technical patterns, institutional flows, and regulatory developments creates an intriguing setup for both day and swing traders.
Trade smart, not emotional! 🧠💎
🔔 LIKE, BOOST & FOLLOW FOR MORE PREMIUM SETUPS! 🔔
💬 DROP YOUR THOUGHTS IN THE COMMENTS! 💬
🚀 LET'S GET THESE GAINS TOGETHER! 🚀
#Bitcoin #BTCUSDT #CryptoTrading #TechnicalAnalysis #DayTrading #SwingTrading #CryptoSignals #TradingView #BTC #Cryptocurrency #PriceAction #SupportAndResistance #TradingStrategy #RiskManagement #BearishSetup #MarketAnalysis #CryptoMarket #BTCAnalysis 📊💰🎯
BTCUSD: Narrow range at highsBTCUSD is trading in an extremely narrow range at highs today, with clearly tiered core support and resistance levels. The trading strategy centers on waiting for a breakout with volume and following the trend, with strict position control enforced.
Core Support Levels:
Short-term (Intraday Core)88,500 USD (Strong Support): The lower boundary of the consolidation range, a critical bull-bear demarcation level for the short term. A break below this level requires volume confirmation to validate a weakening trend.
Medium-term (Daily Chart, Swing Reference)87,000 USD (Strong Support): The level of the previous consolidation platform, a key defensive position for swing bullish positions. A break below this level will open up further downside correction space.
Core Resistance Levels:
Short-term (Intraday Core)90,500 USD (Intraday Resistance): Today’s high, where pullbacks are likely to occur on rebounds and tests of this level.
Medium-term (Daily Chart, Swing Reference)93,000 USD (Strong Resistance): The upper boundary of the previous consolidation range, a key target for short-term rebounds. A breakout above this level will leave no significant technical resistance to the upside.

Bitcoin Short Term Sell Trading Opportunity SpottedH1 - Bearish trend in play
Two Solid Resistance Levels
Trend continuation very likely after pullback.
👉 If you enjoy this analysis, please Like, Follow, and Support the profile! Your engagement motivates us to share more quality setups.

Coinranger| BTCUSDT: Uncertainty after the drop🔥News
🔹The International Economic Forum continues. Trump's speech is at 16:30 (UTC+3)
🔥BTC
🔹We've clearly followed the forecast. Now:
1️⃣ It's still hard to say for sure about the levels above. Preliminary figures are 91600 and 92855. But we could fall into a flat for a while.
2️⃣ The price may reach 87550 before continuing the pullback. I haven't marked any lower levels yet, because we're unlikely to go there without a pullback.
The priority is a pullback; reaching the lower level is also possible.

BITCOIN The ultimate RSI Fibonacci cheat-sheet you MUST know.Bitcoin (BTCUSD) continues to consolidate within its 1W MA50 (blue trend-line) and 1W MA100 (green trend-line), a zone whose importance we've covered on various previous analyses. This time we re-introduce a old concept, which was always an integral part of our long-term Cycle analyses, the 1W RSI Channel.
As you can see, the 1W RSI has bounced on its 0.786 Fibonacci level, a trend-line where it always hits and rebounds historically (blue circles) before completing Stage 1 of the Bear Cycle. In the previous two Bear Cycles, this has coincided with the 1W MA50-100 consolidation. After that, the RSI rebounded and tested the 0.618 Fib (orange circles), which again in the last two Cycles coincided with a 1W MA50 test, and got rejected (initiating Stage 2) towards the bottom of the Channel for the eventual Cycle bottom (green circles).
As a result, it is likely to see one last rally for that 1W MA50/ 0.618 Fib rejection (unless the 1W MA100 breaks/ closes first) before the eventual Cycle bottom on Fib 1.0 (Channel bottom). That is expected to be on the 1W MA350 (red trend-line) at least ($50000), which is where the previous Cycle bottomed in November 2022.
So do you think that's a useful RSI cheat-sheet? Feel free to let us know in the comments section below!
---
** Please LIKE 👍, FOLLOW ✅, SHARE 🙌 and COMMENT ✍ if you enjoy this idea! Also share your ideas and charts in the comments section below! This is best way to keep it relevant, support us, keep the content here free and allow the idea to reach as many people as possible. **
---
💸💸💸💸💸💸
👇 👇 👇 👇 👇 👇

BTCUSD: Retracement from elevated levelsBTCUSD trended in a pattern of pulling back from highs and extending weak consolidation during the intraday session. Hit by the escalation of U.S.-EU tariff frictions, rising geopolitical risks and a sell-off in risk assets, the price plummeted sharply from the high of $95,500 and now hovers within the range of $87,000–$91,000. Market panic sentiment is mounting, bears hold the upper hand technically, and rebound momentum remains constrained.
Support Levels:
Short-term Strong Support: 87,000 (lower boundary of the intraday consolidation range, key support zone for rebounds)
Secondary Support: 86,000 (weekly moving average support, previous congestion zone)
Medium-term Support: 85,000 (defensive line for the medium-term trend)
Resistance Levels:
Short-term Strong Resistance: 91,000 (intraday rebound resistance level, bears’ defensive line)
Secondary Resistance: 92,000 (4-hour moving average resistance, key resistance for rebounds)
Medium-term Resistance: 95,000–96,000 (previous all-time high, a strong resistance zone dominated by bears)
Trading Strategy:
Buy 88000 - 88500
SL 87500
TP 90500 - 91000 - 92000
Sell 91000 - 91500
SL 92000
TP 89500 - 88000 - 87200

BTC/USD BEARISH SETUP TECHNICAL CHART ANALYSIS (2H)Key Resistance Zone
95,900 – 97,200
This zone aligns with:
Previous swing high
Supply zone
Upper boundary of the bearish structure
Rejection from this area confirms sellers are active.
Entry Zone
~95,300 – 95,400
Entry is valid after:
Weak bullish candles
Bearish rejection or breakdown from consolidation
This area acts as a retest of broken support.
Stop Loss
Above 97,200
Invalidates the bearish idea if price breaks and holds above resistance.
Targets
Target 1: 93,277
Previous support
Likely reaction zone (partial profit recommended)
Final Target: 91,100 – 91,000
Strong demand zone
Completion of bearish move

BITCOIN 1W Ichimoku just turned red. Massive Bear Cycle signal.Bitcoin (BTCUSD) has turned its 1W Ichimoku Cloud red following an impressive run of more than 2 straight years of green. Historically, every time this development took place, the market was already on a Bear Cycle.
Technically this is the latest signal to confirm the 2026 Bear Cycle and the last times it took place, BTC bottomed at -68% (on all cases) from the following High rejection on the 1D MA200 (black trend-line). Based on the current position of the 1D MA200 a -68% decline would have the market test $35k.
Since however BTC bottomed on its 1W MA350 (red trend-line) during its last Bear Cycle, we should be expecting to hit it again. Based on its current trajectory, that should take place on $55000 at least. And given the fact that since 2018, every Bear Cycle bottom is a +150 MA lower on 1W (2018 bottom on 1W MA200, 2022 bottom on 1W MA350), we can assume that the 1W MA500 (grey trend-line) could get hit. That creates a potential fair bottom zone within $55000 - $40000, for use of optimistic - pessimistic scenarios.
So do you think the 1W Ichimoku Cloud turning red has confirmed the Bear Cycle? Feel free to let us know in the comments section below!
---
** Please LIKE 👍, FOLLOW ✅, SHARE 🙌 and COMMENT ✍ if you enjoy this idea! Also share your ideas and charts in the comments section below! This is best way to keep it relevant, support us, keep the content here free and allow the idea to reach as many people as possible. **
---
💸💸💸💸💸💸
👇 👇 👇 👇 👇 👇

BTC/USD Price Framework Based on Structure and Liquidity🎯 BTC/USD Professional Trading Setup | Bitcoin vs US Dollar Analysis
💰 CRYPTO MARKET PROFIT PATHWAY SETUP (Day/Swing Trade)
📊 ASSET OVERVIEW
Trading Pair: BTC/USD (Bitcoin vs US Dollar)
Market: Cryptocurrency
Trade Type: Day Trading / Swing Trading
Strategy: Thief Layer Entry System (Multiple Limit Orders)
🔥 TRADE PLAN: BULLISH BIAS
🎯 ENTRY STRATEGY - "THIEF LAYERING METHOD"
This strategy utilizes multiple limit orders to capture optimal entry zones. You can enter at ANY price level, but recommended layer entries:
💎 Bull Limit Layer Entries:
Layer 1: $92,000
Layer 2: $93,000
Layer 3: $94,000
Layer 4: $95,000
Note: You can increase/decrease layers based on your risk appetite and capital allocation
🚨 TARGET ZONE - "POLICE FORCE RESISTANCE"
🎯 Primary Target: $105,000
Technical Reasoning:
Simple Moving Average (SMA) acting as strong resistance
Overbought conditions expected at this level
Correlation with traditional market resistance zones
Trap zone for late entries - ideal profit-taking area
⚠️ Disclaimer: Dear Ladies & Gentlemen (Thief OG's), I'm NOT recommending you set ONLY my TP. This is YOUR trade - take profits at YOUR own risk and comfort level! 💪
🛑 STOP LOSS - "THIEF PROTECTION ZONE"
🔒 Stop Loss: $89,000
⚠️ Disclaimer: Dear Ladies & Gentlemen (Thief OG's), I'm NOT recommending you set ONLY my SL. Risk management is PERSONAL - protect your capital at YOUR own discretion! 🛡️
🔗 CORRELATED PAIRS TO WATCH
Monitor these pairs for correlation signals and market confirmation:
ETH/USD (Ethereum) - $3,200-$3,500 range
Key Point: ETH typically follows BTC momentum with 70-80% correlation. Strong ETH moves confirm BTC direction.
SPX/USD (S&P 500) - Watch $5,900-$6,000 levels
Key Point: Risk-on sentiment in equities = bullish crypto flow. Inverse correlation during risk-off.
DXY (US Dollar Index) - Monitor 108-110 range
Key Point: Inverse correlation - Weak dollar = Strong BTC. Dollar strength = BTC pressure.
GOLD/USD (XAU/USD) - $2,650-$2,700 zone
Key Point: Both are "alternative assets" - Gold strength indicates inflation hedge demand, bullish for BTC.
NDX/USD (NASDAQ 100) - Tech correlation
Key Point: BTC trades like a risk asset - Strong NASDAQ = Bullish crypto sentiment.
📰 FUNDAMENTAL & ECONOMIC FACTORS
🌍 CURRENT ECONOMIC LANDSCAPE (Real-Time Considerations)
🔴 Key Factors Influencing BTC/USD:
🏦 Federal Reserve Policy
Current Fed stance on interest rates (January 2026)
Monetary policy direction impacts risk assets
Watch FOMC meeting minutes and statements
📊 Inflation Data (CPI/PPI)
High inflation = BTC bullish (inflation hedge narrative)
Low inflation = Possible risk-off, pressure on crypto
Next CPI release dates are critical
💵 US Dollar Strength (DXY)
Strong dollar = Bearish for BTC (inverse correlation)
Weak dollar = Bullish for BTC
Current DXY trending near multi-month highs/lows
🏛️ Regulatory Environment
SEC crypto regulation developments
Bitcoin ETF flows and institutional adoption
Global crypto legislation updates
⚡ Bitcoin-Specific Fundamentals
Hash rate and network security
Exchange inflows/outflows (whale movements)
Mining difficulty adjustments
Institutional accumulation patterns
📅 UPCOMING NEWS EVENTS TO WATCH
US Economic Data: GDP, Employment reports, Retail sales
Fed Speeches: Any commentary from Powell or voting members
Crypto Regulations: SEC announcements, ETF decisions
Global Risk Events: Geopolitical tensions affecting risk appetite
Tech Earnings: Major tech companies (correlate with BTC sentiment)
⚡ TECHNICAL CONFLUENCE
✅ Bullish Indicators:
Layer entry zones align with demand areas
SMA resistance provides clear target structure
Risk/Reward ratio favorable with defined SL/TP
⚠️ Risk Considerations:
Overbought conditions at target zone
Potential trap for late entries above $105K
Macro economic headwinds could shift sentiment
💡 THIEF OG'S PHILOSOPHY
🎯 "Make Money, Take Money, Manage Risk"
This isn't financial advice - it's a technical framework for disciplined traders. Your capital, your rules, your responsibility!
🚀 Trade smart, layer entries, respect the plan, and let the market pay you!
🔔 ENGAGEMENT CALL
👍 Like if this setup resonates!
💬 Comment your entry layers and targets!
🔄 Share with fellow Thief OG's!
⭐ Follow for more professional crypto setups!
📈 Good luck, Thief OG's! May the profits be with you! 💎🙌

BTCUSD Intraday AnalysisBTCUSD traded in a pattern of retesting support followed by consolidation intraday, maintaining a high-range oscillation overall with the bullish structure remaining intact. The core intraday tussle focused on the 94,000–96,000 range, where profit-taking flows and support buying coexisted in balance.
Intraday Short-term Levels:
Support Levels:
94,200–94,300 (Strong Support): Confluence of intraday lows, short-term neckline and the 0.618 Fibonacci retracement level, with effective buying interest confirmed by multiple retests.
94,800–95,000 (Medium Support): Lower boundary of the consolidation range, acting as a secondary key defense zone for short-term bulls.
Resistance Levels:
95,700–95,800 (Strong Resistance): Confluence of intraday highs and previous swing highs; a decisive breakout requires significant volume confirmation.
96,000–96,500 (Medium Resistance): Psychological level plus previous congestion zone, exerting marked downward pressure on price action.
Trading Strategy:
Buy 94800 - 95000
SL 94000
TP 95500 - 96000
Sell 95800 - 95600
SL 96000
TP 95000 - 94500

#BTC/USD Weekly Update Rally to $106k but still Scary!!BTC Weekly:— sharing an honest view, and I’m open to being wrong unless proven otherwise.
There could be another move toward $100k–$106k, but the structure suggests it may turn into a trap.
Given the current conditions, focusing on scalping high-volume coins with clear invalidation levels, tight stop losses, and modest targets seems more prudent.
Holding positions for the long term doesn’t appear optimal in this kind of market.
Still, always do your own research, NFA!
Thank you
#PEACE

BITCOIN Ultimate Rainbow Cycle AnalysisBitcoin (BTCUSD) is headed towards a 1D MA200 rejection, which as mentioned is what historically kickstarts Phase 2 of the Bear Cycle.
This excellent indicator that illustrates not only the Halving events but also the most optimal Sell and Buy levels based on the Fibonacci Time extension levels shows that the next point of interest is the 4.618 Fibonacci Time extension on the final week of September 2026, where the Cycle is expected to bottom.
With the next Halving estimated in April 2028, we will still be far from the start of the Profit Taking Zone (green vertical layers), which historically starts taking place around 38 weeks (266 days) after the Halving, but the 4.618 Time Fib its technically ideal for long-term buying again. Based on this model the price should be at least at $60000 by that time.
We also see that the price didn't even reach the orange Rainbow Wave on this Bull Cycle, confirming the Law of Diminishing Returns. But the timing of the Fibonacci Time extensions, as we first did more than 7 years ago, worked again to perfection. And this is why on this market (and as a matter of fact on most of them), it is more important to plan buying and selling based on time rather than absolute prices.
So are you expecting this Bear Cycle to have ended by October 2026 and will it reach at least $60000? Feel free to let us know in the comments section below!
---
** Please LIKE 👍, FOLLOW ✅, SHARE 🙌 and COMMENT ✍ if you enjoy this idea! Also share your ideas and charts in the comments section below! This is best way to keep it relevant, support us, keep the content here free and allow the idea to reach as many people as possible. **
---
💸💸💸💸💸💸
👇 👇 👇 👇 👇 👇

BITCOIN Fear & Greed index goes ‘greed’ first time since OctoberBitcoin (BTCUSD) Crypto Fear & Greed index turned to greed for the first time in 3 months. Technically this was confirmed by BTC breaking (and closing) above its 94650 Resistance for the first time in 2 months.
With the 1D MA50 (blue trend-line) turning into a Support and getting confirmed by holding upon the January 08 test, we can see the emergence of a short-term Channel Up.
As we've explained for over a month now, this is potentially the typical market reaction that previous Bear Cycles have done historically, where after completing the first strong decline that gets most of investors off guard, it makes the first counter-trend rally (dead cat bounce) that technically tests the 1D MA200 (orange trend-line). This time, the rebound is being made after the 1W MA100 (red trend-line) got tested and held.
With the 1D RSI about to enter the Overbought Zone (70.00 and above), where the last two times (October 06 and July 14 2025) it got rejected, we may see the current Bullish Leg of the Channel Up extending to around +17.50% (where the previous one was rejected), make a Higher High, then pull-back to re-test the 1D MA50 and then finally go for the benchmark test of the 1D MA200.
We estimate a potential Bear Cycle rejection Zone within $102000 - 105000, before the Cycle starts Phase 2 with a new long-term sell-off.
Do you think that's a realistic scenario to repeat the historic pattern? Feel free to let us know in the comments section below!
---
** Please LIKE 👍, FOLLOW ✅, SHARE 🙌 and COMMENT ✍ if you enjoy this idea! Also share your ideas and charts in the comments section below! This is best way to keep it relevant, support us, keep the content here free and allow the idea to reach as many people as possible. **
---
💸💸💸💸💸💸
👇 👇 👇 👇 👇 👇

XRP/USDT | Bullish Breakout + Structure Holding📈 XRP/USDT — Bullish Breakout Pathway Activated!
RIPPLE vs TETHER | Crypto Market Trade Opportunity (Day / Swing)
🔍 Market Overview
XRP/USDT is showing strong bullish intent after a confirmed moving average breakout followed by a healthy retest. Price structure remains constructive, suggesting momentum continuation if buyers maintain control above key zones.
This setup is designed for both Day Traders & Swing Traders, with a layered entry strategy for risk-controlled positioning.
🧭 Trade Plan – Bullish Bias
✅ Trend Direction: Bullish
✅ Confirmation: Moving Average Breakout + Retest
✅ Momentum: Buyers defending structure with volume stability
🎯 Entry Strategy (Layered Execution)
📌 Entry Type: Flexible / Any price level entry using Layering Method
Thief Layer Strategy (Bullish Limit Zones):
🟢 Buy Limit 1: 2.0500
🟢 Buy Limit 2: 2.1000
🟢 Buy Limit 3: 2.1500
➡️ Traders may add or adjust layers based on personal risk management and timeframe.
This approach helps average entries efficiently during pullbacks while aligning with the higher-timeframe trend.
🏁 Target Zone
🎯 Primary Target: 2.4000
📊 Rationale:
Moving Average acting as dynamic resistance (Police Force Zone)
Market currently showing overbought behavior near resistance
Possible liquidity trap & correlation pressure expected near highs
💡 Action: Partial profits recommended near resistance zones to protect gains.
🛑 Stop Loss (Risk Control)
🔴 Stop Loss: 2.0000
⚠️ This SL is based on structure invalidation, not emotion.
Each trader may customize SL placement according to account size and risk tolerance.
📌 Risk Disclaimer
Dear Ladies & Gentlemen,
This trade plan is not financial advice.
You are free to secure profits or manage risk according to your own strategy and discipline.
🔗 Related Pairs to Watch (Correlation Insight)
Monitoring correlated assets helps confirm strength or weakness in XRP:
COINBASE:XRPUSD 💵 – Dollar-based momentum confirmation
BINANCE:BTCUSDT 🟠 – Overall crypto market direction & risk sentiment
BINANCE:ETHUSDT 🔷 – Altcoin flow & capital rotation signal
CRYPTOCAP:USDT.D 📉 – Tether dominance (falling dominance = bullish for alts)
📌 Key Insight:
If BTC & ETH remain stable or bullish, XRP continuation probability increases.
Rising USDT dominance may signal temporary risk-off behavior.
🌍 Fundamental & Economic Factors to Monitor
📰 Crypto-Specific Drivers
Ripple ecosystem updates & adoption news
Regulatory clarity surrounding XRP
On-chain volume & wallet activity trends
🌐 Macro & Economic Factors (Global)
U.S. Dollar strength (DXY impact on crypto liquidity)
Central bank tone (risk-on vs risk-off sentiment)
Crypto ETF flows & institutional participation
📆 High-Impact Events to Watch
Major U.S. macroeconomic releases
Central bank statements affecting risk assets
Sudden volatility in BTC dominance
📌 Pro Tip: Always check economic calendars & crypto news feeds before entry or scaling.
⭐ Final Note
This setup combines technical structure, layered execution, correlation analysis, and macro awareness — built for disciplined traders who respect both profit and protection.
👍 If this idea adds value, boost with a like
💬 Share your execution thoughts in comments
🔔 Follow for more structured market pathways
Trade smart. Manage risk. Let structure lead. 🚀

Bitcoin Aligns With Bullish Trend Metrics — What’s Next?🚀 BTC/USD — Bitcoin vs Tether | Bullish Profit Pathway (Day/Swing) 📈
Asset: BTCUSD — Bitcoin vs Tether (Realtime live price feed) 📊
✅ Bullish Setup Confirmed
Bullish trend confirmed with Hull Moving Average breakout — structure shift on higher timeframes. Momentum signals showing accumulation near support zones. 🟢
🎯 Trading Plan — Entry (Layer Strategy)
Thief strategy: A layered limit entry style method (multi-limit entries):
✅ Layer 1: ~93,000
✅ Layer 2: ~94,000
✅ Layer 3: ~95,000
➡️ Add additional layers as per your risk profile and real-time order flow.
Why layering? Better average price, less slippage, more control over drawdowns.
📌 Target & Notes
🔹 Primary Target: ~99,000 — key resistance & overbought trap zone 🛑
🔹 Monitor reaction at overhead supply / previous swing highs.
🔹 Lock partial profits into reaction zones — don’t be greedy, protect capital.
🔹 Important: You choose your own TP & RR (risk/reward) depending on your play style.
🛑 Stop Loss
💥 Thief SL Zone: ~92,000
➡️ This is a structural invalidation level for this bullish scenario.
✅ Adjust based on your risk tolerance — your risk, your money.
🔗 Pairs to Watch & Correlations 🔎
📌 ETH/USD (Ethereum) — often correlated with BTC swings — if ETH breaks key structure, BTC bias can extend.
📌 BTC/USDT & BTC/EUR — cross-pairs reveal strength vs USD/dollar index behaviour.
📌 S&P 500 / NASDAQ Indexes — crypto sentiment often mirrors risk asset flows.
📊 Technical Levels / Key Zones
✔ Support Range: 90,000–92,500 — critical accumulation band. 📉
✔ Resistance — watch reactions near 99,000+ and breakout extension zones.
✔ EMAs / MACD / RSI — confirm entry and momentum continuation. 📈
📊 Fundamental & Macro Factors — Real-Time News (London Time)
📰 Inflation & CPI Impact: BTC rallied through ~$92k after U.S. CPI inflation held lower, sparking renewed Fed rate-cut expectations — supportive for risk assets like Bitcoin.
📰 Safe-Haven Demand: Softer US inflation + geopolitical tensions are boosting Bitcoin demand near $95k.
📰 Institutional Demand: ETF inflows & broader institutional traction continue to underpin structural support.
📌 Upcoming Watchlist:
👉 FOMC / Fed rate announcements — major macro driver.
👉 U.S. CPI / PPI releases.
👉 Dollar Index (DXY) movement — inversely influences BTC sentiment.
👉 ETF flow reports & regulatory headlines.
📌 Risk Management Reminder
⚠️ This idea is educational — do your own analysis (DYOR). Manage position sizing and risk per your plan.
📌 Discipline > Emotion. Keep a trading journal.
🙌 Happy trading Thief OG’s — let the charts speak. 💎

BITCOIN (BTCUSD): Road to 100k
Bitcoin finally completed a bullish accumulation within
a huge ascending triangle pattern on a daily..
There is a high probability that the market will continue
rising now.
The next strong resistance cluster is 98800 - 101200 area.
I think that it will be reached soon.
❤️Please, support my work with like, thank you!❤️
I am part of Trade Nation's Influencer program and receive a monthly fee for using their TradingView charts in my analysis.

Bitcoin (BTC/USD) – Rising Wedge Breakdown Setup 3H TimeframeRising Wedge
Upper trendline: Acting as resistance
Lower trendline: Rising support
Price is now near the upper boundary, where rejection is common.
This structure typically resolves to the downside, especially after a strong uptrend.
Key Levels
Resistance
92,800 – 93,200 → wedge resistance + recent highs (entry zone marked)
94,500 – 95,000 → major rejection zone if price spikes higher
Support / Targets
1st Target: ~89,000
Previous structure support
Psychological level
Final Target: ~86,500 – 87,000
Strong horizontal demand
Prior consolidation base

BITCOIN This is one of the best indicators for buying the bottomBitcoin (BTCUSD) continues to consolidate during these (almost) past 2 months as it is headed towards a 1W MA50 (blue trend-line) test, where it was rejected on the last Bear Cycle and started its Stage 2. This Stage is what typically leads to the Cycle bottom, which is essentially the most optimal level for a long-term investor to enter/ buy.
One of the best indicators to call out a Cycle bottom is the Net Unrealized Profit Loss (NUPL). As you can see (black trend-line), when this has historically hit its green line, BTC was on excellent buy opportunity levels (green vertical zones) as the Bear Cycle bottom was priced immediately after.
The last Cycle bottom also happened to be exactly on the 1W MA350 (red trend-line), which the March 2020 COVID flash crash also approached. As a result, it would be no surprise to see BTC hit that level on the next Cycle bottom as well, which according to its current trajectory, this test could be around $50000. But as mentioned, the strongest buy indication would be the NUPL touching its green trend-line regardless of BTC's price at the moment.
So what do you think? Will the NUPL be a indicator that you will look out for? Feel free to let us know in the comments section below!
---
** Please LIKE 👍, FOLLOW ✅, SHARE 🙌 and COMMENT ✍ if you enjoy this idea! Also share your ideas and charts in the comments section below! This is best way to keep it relevant, support us, keep the content here free and allow the idea to reach as many people as possible. **
---
💸💸💸💸💸💸
👇 👇 👇 👇 👇 👇
BITCOIN drops by more than -60% when this signal flashes.Bitcoin (BTCUSD) has closed the last 2M candle on a MACD Bearish Cross. Every time this has happened historically (2 times), Bitcoin has dropped by -67.66% and -68.75% from he top of that candle.
If history is repeated, a new -67.66% would deliver $36500 as the bottom of the current Bear Cycle. This time though, that would be below the MA50 (blue trend-line), so a range of 44500 - 36500 might be more appropriate.
In any case, this latest Bearish Cross comes as another confirmation of a 2026 Bear Cycle.
So are you expecting BTC to fall more than -60% from here? Feel free to let us know in the comments section below!
---
** Please LIKE 👍, FOLLOW ✅, SHARE 🙌 and COMMENT ✍ if you enjoy this idea! Also share your ideas and charts in the comments section below! This is best way to keep it relevant, support us, keep the content here free and allow the idea to reach as many people as possible. **
---
💸💸💸💸💸💸
👇 👇 👇 👇 👇 👇

BTCUSD Spikes Post-NFP, Then Pulls BackThe core trend of BTCUSD is high-level consolidation with weak upward momentum and supported pullbacks. It has been consolidating narrowly around the $90,500 mark intraday, and is overall trapped in a tug-of-war range between the key resistance at $91,000 and the psychological support at $90,000. The probability of sideways trading over the weekend remains high.
After the release of the U.S. nonfarm payrolls data on Friday, BTCUSD surged to around $91,960, then retreated under the pressure of profit-taking and a stronger U.S. Dollar. A long upper shadow formed on the daily chart, indicating strong resistance around the $92,000 level. During the pullback, the $90,000 threshold platform provided solid support, with no breakdown accompanied by heavy trading volume.
Support Levels:
$90,000 (psychological level, short-term bullish defense line)
$89,600–$89,800 (recent low platform, key support)
$89,000 (secondary strong support)
Resistance Levels:
$91,500–$92,000 (intraday high and recent key resistance zone)
$93,600 (upper band of the daily Bollinger Bands, medium-term resistance)
Trading Strategy:
Buy 90000 - 90500
SL 89500
TP 91000 - 91500
Sell 91500 - 92000
SL 92500
TP 90500 - 90000
