BTCUSDT.P SHORTBTCUSDT.P SHORT
The market has the potential for an downtrend
Price: 112383.0 $
Main target 110522.0 $
SL 114858.5 $
BTCUSDT

BTC 1H Box Breakout Setup | D1👋 Hey everyone! Hope you’re doing great!
💥 Welcome to Satoshi Frame — today we’re diving into the 1-hour Bitcoin analysis. Stay tuned and follow along!
👀 On the 1-hour timeframe of Bitcoin, we can see that after its recent drop, Bitcoin has entered a one-hour consolidation box. The top of this box is around $115,802, and the bottom is at $110,224. A breakout from this box could lead to the next impulsive move. Currently, Bitcoin’s price is near the midline of the box at $113,222 — and if it breaks and stabilizes above this level, Bitcoin could start moving toward the top of the box and potentially break above it.
Notice that Bitcoin reacted to the buyer-maker zone near the bottom of the box, showing a reversal pattern. With buying pressure pushing it upward and a higher low forming, the probability of a midline breakout has increased.
🧮 Looking at Bitcoin’s RSI oscillator, it’s currently near the static resistance around the 54 range. If RSI breaks and stabilizes above this level, long-trade momentum is likely to increase, which could help Bitcoin break through the midline and become more bullish.
🕯 Let’s first discuss the maker-buyer zone, which acts as a major support area for buyers and institutions that accumulate their positions here. This area tends to create counter-direction reactions in Bitcoin. Right now, Bitcoin has formed a higher low just below the midline and is showing increasing buying volume, with larger candle sizes appearing on the chart.
🧠 For Bitcoin’s trading setup, once the midline breaks, we can consider entering a position, forming a potential long scenario:
↗️ Long Position Scenario:
If Bitcoin breaks and stabilizes above $113,222, accompanied by an RSI breakout above 54 and a rise in buying volume, it could move toward the top of the box and provide a solid long opportunity.
❤️ Disclaimer : This analysis is purely based on my personal opinion and I only trade if the stated triggers are activated .

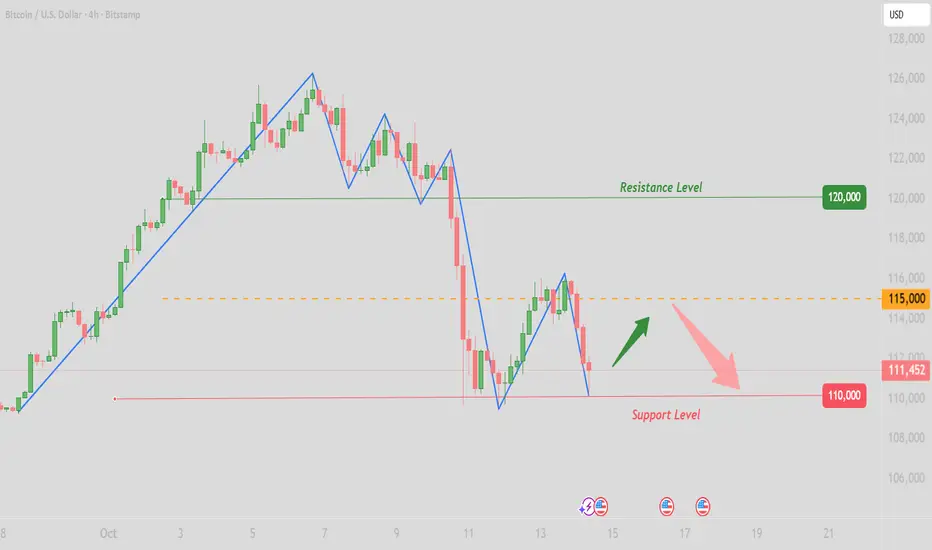
BTC/USD (4H Analysis) — October 15, 2025Bitcoin is currently consolidating below the minor supply zone (113.5K–114.5K) and above the local demand zone (110.8K–111K).
The overall market structure remains bearish, with clear lower highs and lower lows forming after a strong rejection from the major supply zone at 120K–122K.
Key Zones
🟥 Major Supply: 120K–122K → heavy distribution zone from previous top.
🟥 Minor Supply: 113.5K–114.5K → short-term retest area.
🟩 Major Demand: 108K–110K → strong support area where buyers are likely to step in.
Main Scenario (Bearish Bias)
- Price may retest the 113.5K–114.5K zone soon.
- If a bearish rejection or engulfing candle forms, BTC could extend its drop toward 108K–110K.
Alternate Scenario (Bullish Reversal)
- If BTC closes above 115K (4H), the bearish structure invalidates, opening the path toward 118K–120K.
If you find this analysis helpful :
👉 Follow for more BTC & market updates,
💬 Share to help others stay informed,
❤️ Like to support and keep this research going!

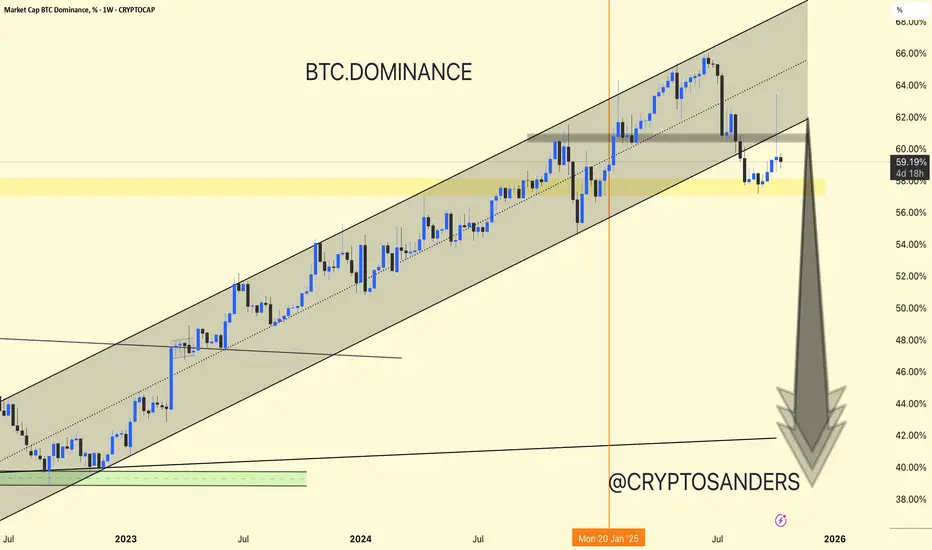
Chart Overview (BTC.D – Weekly Timeframe). Chart Overview (BTC.D – Weekly Timeframe)
Current Level: ~59.24%
Trend: BTC dominance is still moving within a long-term ascending channel, but recently retested the lower boundary after encountering resistance around 64-65%.
Retest of Rising Channel Support:
BTC dominance touched the lower trendline of the ascending channel and found short-term support near the 58% area (marked in yellow).
Resistance Area (60-62%)
The chart shows a gray resistance area where dominance was previously rejected. This area is crucial for confirmation.
If BTC.D does not close above this, we could see further downside movement.
Potential Downside Ahead:
The large downward arrow indicates a potential correction phase, targeting the 50-45% dominance levels – a scenario that typically benefits altcoins (altseason signal).
Support Zone: 56-58%
Resistance Zone: 60-62%
Potential Downside Target: Around 45%
Trend Structure: Still bullish in the long term, but bearish momentum is possible in the short term.
If BTC dominance decreases, it means altcoins could strengthen.
If BTC dominance increases again, Bitcoin will continue to outperform altcoins.
BTC dominance is strengthening after a long bullish run.
If it fails to reach 60-62%, a trend toward altcoins is expected in the coming weeks.
DYOR | NFA

Mr Wyckoff, is that really you?Just a question folks. Don't shoot the messenger. Mr. Wyckoff loves to surprise the market. When they least expect it, he'll jump out and scare the hell out of everyone.
✌️Stew

Bitcoin - It is either $50.000 or $1.000.000!🪅Bitcoin ( CRYPTO:BTCUSD ) remains undecided:
🔎Analysis summary:
For the past couple of months, Bitcoin has been consolidating. With the two recent all time highs, we could see a similar pattern to what we saw back in 2021, followed by a bear market. But so far, Bitcoin remains bullish with the underlying trend continuation.
📝Levels to watch:
$1.000.000, $50.000
SwingTraderPhil
SwingTrading.Simplified. | Investing.Simplified. | #LONGTERMVISION

BTC aligns with my forecast📝BTC continued to decline today but encountered support above the $110,000 level and staged a slight rebound. We reminded traders to take profits in a timely manner around the $110,200 mark and urged them not to blindly chase the downward move. We also advised that if the price continued to drop to around $110,000, traders could consider entering small-position long trades, but they must set stop-losses properly.
💎Subsequently, Bitcoin’s trend fully aligned with our forecast—it rebounded and rose from around $110,200. For those traders who just established long positions following our advice, they can now also choose to take profits and avoid blindly chasing the upside to prevent losses.
BITCOIN TOP NOT IS INBitcoin Top Not Is In. 🔃
CRYPTOCAP:BTC hasn't even broken above the logarithmic curve resistance yet, so there's no doubt the parabolic run will continue.
As in previous cycles, the market gained momentum quickly when this curve was broken.
Moreover, the RSI isn't even in the overbought zone (72) yet.
Furthermore, parabolic movements continued when the RSI major downtrend was broken in 2017.
A similar pattern is observed today but the breakout hasn't occurred yet.
The bigger picture tells us that the real run hasn't yet begun, and the current levels only represent the threshold.
In this cycle, a post breakout parabolic phase seems inevitable.

Why This BTC Price Action Doesn’t Inspire ConfidenceIn my yesterday’s analysis, I raised a rhetorical question: I s Bitcoin in a corrective rebound, or are we witnessing a genuine upside reversal?
Even in my Sunday educational post, I mentioned that the whole “ great reset, now we go up ” narrative doesn’t resonate with how I view trading.
At the time of writing, BTC is down again around 112K, after touching once more the 110K support zone — almost like a second chance for those who missed the first dip.
However, this kind of price action is far from encouraging in my opinion.
________________________________________
Technical Picture
• The price reversed before the 118K resistance, forming what can now be viewed as a lower high.
• If the 110K level breaks, the next obvious target remains 100K, both from a psychological and technical perspective.
________________________________________
Trading Plan
My plan is to sell preferably around the recent high, aiming to position with the broader structure rather than chase short-term fluctuations.
BTC still needs to prove it can sustain an uptrend — until then, rallies look like selling opportunities rather than the start of a new bull leg.
BTCUSDT Supply-Demand Confirmation LongSee chart for analysis.
I don't trade bitcoin so this is mainly based off technicals.

BTC 1DBTC is not in a good shape totally but it would be bullish until the shown date in my opinion ( 10/17)
possible path/prices is visible on chart

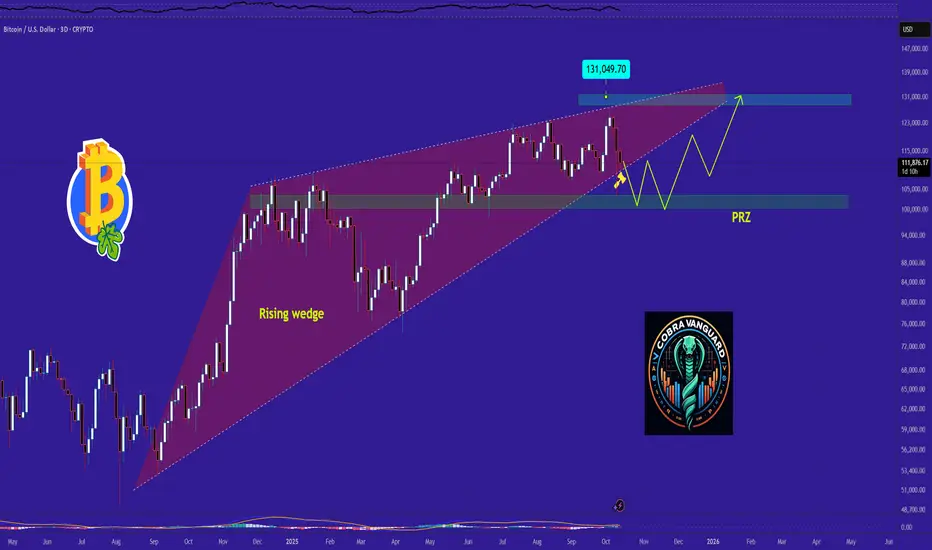
BTC Outlook after the Dip. What to expect NOW?The recent drop in Bitcoin could continue to impact the market for quite some time.
This increases the likelihood of a breakdown from the descending wedge pattern, potentially pushing the price down toward the PRZ (Potential Reversal Zone), which is estimated around $99K.
Once price reaches the PRZ, a strong pump may follow. follow us for more update
Bitcoin is going to the hell???hi follow me , boost this post and read
everything shows me that bull trend is over , weakness in highs , candles and the momentum
the targets for retracement is 83 to 74 and after that 50k
i know its hard to hear that but this is market he do what he wants so accept it.
thank you. i reply to questions anytime.

BTC Bitcoin & Crypto Selloff Alert: Is a Second Wave Imminent?If you haven`t bought BTC before the rally:
The cryptocurrency market is still reeling from the brutal sell-off on Friday, October 10, 2025, triggered by U.S. President Donald Trump's announcement of 100% tariffs on Chinese imports. Bitcoin plummeted below $105,000, Ethereum dropped over 16% to under $3,700, and the broader market saw liquidations exceeding $19 billion—the largest single-day wipeout in crypto history, nine times bigger than February 2025's crash.
While Monday and Tuesday brought some recovery, with Bitcoin climbing back above $115,000 and the total market cap topping $4 trillion, underlying issues like inflated trading volumes, massive altcoin losses, and a prominent whale re-entering a short position suggest this might just be a dead-cat bounce. This article explores why a second leg down could be imminent, incorporating technical analysis for TradingView users eyeing volatility plays.
The Friday Flash Crash: A Perfect Storm Amplified by Fake Volumes
The October 10 crash unfolded rapidly, with Bitcoin shedding nearly 10% in hours and over $200 billion erased from the market cap. But what made the drop so severe, especially for altcoins?
A key culprit: fake trading volumes driven by wash trading. Wash trading, where traders buy and sell the same asset to themselves to inflate volumes, creates the illusion of liquidity and interest without real economic activity. Estimates suggest that up to 87-88% of crypto volumes are fake, often used in pump-and-dump schemes or to lure retail investors.
In thin markets like crypto, these artificial volumes mask true liquidity. When real selling pressure hit—amplified by leveraged positions and the tariff news—exchanges like Binance saw cascading liquidations due to flawed margin systems. This "flash crash" wiped out $600–900 million in longs alone, but the fake volumes meant the market couldn't absorb the shock, leading to exaggerated drops.
Analysts note that such illusions persist in 2025, with AI tools now exposing them, but regulators lag behind. If volumes remain overstated, any renewed catalyst could trigger another liquidity vacuum, setting up a second leg down.
Altcoin Bloodbath: 50–90% Drops Expose Vulnerabilities
While Bitcoin and Ethereum recovered somewhat, altcoins bore the brunt of the carnage. An index tracking altcoins (excluding BTC, ETH, and stablecoins) cratered about 33% in just 25 minutes, with some tokens plunging 50–90%. Tokens like Solana, XRP, and Dogecoin lost 20–60%, but lesser-known altcoins saw even steeper declines, highlighting the sector's over-leveraged and illiquid nature.
This disproportionate pain stems from altcoins' reliance on hype and speculative inflows, often propped up by those same fake volumes. In a risk-off environment, capital flees to safer assets like Bitcoin, whose dominance spiked during the crash.
Altseason indicators are now cooling (76–78 previously).
Bitcoin dominance dropped below 59% post-crash.
If earnings season in traditional markets reveals economic weakness, spilling over to crypto, altcoins could lead the next sell-off wave, potentially dropping another 20–50% if support levels break.
The Whale Factor: $192M Profit, Then Re-Entry Signals Bearish Conviction
Adding fuel to the fire is a mysterious crypto whale who timed the crash impeccably. Just 30 minutes before Trump's tariff announcement, this entity opened a massive short position on Bitcoin, pocketing $192 million in profits as the market tanked.
Speculation abounds: Was it insider knowledge, or just savvy trading? Either way, the whale didn't stop there—they've re-entered with another short, increasing their position to $340 million, and even opened a fresh $163 million bearish bet.
Other whales have followed suit, including:
A Satoshi-era entity shorting $1.1 billion before the news
An OG whale opening a $392 million short
These moves suggest high conviction in further declines, possibly tied to ongoing trade tensions or macroeconomic risks. In a market where whales can move prices, this re-entry could catalyze the second leg, especially if it triggers more liquidations.
My price target for Bitcoin is $95K

BTC: The downward momentum is strongBTC has seen significant price volatility today. After hitting a high, it encountered heavy selling pressure, leading to a sharp pullback. From the candlestick chart, Bitcoin’s price and the previous high have together formed a potential "M-top"pattern—a classic bearish reversal signal. The market’s short-term trend has shifted from bullish to bearish, with strong downward momentum. Additionally, the price is trading below all short-term moving averages, further indicating a weak market structure.
In the short term, BTC’s downward trend is clear and market sentiment remains cautious. Short-term investors are advised to stay on the sidelines for now and avoid blindly bottom-fishing. If the price continues to drop to around the 110,000 level, a small-position long entry could be considered, but a stop-loss must be set properly—for example, if the price breaks below 109,000, investors should exit promptly to limit losses.
Despite the significant short-term price fluctuations, Bitcoin’s long-term fundamentals have not undergone any fundamental changes. Weekly and monthly capital flows still show net inflows. Long-term investors can continue to hold their existing positions and do not need to trade frequently due to short-term volatility.
Sell 113000 - 113500 TP 112500 - 112000 SL 113800
Daily-updated accurate signals are at your disposal. If you run into any problems while trading, these signals serve as a reliable reference—don’t hesitate to use them! I truly hope they bring you significant assistance

TradeCityPro | Bitcoin Daily Analysis #196👋 Welcome to TradeCity Pro!
Let’s go over Bitcoin's analysis. The price is moving down again, so let’s review Bitcoin's movement together.
⏳ 1-Hour Timeframe
Yesterday, we had a trigger at the $115,698 zone, but the price couldn't sustain above this level, and Bitcoin's downward movement has started again.
✔️ A double top pattern has formed in this timeframe, and the trigger for this pattern activation was $113,991, which has now been activated. With the large volume, the price has managed to stabilize even below the $111,278 zone.
💥 The RSI oscillator has once again entered Oversell, and the price has reached near our support zone.
⚡️ If this support zone is broken, we can open a short position. Otherwise, I won’t be opening any short positions with other triggers.
📈 For a long position, we need a very strong reaction and significant bullish momentum at the support zone. In this case, the main trigger for a long would be $115,698, but we can also use earlier triggers if they form.
📊 For now, I will wait to see how the price reacts to the zone and then look for the trigger. The only trigger I have at the moment is $115,698.
❌ Disclaimer ❌
Trading futures is highly risky and dangerous. If you're not an expert, these triggers may not be suitable for you. You should first learn risk and capital management. You can also use the educational content from this channel.
Finally, these triggers reflect my personal opinions on price action, and the market may move completely against this analysis. So, do your own research before opening any position.

BITCOIN – WAIT FOR ARBITRAGE TO BALANCE SPOT MARKETSTraders,
What a week it’s been. A lot of people got rekt, and I hope you were on the right side of the move. If not, it’s fine: this is how markets reset. I’ve been getting a lot of questions about what comes next, so here’s my current view.
The Situation
Binance/USDT wicked down to 102,000
Binance/USD wicked to 107,485.59
Coinbase/USD wicked to 107,000
That’s roughly a $5,000 difference, or about 5%, which is huge for major spot markets.
Under normal conditions, spreads between top venues like Coinbase and Binance are usually below 1% (Bitwise, 2019 SEC Study on Real Bitcoin Trading Volume - for the nerds interested ;)).
Why It Matters
Both Binance and Coinbase printed round-number lows (102k and 107k).
Round-number lows are considered “bad lows” because they attract clustered stop-loss orders and create obvious liquidity pools underneath.
Studies on market microstructure (e.g., Osler 2003; Kamps & Klein 2018) confirm that price clustering at round numbers is a real behavioral bias in FX and crypto markets.
Real market bottoms are messy, chaotic, and rarely form at clean, even levels.
These “perfect” lows often get revisited or swept later as the market clears liquidity and finds true balance.
How the Flush Works in Spot Markets
Even though spot markets don’t have leverage liquidations, they still experience stop cascades and panic selling.
When price breaks below a clean low, it triggers stops, sending a surge of sell orders into thin liquidity.
Market makers step in to absorb those orders and rebuild liquidity from a more stable base.
This is what traders call a spot flush — the market removing weak hands and resetting liquidity.
Conceptually, it’s the same as a liquidation flush in futures, just without forced margin calls.
What Arbitrage Does
Arbitrage keeps prices between exchanges in check.
When Bitcoin trades cheaper on Binance than on Coinbase, arbitrage traders buy on Binance and sell on Coinbase.
This pushes the cheap venue’s price up and the expensive one down until they align.
Makarov & Schoar (2020, NBER) showed that cross-exchange price deviations in Bitcoin are temporary and mean-reverting, driven by arbitrage capital restoring equilibrium.
Kaiko research (2021–2023) also found that USD and USDT pairs often decouple during stress events, especially when stablecoin liquidity or banking rails get disrupted, and later realign once volatility settles.
That’s exactly what we’re seeing now: a temporary dislocation that arbitrage will eventually close.
What I Expect
Binance already swept liquidity down to 102k.
Coinbase still has a clean 107k low that hasn’t been tested.
To rebalance both exchanges, I expect Coinbase to trade within 1% of the Binance 102k low, meaning roughly 103k–104k.
That would bring both markets back into alignment and complete a proper spot flush.
This isn’t a guaranteed move, but it’s a logical rebalancing target supported by historical arbitrage behavior.
What Could Happen Before That
We could still see Bitcoin move back toward 118k–120k before a potential drop.
After major liquidation events, markets often retrace sharply as liquidity rebuilds and shorts get squeezed.
A move higher doesn’t invalidate the idea of a later sweep; it could just be part of the natural reset phase before the market finds true equilibrium.
What I’m Watching
The spread between Coinbase/USD and Binance/USDT narrowing from around 5% to about 1%.
Coinbase breaking below 107k and testing the 104–102k zone.
A liquidity sweep followed by a strong reclaim and visible buy volume.
If we move up first, I’ll watch price behavior around 118k–120k for signs of exhaustion.
My Plan (Not Financial Advice)
I’m staying patient and letting the market mechanics reset.
If Coinbase trades into the 103k–102k zone, that’s my “let’s see what’s going on now” trigger.
That doesn’t mean I’ll instantly go long — it means I’ll start watching the data:
Volume and delta (are buyers stepping in?)
Strength of reclaim (is the recovery fast and decisive?)
Order book depth (is liquidity returning?)
What is Open Interest doing?
Do we see absorption? Or maybe a continuation pattern even?
Only if those metrics confirm strength will I consider entering.If not, I’ll stay flat and wait for the next confirmation.
So, TLDR;
Both Binance and Coinbase printed clean, round-number lows that are likely to be swept again. Arbitrage will eventually bring the spot markets back into balance, which should pull Coinbase closer to Binance’s 102k low. We might even see a push toward 120k first as liquidity resets. Either way, patience is key: let arbitrage, liquidity, and order flow do their job before taking any position.
And remember: Patience in trading isn’t about doing nothing, it’s about waiting for the odds to align in your favor. Chasing every move might feed the ego, but patience compounds the account. The market always rewards the trader who can sit still when everyone else is reacting.
Trade safe!

ETHUSDTHello Traders! 👋
What are your thoughts on Ethereum?
Ethereum is currently trading between two major zones of support and resistance.
In this range, we expect a short-term correction toward the ascending trendline, followed by some consolidation before a potential breakout above the resistance zone.
If the support holds, followed by a positive reaction from the trendline and a breakout above the resistance level, Ethereum is expected to begin a new bullish wave and move higher toward the identified target levels.
If a daily candle closes below $3,500, this bullish scenario will be invalidated and a deeper correction could follow.
Don’t forget to like and share your thoughts in the comments! ❤️

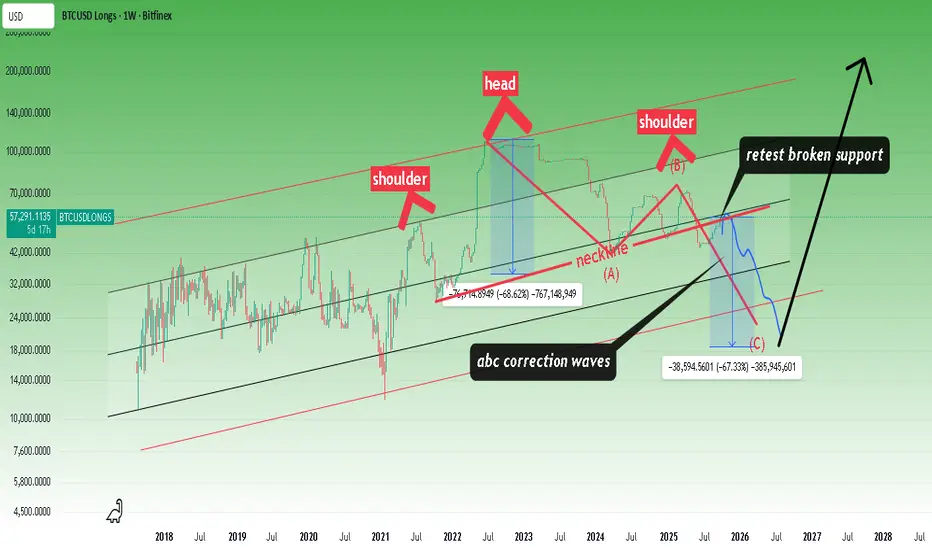
Corrective waves continue.Bitcoin's bullish sentiment still far outweighs its bearish sentiment. In my opinion, this is a balancing act. I think the market will stabilize in the coming months.
* The purpose of my graphic drawings is purely educational.
* What i write here is not an investment advice. Please do your own research before investing in any asset.
* Never take my personal opinions as investment advice, you may lose your money.
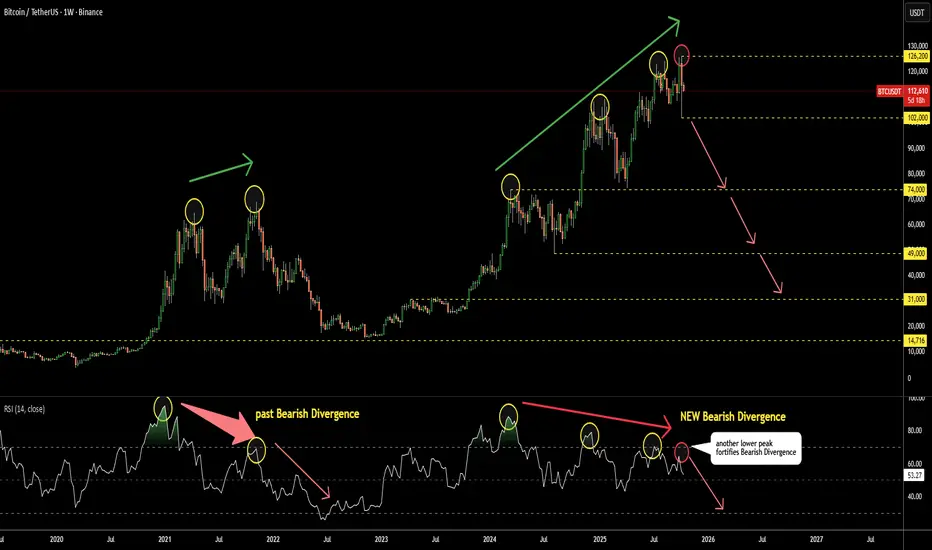
Bitcoin Update: Bearish Divergence on RSI Only Deepens This is a brief update to the analysis shared in August. The RSI has now formed a fourth consecutive lower peak on the weekly chart, further confirming the bearish divergence.
Monitor the RSI closely — a break below 50 (currently at 53) could signal the onset of a bear market.
The first key support level is near 102K, and a decisive move below this level would strengthen the bearish outlook.
BITCOIN... THE DROP IS NOT OVER YET!I see a lot of people fomo-ing to buy the dip, but I don't think this is the bottom yet. At least, that is not what my technical analysis is showing me.
I am expecting Bitcoin to likely go down to the 100k level again, maybe even less to 95k. The question is, will it go back up from there? I think there is a good possibility to make new all-time highs. BUT, if it does not show support or bounce hard, and higher timeframe candles start to close lower, this could mean quite bad things for crypto..
Let's wait and see..
Trade safe!
- R2F

ElDoradoFx PREMIUM 2.0 - (14/10/2025, ASIA SESSION)BTC is trading around 115,700, consolidating after a strong recovery from 110,000.
Price has broken above intraday structure and is now approaching a key confluence resistance zone near 116,000–116,250.
⸻
🔍 Technical Outlook
Daily Structure (1D):
• The pair continues to recover from the previous sweep at 107,700, forming a clear higher low on the daily.
• Momentum indicators (MACD and RSI) show bullish continuation, though still below the main descending trendline from 126,000.
• The Fibonacci retracement (126,000 → 102,200) highlights the Golden Zone at 116,700–118,800, where sellers could return.
1H Structure:
• Market structure flipped bullish after BOS at 114,400.
• EMA50 and EMA200 are showing early bullish crossover, confirming momentum shift.
• The 1H MACD is widening positively, and RSI near 67 suggests BTC is building strength but nearing intraday overbought conditions.
15M + 5M (Intraday Setup):
• Price is forming a rising channel with higher highs and higher lows.
• MACD histogram shows bullish momentum continuation; RSI is consolidating near the 70 zone.
• Current resistance: 115,950–116,250 (FVG + weak high)
• Strong support: 114,400–114,800 (EQL + 200 EMA + trendline support)
This zone is ideal for a break and retest setup confirmation.
⸻
📌 Breakout Levels to Continue Trend
Bullish continuation:
• Break above 116,250, retest 115,900–116,000 → targets 116,900 / 117,800 / 118,800 (Golden Zone)
Bearish correction:
• Break below 114,400, retest 114,600–114,800 → targets 113,600 / 112,900 / 111,800
⸻
📅 Fundamental Watch
• Asia session expected low volatility, but volume could build ahead of London open.
• Focus remains on U.S. CPI (Wednesday) — volatility likely to increase midweek.
• No major Asian economic events today.
⸻
⚠ Key Levels to Monitor
Resistance zones:
116,250 / 116,900 / 117,800 / 118,800
Support zones:
115,000 / 114,400 / 113,600 / 111,800
⸻
✅ Summary
BTC remains bullish short-term after reclaiming 115k support, but momentum is slowing near 116,200 — a key supply area.
A break and retest above 116,250 opens continuation toward 117.8k–118.8k (Fibonacci Golden Zone), while a rejection at 116,000 could send price back toward 114.4k support for re-entry.
Bias: Bullish with caution near 116k–118k resistance.
