BTCUSDT 1H🔎 Chart Context
• Pair: BTC/USDT
• Exchange: Binance
• Timeframe: 1H (intraday)
• Date: 20 August 2025
• Current price: ~113,578
The chart uses Fair Value Gaps (FVG), Change of Character (CH), Supply/Demand blocks, and liquidity sweeps to track short-term moves.
📊 Key Observations
1. Overall Structure
• BTC is in a clear short-term downtrend on the 1H timeframe.
• Price broke down from 116,500–117,000 supply block, confirming a bearish CH 1H.
• Since then, the structure has been forming lower highs and lower lows.
2. Fair Value Gap (FVG)
• An FVG is marked near ~115,500–115,800.
• Price is currently trading well below this zone.
• Typically, market tends to retrace into FVG zones before resuming the main direction (here: bearish).
3. Liquidity Levels
• Above: Liquidity around 115,000–115,800 (FVG) → potential pullback target.
• Below: Liquidity pools near 112,000–111,000 demand block.
• A deeper liquidity sweep could reach 110,500–111,000, marked as the downside magnet.
4. Support & Demand Zones
• 113,000–112,000: Nearest minor support.
• 111,000–110,500: Major demand block, strong liquidity resting here.
5. Resistance & Supply Zones
• 115,000–115,800 FVG zone: Key intraday supply area.
• 116,500–117,000: Higher timeframe supply where the breakdown started.
📈 Bullish Scenario (Countertrend Relief Rally)
• If BTC defends 113,000 support, expect a bounce into 115,000–115,800 FVG.
• This would be a retracement move, not a trend reversal.
• Path: 113,000 → 115,000–115,800 → rejection.
• Only a clean reclaim of 117,000 CH zone would flip short-term bias bullish again.
📉 Bearish Scenario (Higher Probability)
• Trend is already bearish, so the likely path is:
1. Short retracement into 115,000–115,800 FVG.
2. Continuation lower toward 112,000.
3. Final sweep into 111,000–110,500 demand zone (major liquidity target).
• This scenario is also drawn on your chart with the projected arrow.
⚡ Trading Plan
• Short Setup (Preferred):
• Entry: 115,000–115,800 FVG zone.
• TP1: 113,000
• TP2: 112,000
• TP3: 111,000–110,500 demand
• Stop: Above 117,000 (CH invalidation).
• Long Setup (Risky, Countertrend):
• Entry: 111,000–110,500 demand zone.
• TP1: 113,000
• TP2: 115,000 FVG
• Stop: Below 110,000
BTCUSDT

BTC 1H Analysis – Key Triggers Ahead | Day 17💀 Hey , how's it going ? Come over here — Satoshi got something for you !
⏰ We’re analyzing BTC on the 1-hour timeframe timeframe .
👀 On the 1-hour timeframe, we can see that Bitcoin, after losing the $115,000 support zone, moved toward its next support at $113,000 .
⚙️ Our key RSI zone is 27.89, and if this level is lost, Bitcoin will face more selling pressure. The next key RSI zone is 49.74, and breaking above this level could push Bitcoin higher .
🕯 The size of the red candles has increased, and with each rise in trading volume, selling pressure grows stronger. Step by step, as supports are lost (big money in whale wallets and unrealized positions being released), Bitcoin faces heavier selling pressure .
💵 USD.D on the 1-hour timeframe is moving upward and is facing a strong resistance around 4.5%. If this resistance is broken, Bitcoin will likely come under even more selling pressure .
🔔 Our Bitcoin alert zone is set at $113,000: if this zone is broken, Bitcoin could fall to lower support levels. Our alert zone for a long trade is $115,000, and by observing price action around these two zones, we can identify the best type of trade .
❤️ Disclaimer : This analysis is purely based on my personal opinion and I only trade if the stated triggers are activated .

Bitcoin Short Setup & Long-Term Buy ZonesMy next BTC trade: short from 114,910 with a target of 111,375.8 and stop at 115,902.6.
Setup comes from the 4H order block above FVG in NY session. Expect a pullback here, then a possible next leg up toward 140K.
Also a great SPOT buy level after the short.
Key supports to watch:
110,000–109,000 (critical to hold)
Below that: 99,000–103,000
Final long-term support: 88,000–89,000.
⚠️ This is not financial advice — only my next BTC trade plan.

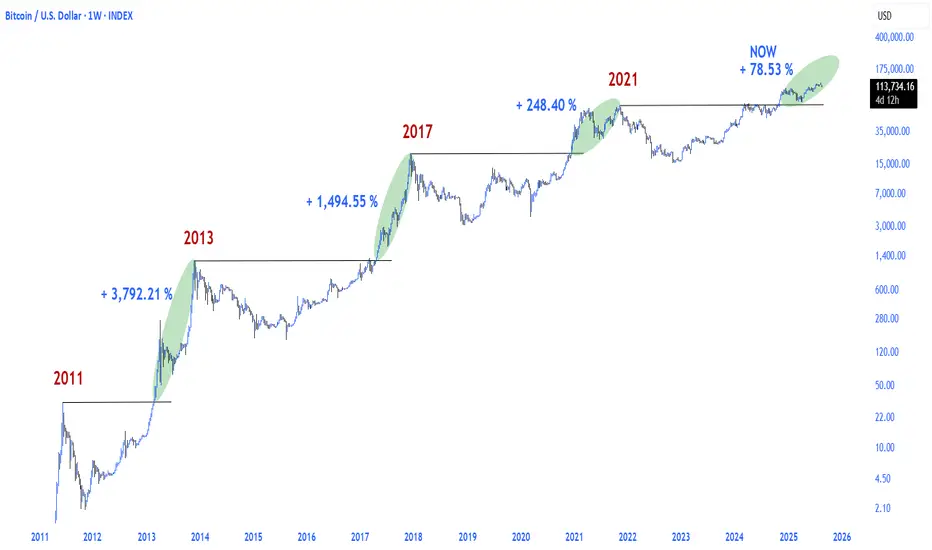
Bitcoin has not yet reached its local peakBitcoin has not yet reached its local peak and still has considerable room for growth.
CRYPTOCAP:BTC
BTC/USD) Technical analysis Read The captionSMC Trading point update
Technical analysis of BTC/USD daily chart analysis you shared:
---
Analysis Idea – Bitcoin (BTC/USD)
1. Key Resistance Zone (Yellow Box):
BTC faced multiple rejections from the highlighted resistance area (shown by red arrows), indicating strong selling pressure.
2. Trendline Break:
A clear break below the ascending trendline confirms weakness in bullish momentum and suggests a shift toward bearish structure.
3. EMA 200 (Blue Line):
The 200-day EMA at 103,179 acts as a dynamic support. If price continues downward, it will likely test this area.
4. Target Zone:
Bearish continuation points toward the 100,720 – 100,419 support zone, marked as the target point on the chart.
5. RSI (42.74):
RSI is trending lower, supporting bearish momentum but not yet oversold — indicating more room for downside before a potential bounce.
Mr SMC Trading point
---
Idea Summary:
Bitcoin is showing signs of a bearish reversal after repeated resistance rejections and a trendline break. Price is likely to head lower toward the 100,700 region, with the 200 EMA providing possible short-term support.
Please support boost 🚀 this analysis)

Bitcoin possible correction?📈 Hey Traders!
Here’s a fresh outlook from my trading desk. If you’ve been following me for a while, you already know my approach:
🧩 I trade Supply & Demand zones using Heikin Ashi chart on the 4H timeframe.
🧠 I keep it mechanical and clean — no messy charts, no guessing games.
❌ No trendlines, no fixed sessions, no patterns, no indicator overload.
❌ No overanalyzing market structure or imbalances.
❌ No scalping, and no need to be glued to the screen.
✅ I trade exclusively with limit orders, so it’s more of a set-and-forget style.
✅ This means more freedom, less screen time, and a focus on quality setups.
✅ Just a simplified, structured plan and a calm mindset.
💬 Let’s Talk:
💡Do you trade supply & demand too ?
💡What’s your go-to timeframe ?
💡Ever tried Heikin Ashi ?
📩 Got questions about my strategy or setup? Drop them below — ask me anything, I’m here to share.
Let’s grow together and keep it simple. 👊
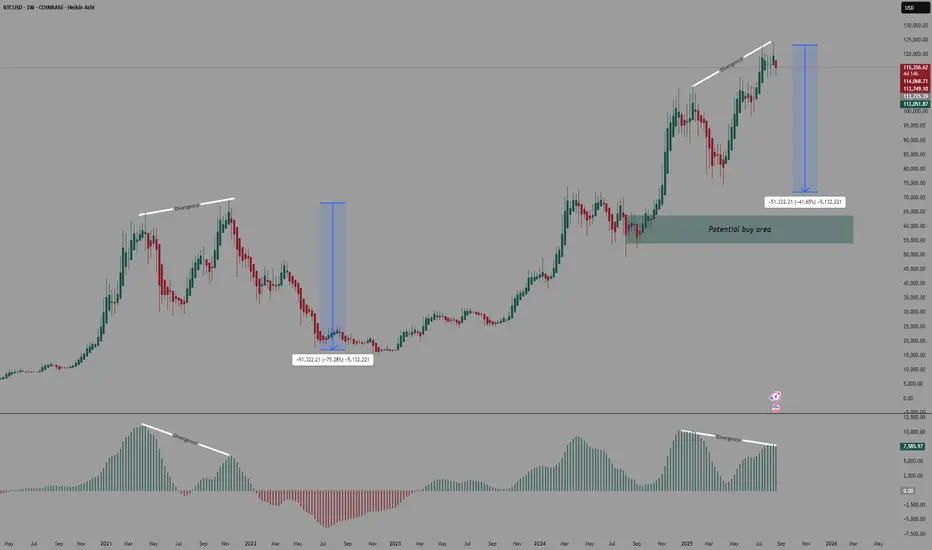
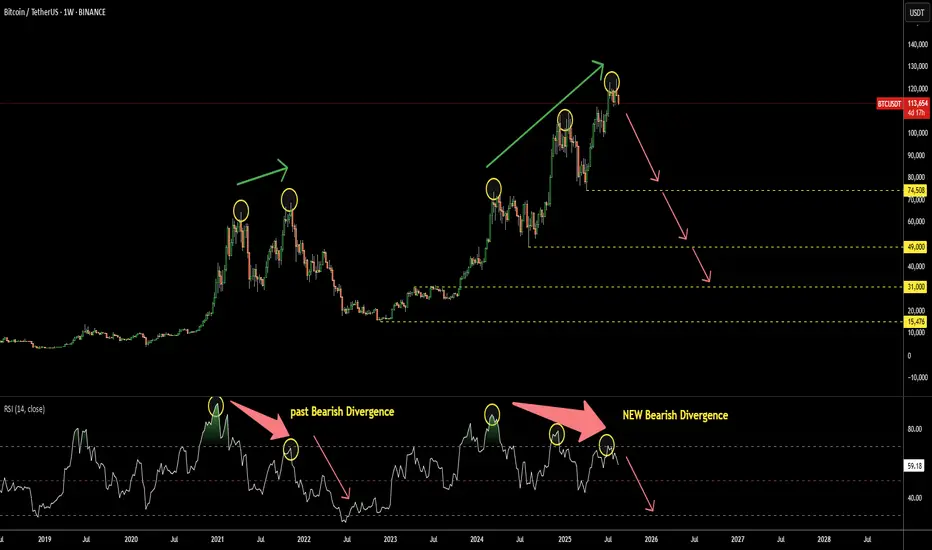
Bitcoin: This Simple Indicator Predicts Crash AheadThe Relative Strength Index (RSI) is a simple yet effective indicator, especially when it doesn't follow the market. This situation is called Divergence.
It has recently appeared on the Bitcoin chart as Bearish Divergence. This occurs when the market price makes a new peak, but the RSI, on the contrary, forms lower highs.
Looking back at the same chart, we can rewind to 2021, where a similar Bearish Divergence played out, pushing Bitcoin’s price down heavily from $69k to $15k.
This time, the Bearish Divergence on RSI is more pronounced, as it consists of 3 ascending peaks on the price chart, contrasted with 3 falling tops on the RSI sub-chart.
There are 4 key supports that could underpin the anticipated crash:
1) $74.5k - This year’s bottom
2) $49k - Consolidation low in 2024
3) $31k - Consolidation top in 2023
4) $15.5k - 2022 minimum
Where do you think the crash will stop?
Double-Top: Bitcoin Headed Toward Support, $100K ActiveWe are using long-term numbers. The number that produced the double-top bearish signal is $122,524. Bitcoin couldn't pass beyond this level. The weekly rejection reveals that a test of support will follow next.
Before $122,524 the next major Fib. level sits at $102,077, the 1.618 extension. This is where Bitcoin is headed next.
We have $112,000 as support but this a short-term support. Notice this weekly chart more focused on the long-term. Here it is easier to see, easier to appreciate that Bitcoin is not likely to hold $112K. Nothing to worry about though.
A drop toward $100,000 (above) would mean a full flush for Bitcoin and the doors opening for a new major wave of growth. Make no mistake, the current move is running its course.
Bitcoin is likely to drop only for a few more days. Settle the low, recover long-term. The altcoins will shake but will also recover in a matter of days. This is a momentary event, Crypto will continue to grow. The bull market is not over. The best is yet to come.
Namaste.

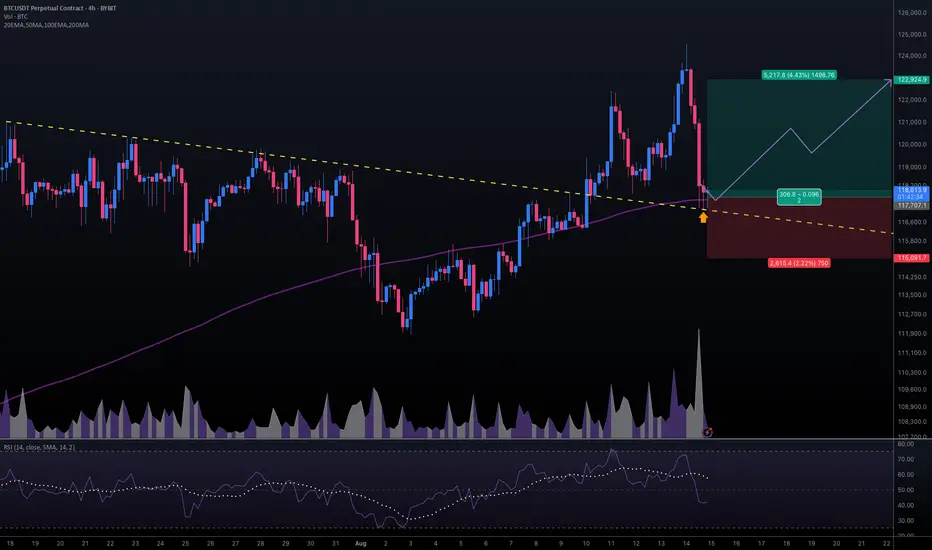
#BTCUSDT #4h (ByBit) Descending trendline breakout and retestBitcoin pulled back to 200MA support where it printed a kind of bullish hammer, seems likely to bounce.
⚡️⚡️ #BTC/USDT ⚡️⚡️
Exchanges: ByBit USDT
Signal Type: Regular (Long)
Leverage: Isolated (18.0X)
Amount: 5.0%
Entry Targets:
1) 117707.1
Take-Profit Targets:
1) 122924.9
Stop Targets:
1) 115091.7
Published By: @Zblaba
CRYPTOCAP:BTC BINANCE:BTCUSDT.P #4h #Bitcoin #PoW bitcoin.org
Risk/Reward= 1:2.0
Expected Profit= +79.8%
Possible Loss= -40.0%
Estimated Gaintime= 1 week
BTCUSDTHello Traders! 👋
What are your thoughts on BITCOIN?
After setting a new high, Bitcoin failed to hold above the broken resistance zone and was rejected, falling back below the previously breached level.
The ascending trendline has also been broken, and price is currently attempting a pullback to the broken structure. As long as BTC stays below the resistance zone, we expect a move lower toward the next key support levels.
Bigger picture outlook remains bullish on higher timeframes, but in the short term, a deeper correction is likely.
Invalidation: A strong breakout and daily close above the resistance zone would negate the bearish short-term scenario and resume the broader uptrend.
Don’t forget to like and share your thoughts in the comments! ❤️

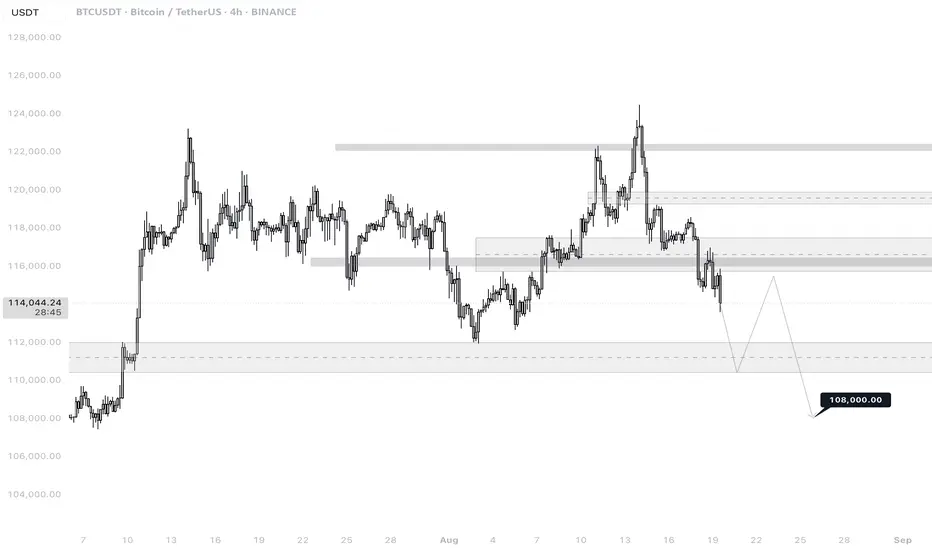
BTCUSDT 4H
🔎 Chart Context
• Pair: BTC/USDT
• Exchange: Binance
• Timeframe: 4H (240M)
• Date: 19 August 2025
This chart is mapped using liquidity zones, supply/demand levels, and structural market shifts to project BTC’s likely next move.
📊 Key Observations
1. Current Price Action
• BTC is trading around 114,050, following a sharp decline from the 124,000–125,000 resistance zone.
• The structure shifted bearish after rejection from the upper supply block.
• Current momentum is pushing toward deeper demand levels.
2. Support & Demand Zones
• 112,000–111,000: Nearest significant demand zone; previously acted as strong support after July accumulation.
• 108,000: Major liquidity target marked on the chart — a strong confluence area where large stop orders and institutional bids are likely to be placed.
3. Resistance Zones
• 118,000–119,000: Nearest overhead supply zone; likely to act as resistance on any short-term bounce.
• 124,000–125,000: Major resistance block that caused the latest rejection.
4. Liquidity Behavior
• BTC has already swept liquidity at 116,000–115,000 zone, triggering further downside.
• Liquidity magnets now sit lower, especially at 108,000, which is the projection target.
• Expect volatility as price interacts with the 111,000–112,000 demand block.
5. Projected Path
• Base case scenario (drawn on chart):
• Drop into 111,000–112,000 demand zone.
• Relief bounce toward 116,000–118,000 (supply retest).
• Continuation lower into 108,000 liquidity sweep.
📈 Bullish Case (Lower Probability, Countertrend)
• If BTC holds 112,000–111,000 demand zone strongly and invalidates supply at 118,000–119,000:
• First target: 120,000.
• Second target: 124,000–125,000 retest.
• Requires strong volume and supportive macro flows (e.g., USD weakness, strong equities).
📉 Bearish Case (Higher Probability)
• Structure favors downside continuation.
• Path:
• Retest of 116,000–118,000 supply zone (failed rally).
• Breakdown continuation to 108,000 liquidity target.
• This scenario aligns with broader DXY/EURUSD outlook where USD remains weak short-term but BTC could still flush liquidity before next bullish cycle.
⚡ Trading Plan
• Short Bias (Preferred Play):
• Entry: Relief rallies into 116,000–118,000.
• TP1: 112,000
• TP2: 108,000
• Stop: Above 120,000
• Long Setup (Risky, Countertrend):
• Entry: 111,000–112,000 demand zone.
• TP: 118,000
• Stop: Below 108,000
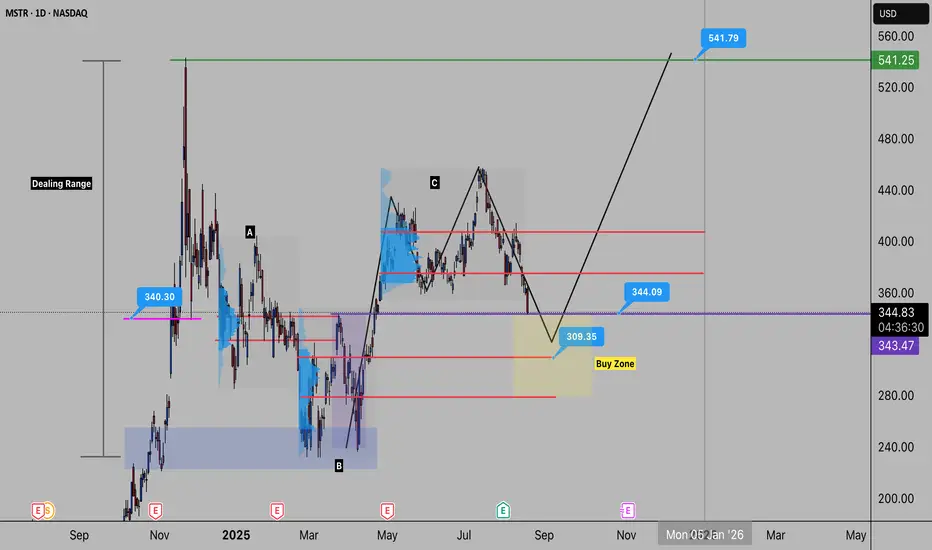
Buy the F out of MSTR? - Bullish IdeaI’m watching MicroStrategy (MSTR) closely here — the chart is setting up for what looks like a strong bullish opportunity.
(the content below is documenting the chart from left to right)
🔎 Key Observations
Demand Zone: Back in August 2024, price reacted strongly from the $225 zone, rallying ~100%. Clear evidence of institutional demand.
Current Structure: Price has been ranging between $225 – $550. The midpoint zone (~$325–$375) is where the most important reactions are likely to form.
Volume Zones:
Zone A → Already tested.
Zone B → Untested, showing potential bullish reaction.
Zone C → Looks bearish on the surface, but could be a manipulation zone (push down to fill institutional orders).
Liquidity Sweep: The purple zone shows price ran weekly highs, reversed, then closed back above — a classic liquidity grab, suggesting institutions may defend this area.
🧩 Market Structure & Pattern
Structure shows a bullish impulse with a crab pattern forming.
Completion expected around 50–61.8% retracement, possibly as deep as 78.6%.
Buy zone of interest: $325.
🎯 Trade Plan
Entry Zone: $325 area.
Targets:
First resistance: $375–$400 (must clear here).
Final target: $550.
Bias: Bullish, holding for continuation higher as long as $225 remains protected.
✅ To summarize: I’m bullish on MicroStrategy here. Watching for a buy reaction around $325 with a target of $550. Price will need to prove itself through the $375–$400 zone before continuation.
Bitcoin on the Edge! Will $114K Hold or Break?Bitcoin ( BINANCE:BTCUSDT ) started to decline from the Potential Reversal Zone(PRZ) as I expected in the previous idea .
Bitcoin currently appears to have managed to break the Support zone($116,900-$115,730) and is currently trading near the Support zone($114,720-$113,570) , 50_EMA(Daily) , Monthly Pivot Point , and Cumulative Long Liquidation Leverage($114,300-$113,841) .
In terms of Elliott Wave theory , it appears that Bitcoin is completing microwave 4 of the main wave 3 (probably), and we should expect a re-attack on the Support zone($114,720-$113,570) in the coming hours .
I expect Bitcoin to attack the Support zone($114,720-$113,570) at least once more after completing the pullback to the Support zone($116,900-$115,730) from Cumulative Short Liquidation Leverage($116,411-$115,760) and if it breaks , we should expect a drop to the Heavy Support zone($111,980-$105,820) .
Cumulative Short Liquidation Leverage: $120,115-$118,751
Note: Stop Loss(SL): $117,320
Please respect each other's ideas and express them politely if you agree or disagree.
Bitcoin Analyze (BTCUSDT), 1-hour time frame.
Be sure to follow the updated ideas.
Do not forget to put a Stop loss for your positions (For every position you want to open).
Please follow your strategy and updates; this is just my Idea, and I will gladly see your ideas in this post.
Please do not forget the ✅' like '✅ button 🙏😊 & Share it with your friends; thanks, and Trade safe.

BTC 1H Analysis – Key Triggers Ahead | Day 16💀 Hey , how's it going ? Come over here — Satoshi got something for you !
⏰ We’re analyzing BTC on the 1-hour timeframe timeframe .
👀 On the 1-hour timeframe for Bitcoin, we can see that after losing the $115,000 support zone, Bitcoin is moving toward lower price levels. With increasing selling pressure, a deeper correction is likely.
⚙️ Our key RSI level is 33. If this level breaks down, short positions will gain more momentum, and the probability of entering the oversold zone will increase.
🕯 Candlestick behavior shows that bearish/red candles are larger in size and volume, initiating each corrective wave strongly. In contrast, bullish candles are smaller in size, higher in number, and have less volume, which reflects the strong dominance of sellers.
💵 USDT dominance (1-hour timeframe) has successfully broken above 4.37%. The next resistance lies at 4.50%. If this level is also broken, it will likely trigger even more selling pressure on Bitcoin.
🔔 Alarm Zone : There is no specific alarm zone right now, but by watching for pullbacks and breakouts in either direction, we can determine when to open new positions.
❤️ Disclaimer : This analysis is purely based on my personal opinion and I only trade if the stated triggers are activated .

TradeCityPro | Bitcoin Daily Analysis #157👋 Welcome to TradeCity Pro!
Let’s move on to the Bitcoin analysis. Bitcoin is still in correction mode and moving toward the 110000 zone. Let’s see how the market looks today.
⏳ 4-Hour Timeframe
Yesterday, Bitcoin made a pullback to the 116829 zone and is now ready to continue its decline.
💥 First, let’s check the RSI. This oscillator is very close to the 30 zone, and if this zone breaks, market momentum can turn bearish.
📉 The next support for this oscillator is 24.60. Based on the chart’s history, the probability of RSI being supported at this zone is high, but the distance between this zone and 30 can also trigger a sharp drop.
✔️ The price zone that Bitcoin could reach if RSI moves downward is 112233. The trigger for this bearish move was 114790, which is already being broken with this 4-hour candle. Let’s switch to the 1-Hour timeframe to see more details.
⏳ 1-Hour Timeframe
As you can see in this timeframe, after the pullback to 116829, a trigger formed at 114790, and the price is now breaking this zone.
📊 Given that RSI was rejected from the 50 zone, the price set a lower high compared to 116829, and the selling volume in the current candle increased, the probability of a move toward 112233 has increased significantly.
⭐ For a short position, we can enter with the break of this zone. As usual, I won’t open any position as long as Bitcoin is above 110000, and I recommend you don’t open shorts for now either.
📈 For a long position, the first trigger we have is the break of 116289. In case the break of 114790 turns out to be fake, we can also open a long position by confirming a V-Pattern.
❌ Disclaimer ❌
Trading futures is highly risky and dangerous. If you're not an expert, these triggers may not be suitable for you. You should first learn risk and capital management. You can also use the educational content from this channel.
Finally, these triggers reflect my personal opinions on price action, and the market may move completely against this analysis. So, do your own research before opening any position.

Bitcoin Market Update – August 19, 2025: Key Levels to WatchDear Crypto Enthusiast,
As of August 19, 2025, here is your latest Bitcoin (BTC) market analysis to help you stay ahead in this dynamic market.
Bitcoin Price Overview
Bitcoin recently experienced a pullback from its mid-August highs around $124,000, settling near the critical support level of $115,000. This zone could act as a launching point for a potential rebound or signal further volatility depending on upcoming market dynamics.
What the Technicals Are Saying
Short-term bullish momentum is visible as BTC oscillates between $115,000–$117,500. A decisive close above this range would reinforce upward momentum.
Should BTC dip below $110,000, it might trigger deeper corrections in the near term.
Looking Ahead
August trading is expected to be volatile, with BTC price fluctuating roughly between $115,600 and $122,000.
Forecasts suggest an upward surge in September, possibly pushing Bitcoin prices up to $131,700.
Market Sentiment and Outlook
Post-correction rallying from $112,000 lows indicates renewed bullish interest, supported by rising activity on CME futures and strengthening institutional demand. As digital asset treasuries grow cautiously, the medium-term outlook for Bitcoin remains constructive.
What This Means for You
Monitor the $115,000 support closely; it’s pivotal for near-term trading strategies.
Watch for potential breakouts above $117,500 as confirmation of sustained buying pressure.
Stay alert to macroeconomic factors that can influence crypto markets overall.
Stay tuned with CryptosignalApp for real-time signals and expert market insights to capitalize on Bitcoin’s evolving trends.
Trade smart, trade informed.
Best regards,
The CryptosignalApp Team
